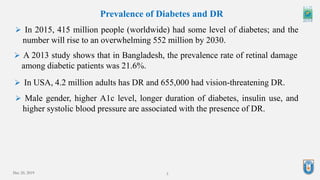
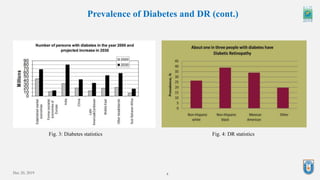
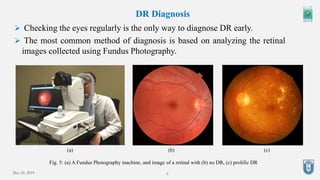
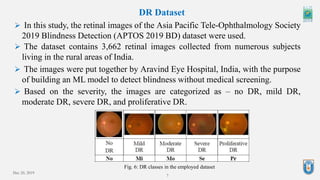
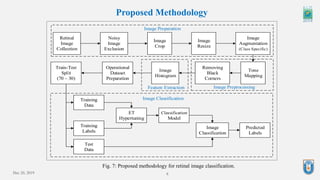
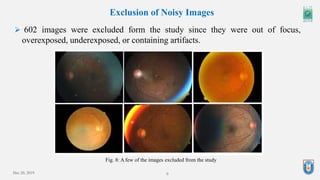
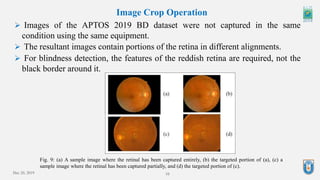
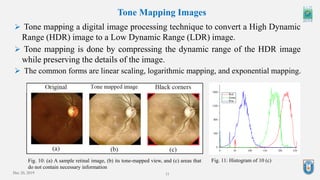
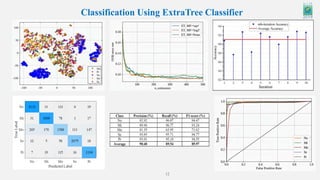
Early Blindness Detection Based on Retinal Images Using
Ensemble Learning
[Conference Presentation]
Contributing Authors
Niloy Sikder
M.Sc. Student
CSE Discipline
Khulna University, Khulna
niloysikder333@gmail.com
Md. Sanaullah Chowdhury
B.Sc. Student
ECE Discipline
Khulna University, Khulna
sanaullahashfat@gmail.com
Dr. Abdullah Al Nahid
Associate Professor
ECE Discipline
Khulna University, Khulna
nahid.ece.ku@gmail.com
Abu Shamim Mohammad Arif
Professor
CSE Discipline
Khulna University, Khulna
shamimarif@yahoo.com
Presenter
Md. Sanaullah Chowdhury
Dec 20, 2019 1
Diabetic Retinopathy (DR)
Fig. 1: Blood vessels surrounding a normal
retina, and a retina with DR[1]
 A medical condition where the retina is affected by Diabetes.
 Diabetes vandalizes the blood vessels within the retinal tissue, causes them to
leak blood, fluids, and lipids inside the macula; and blocks them completely.
 It may also caused by the formation on new (uncontrolled)
blood vessels on the retina.
 Because of these disruptions, light can not be projected
properly on the retinal surface to create the sense of vision.
 Symptoms may not be apparent at the early stages making it
hard to diagnose early.
 DR can cause permanent vision loss.
Dec 20, 2019 2
DR Effects
Fig. 2: (a) Normal vision, (b, c, d) vision of a person with DR[2]
 A person with DR may experience blurred vision, floaters, blank areas or glare
because of the retinal damage.
(b)
(a)
(d)
(c)
3
Prevalence of Diabetes and DR
 In 2015, 415 million people (worldwide) had some level of diabetes; and the
number will rise to an overwhelming 552 million by 2030.
 A 2013 study shows that in Bangladesh, the prevalence rate of retinal damage
among diabetic patients was 21.6%.
 In USA, 4.2 million adults has DR and 655,000 had vision-threatening DR.
 Male gender, higher A1c level, longer duration of diabetes, insulin use, and
higher systolic blood pressure are associated with the presence of DR.
Dec 20, 2019
4
Prevalence of Diabetes and DR (cont.)
Fig. 3: Diabetes statistics Fig. 4: DR statistics
Dec 20, 2019
5
DR Diagnosis
Fig. 5: (a) A Fundus Photography machine, and image of a retinal with (b) no DR, (c) prolific DR
 Checking the eyes regularly is the only way to diagnose DR early.
 The most common method of diagnosis is based on analyzing the retinal
images collected using Fundus Photography.
(a) (b) (c)
Dec 20, 2019
Dec 18, 2019 6
Why Use Machine Learning (ML) in the Diagnosis of DR?
 To ensure rapid/ periodic eye examination.
 To provide an easy way to check the health of the eyes so that people do not
hesitate to check every once in a while.
 Especially helpful to the people of poor economy.
 To save time and money.
 To lower the rate of vision loss due to prolific DR.
Dec 20, 2019
7
DR Dataset
Fig. 6: DR classes in the employed dataset
 In this study, the retinal images of the Asia Pacific Tele-Ophthalmology Society
2019 Blindness Detection (APTOS 2019 BD) dataset were used.
 The dataset contains 3,662 retinal images collected from numerous subjects
living in the rural areas of India.
 The images were put together by Aravind Eye Hospital, India, with the purpose
of building an ML model to detect blindness without medical screening.
 Based on the severity, the images are categorized as – no DR, mild DR,
moderate DR, severe DR, and proliferative DR.
Dec 20, 2019 8
Proposed Methodology
Fig. 7: Proposed methodology for retinal image classification.
Image Preparation
Image Preprocessing
Retinal
Image
Collection
Image
Crop
Image
Resize
Tone
Mapping
Image
Histogram
Noisy
Image
Exclusion
Operational
Dataset
Preparation
Train-Test
Split
(70 – 30)
Training
Data
Training
Labels
Test
Data
Classification
Model
ET
Hypertuning
Predicted
Labels
Image
Classification
Image
Augmentation
(Class Specific)
Removing
Black
Corners
Image Classification
Feature Extraction
Dec 20, 2019 9
Exclusion of Noisy Images
Fig. 8: A few of the images excluded from the study
 602 images were excluded form the study since they were out of focus,
overexposed, underexposed, or containing artifacts.
Dec 20, 2019 10
Image Crop Operation
Fig. 9: (a) A sample image where the retinal has been captured entirely, (b) the targeted portion of (a), (c) a
sample image where the retinal has been captured partially, and (d) the targeted portion of (c).
 Images of the APTOS 2019 BD dataset were not captured in the same
condition using the same equipment.
 The resultant images contain portions of the retina in different alignments.
 For blindness detection, the features of the reddish retina are required, not the
black border around it.
Dec 20, 2019 11
Tone Mapping Images
Fig. 10: (a) A sample retinal image, (b) its tone-mapped view, and (c) areas that
do not contain necessary information
 Tone mapping a digital image processing technique to convert a High Dynamic
Range (HDR) image to a Low Dynamic Range (LDR) image.
 Tone mapping is done by compressing the dynamic range of the HDR image
while preserving the details of the image.
 The common forms are linear scaling, logarithmic mapping, and exponential mapping.
Fig. 11: Histogram of 10 (c)
Classification Using ExtraTree Classifier
12
Scopes for Future Studies
 Include the Omitted images and extract features from them
 Devise a plan to deal with the noisy labels
 Hyper-tune the model to provide better classification performance
 Work on to develop a new model that will provide better performance
 Include various feature engineering techniques for feature reduction
Dec 20, 2019 13
14
References
[1] F. Bandello, M. A. Zarbin, R. Lattanzio, and I. Zucchiatti, Clinical Strategies in the Management of Diabetic Retinopathy. Springer-Verlag Berlin
Heidelberg, 2014.
[2] B. Lumbroso, M. Rispoli, and M. C. Savastano, Diabetic Retinopathy. Jaypee Brothers Medical Publisher, 2015.
[3] J. Chua, C. X. Y. Lim, T. Y. Wong, and C. Sabanayagam, “Diabetic retinopathy in the Asia-pacific,” Asia-Pacific Journal of Ophthalmology, vol. 7, no.
1. pp. 3–16, 01-Jan-2018.
[4] A. Akhter, K. Fatema, S. F. Ahmed, A. Afroz, L. Ali, and A. Hussain, “Prevalence and associated risk indicators of retinopathy in a rural Bangladeshi
population with and without diabetes.,” Ophthalmic Epidemiol., vol. 20, no. 4, pp. 220–7, Aug. 2013.
[5] M. S. Chowdhury, F. R. Taimy, N. Sikder, and A.-A. Nahid, “Diabetic Retinopathy Classification with a Light Convolutional Neural Network,” in 2019
International Conference on Computer, Communication, Chemical, Materials and Electronic Engineering ( IC4ME2), in press.
[6] M. U. Akram, S. Khalid, and S. A. Khan, “Identification and classification of microaneurysms for early detection of diabetic retinopathy,” Pattern
Recognit., vol. 46, no. 1, pp. 107–116, Jan. 2013.
[7] B. Antal and A. Hajdu, “An ensemble-based system for automatic screening of diabetic retinopathy,” Knowledge-Based Syst., vol. 60, pp. 20–27, 2014.
[8] S. Wang, Y. Yin, G. Cao, B. Wei, Y. Zheng, and G. Yang, “Hierarchical retinal blood vessel segmentation based on feature and ensemble learning,”
Neurocomputing, vol. 149, no. PB, pp. 708–717, Feb. 2015.
[9] E. Saleh et al., “Learning ensemble classifiers for diabetic retinopathy assessment,” Artif. Intell. Med., vol. 85, pp. 50–63, Apr. 2018.
[10] “APTOS 2019 Blindness Detection,” 2019. [Online]. Available: https://www.kaggle.com/c/aptos2019-blindness-detection/. [Accessed: 10-Jun-2019].
[11] F. Banterle, A. Artusi, K. Debattista, and A. Chalmers, Advanced high dynamic range imaging. 2017.
[12] P. Geurts, D. Ernst, and L. Wehenkel, “Extremely randomized trees,” Mach. Learn., vol. 63, no. 1, pp. 3–42, Apr. 2006.
[13] L. Buşoniu, R. Babuška, B. De Schutter, and D. Ernst, Reinforcement learning and dynamic programming using function approximators. CRC Press,
2010.
[14] A. Criminisi and J. Shotton, Decision Forests for Computer Vision and Medical Image Analysis. Springer, 2013.
[15] M. Ben Fraj, “In Depth: Parameter tuning for Random Forest,” 2017. [Online]. Available: https://medium.com/all-things-ai/in-depth- parameter-
tuning-for-random-forest-d67bb7e920d. [Accessed: 01-Aug-2019].
[16] A.-A. Nahid and Y. Kong, “Histopathological Breast-Image Classification Using Concatenated R–G–B Histogram Information,” Ann. Data Sci., vol. 6,
no. 3, pp. 513–529, 2019.
[17] N. Sikder, M. S. Chowdhury, A. M. Shamim Arif, and A.-A. Nahid, “Human Activity Recognition Using Multichannel Convolutional Neural Network,”
2019 5th Int. Conf. Adv. Electr. Eng., in press.
[18] G. Hackeling, Mastering Machine Learning with scikit-learn. Packt Publishing, 2014.
Dec 20, 2019
Thank You
Any Questions?

A presentation on "Early Blindness Detection Based on Retinal Images Using Ensemble Learning"

  • 1.
    Early Blindness DetectionBased on Retinal Images Using Ensemble Learning [Conference Presentation] Contributing Authors Niloy Sikder M.Sc. Student CSE Discipline Khulna University, Khulna niloysikder333@gmail.com Md. Sanaullah Chowdhury B.Sc. Student ECE Discipline Khulna University, Khulna sanaullahashfat@gmail.com Dr. Abdullah Al Nahid Associate Professor ECE Discipline Khulna University, Khulna nahid.ece.ku@gmail.com Abu Shamim Mohammad Arif Professor CSE Discipline Khulna University, Khulna shamimarif@yahoo.com Presenter Md. Sanaullah Chowdhury
  • 2.
    Dec 20, 20191 Diabetic Retinopathy (DR) Fig. 1: Blood vessels surrounding a normal retina, and a retina with DR[1]  A medical condition where the retina is affected by Diabetes.  Diabetes vandalizes the blood vessels within the retinal tissue, causes them to leak blood, fluids, and lipids inside the macula; and blocks them completely.  It may also caused by the formation on new (uncontrolled) blood vessels on the retina.  Because of these disruptions, light can not be projected properly on the retinal surface to create the sense of vision.  Symptoms may not be apparent at the early stages making it hard to diagnose early.  DR can cause permanent vision loss.
  • 3.
    Dec 20, 20192 DR Effects Fig. 2: (a) Normal vision, (b, c, d) vision of a person with DR[2]  A person with DR may experience blurred vision, floaters, blank areas or glare because of the retinal damage. (b) (a) (d) (c)
  • 4.
    3 Prevalence of Diabetesand DR  In 2015, 415 million people (worldwide) had some level of diabetes; and the number will rise to an overwhelming 552 million by 2030.  A 2013 study shows that in Bangladesh, the prevalence rate of retinal damage among diabetic patients was 21.6%.  In USA, 4.2 million adults has DR and 655,000 had vision-threatening DR.  Male gender, higher A1c level, longer duration of diabetes, insulin use, and higher systolic blood pressure are associated with the presence of DR. Dec 20, 2019
  • 5.
    4 Prevalence of Diabetesand DR (cont.) Fig. 3: Diabetes statistics Fig. 4: DR statistics Dec 20, 2019
  • 6.
    5 DR Diagnosis Fig. 5:(a) A Fundus Photography machine, and image of a retinal with (b) no DR, (c) prolific DR  Checking the eyes regularly is the only way to diagnose DR early.  The most common method of diagnosis is based on analyzing the retinal images collected using Fundus Photography. (a) (b) (c) Dec 20, 2019
  • 7.
    Dec 18, 20196 Why Use Machine Learning (ML) in the Diagnosis of DR?  To ensure rapid/ periodic eye examination.  To provide an easy way to check the health of the eyes so that people do not hesitate to check every once in a while.  Especially helpful to the people of poor economy.  To save time and money.  To lower the rate of vision loss due to prolific DR.
  • 8.
    Dec 20, 2019 7 DRDataset Fig. 6: DR classes in the employed dataset  In this study, the retinal images of the Asia Pacific Tele-Ophthalmology Society 2019 Blindness Detection (APTOS 2019 BD) dataset were used.  The dataset contains 3,662 retinal images collected from numerous subjects living in the rural areas of India.  The images were put together by Aravind Eye Hospital, India, with the purpose of building an ML model to detect blindness without medical screening.  Based on the severity, the images are categorized as – no DR, mild DR, moderate DR, severe DR, and proliferative DR.
  • 9.
    Dec 20, 20198 Proposed Methodology Fig. 7: Proposed methodology for retinal image classification. Image Preparation Image Preprocessing Retinal Image Collection Image Crop Image Resize Tone Mapping Image Histogram Noisy Image Exclusion Operational Dataset Preparation Train-Test Split (70 – 30) Training Data Training Labels Test Data Classification Model ET Hypertuning Predicted Labels Image Classification Image Augmentation (Class Specific) Removing Black Corners Image Classification Feature Extraction
  • 10.
    Dec 20, 20199 Exclusion of Noisy Images Fig. 8: A few of the images excluded from the study  602 images were excluded form the study since they were out of focus, overexposed, underexposed, or containing artifacts.
  • 11.
    Dec 20, 201910 Image Crop Operation Fig. 9: (a) A sample image where the retinal has been captured entirely, (b) the targeted portion of (a), (c) a sample image where the retinal has been captured partially, and (d) the targeted portion of (c).  Images of the APTOS 2019 BD dataset were not captured in the same condition using the same equipment.  The resultant images contain portions of the retina in different alignments.  For blindness detection, the features of the reddish retina are required, not the black border around it.
  • 12.
    Dec 20, 201911 Tone Mapping Images Fig. 10: (a) A sample retinal image, (b) its tone-mapped view, and (c) areas that do not contain necessary information  Tone mapping a digital image processing technique to convert a High Dynamic Range (HDR) image to a Low Dynamic Range (LDR) image.  Tone mapping is done by compressing the dynamic range of the HDR image while preserving the details of the image.  The common forms are linear scaling, logarithmic mapping, and exponential mapping. Fig. 11: Histogram of 10 (c)
  • 13.
  • 14.
    Scopes for FutureStudies  Include the Omitted images and extract features from them  Devise a plan to deal with the noisy labels  Hyper-tune the model to provide better classification performance  Work on to develop a new model that will provide better performance  Include various feature engineering techniques for feature reduction Dec 20, 2019 13
  • 15.
    14 References [1] F. Bandello,M. A. Zarbin, R. Lattanzio, and I. Zucchiatti, Clinical Strategies in the Management of Diabetic Retinopathy. Springer-Verlag Berlin Heidelberg, 2014. [2] B. Lumbroso, M. Rispoli, and M. C. Savastano, Diabetic Retinopathy. Jaypee Brothers Medical Publisher, 2015. [3] J. Chua, C. X. Y. Lim, T. Y. Wong, and C. Sabanayagam, “Diabetic retinopathy in the Asia-pacific,” Asia-Pacific Journal of Ophthalmology, vol. 7, no. 1. pp. 3–16, 01-Jan-2018. [4] A. Akhter, K. Fatema, S. F. Ahmed, A. Afroz, L. Ali, and A. Hussain, “Prevalence and associated risk indicators of retinopathy in a rural Bangladeshi population with and without diabetes.,” Ophthalmic Epidemiol., vol. 20, no. 4, pp. 220–7, Aug. 2013. [5] M. S. Chowdhury, F. R. Taimy, N. Sikder, and A.-A. Nahid, “Diabetic Retinopathy Classification with a Light Convolutional Neural Network,” in 2019 International Conference on Computer, Communication, Chemical, Materials and Electronic Engineering ( IC4ME2), in press. [6] M. U. Akram, S. Khalid, and S. A. Khan, “Identification and classification of microaneurysms for early detection of diabetic retinopathy,” Pattern Recognit., vol. 46, no. 1, pp. 107–116, Jan. 2013. [7] B. Antal and A. Hajdu, “An ensemble-based system for automatic screening of diabetic retinopathy,” Knowledge-Based Syst., vol. 60, pp. 20–27, 2014. [8] S. Wang, Y. Yin, G. Cao, B. Wei, Y. Zheng, and G. Yang, “Hierarchical retinal blood vessel segmentation based on feature and ensemble learning,” Neurocomputing, vol. 149, no. PB, pp. 708–717, Feb. 2015. [9] E. Saleh et al., “Learning ensemble classifiers for diabetic retinopathy assessment,” Artif. Intell. Med., vol. 85, pp. 50–63, Apr. 2018. [10] “APTOS 2019 Blindness Detection,” 2019. [Online]. Available: https://www.kaggle.com/c/aptos2019-blindness-detection/. [Accessed: 10-Jun-2019]. [11] F. Banterle, A. Artusi, K. Debattista, and A. Chalmers, Advanced high dynamic range imaging. 2017. [12] P. Geurts, D. Ernst, and L. Wehenkel, “Extremely randomized trees,” Mach. Learn., vol. 63, no. 1, pp. 3–42, Apr. 2006. [13] L. Buşoniu, R. Babuška, B. De Schutter, and D. Ernst, Reinforcement learning and dynamic programming using function approximators. CRC Press, 2010. [14] A. Criminisi and J. Shotton, Decision Forests for Computer Vision and Medical Image Analysis. Springer, 2013. [15] M. Ben Fraj, “In Depth: Parameter tuning for Random Forest,” 2017. [Online]. Available: https://medium.com/all-things-ai/in-depth- parameter- tuning-for-random-forest-d67bb7e920d. [Accessed: 01-Aug-2019]. [16] A.-A. Nahid and Y. Kong, “Histopathological Breast-Image Classification Using Concatenated R–G–B Histogram Information,” Ann. Data Sci., vol. 6, no. 3, pp. 513–529, 2019. [17] N. Sikder, M. S. Chowdhury, A. M. Shamim Arif, and A.-A. Nahid, “Human Activity Recognition Using Multichannel Convolutional Neural Network,” 2019 5th Int. Conf. Adv. Electr. Eng., in press. [18] G. Hackeling, Mastering Machine Learning with scikit-learn. Packt Publishing, 2014. Dec 20, 2019
  • 16.