Patel: Classification andidentification of diabetic retinopathy from fundus images based on deep convolutional networks
AJCSE/Jul-Sep-2025/Vol 10/Issue 3 2
as the optic disc, macula, and blood vessels that
are greatly affected by diabetes. As commonly
known, fundus is traditionally considered to be
useful in the diagnosis of DR, but recent research
studies indicate that in cases where there are no
apparent signs of DR, fundus images still evince
microscopic alterations in the microvasculature,
which suggest an early occurrence of
diabetes.[6,7]
Due to the era of AI, scientists have
created machine learning (ML) model types that
can analyze such pictures and identify not only DR
but diabetes itself at a very early stage. Diagnostic
performance AI models based on fundus images
have been demonstrated in several studies to reach
high area under the receiver operating curves,
with values greater than. The models provide an
affordable, fast, and scalable method of screening,
especially in underserved regions where there is
little specialized care available.[8]
Further, using
fundus-based AI systems, the diabetes type can be
distinguished in terms of the duration, with better
results being observed where vascular changes are
more severe than less. It renders fundus imaging an
irreproachable instrument in early diagnosis and
monitoring of diabetes, which may revolutionize
the process of prevention and mitigate the long-
term conditions such as blindness and organ
failure.
In the recent past, computers have been able
to learn about large data sets in a manner that
surpasses or surpasses human capabilities in most
fields, owing to deep learning (DL) algorithms.
A number of algorithms which are highly
specific and sensitive in classifying or detecting
the existence of some disease conditions by
way of classifying medical images like retinal
images, exist.[9,10]
The current state of DL-based
DR screening algorithms is mostly focused on
finding individuals with referable or vision-
threatening DR. The goal is for these algorithms
to send patients to ophthalmologists for further
evaluation or follow-up. The importance of
finding early-stage DR should not be overlooked,
though. Diabetes can be put off or even reversed
if glucose, blood pressure, and lipid profiles are
well-controlled early on. All participants in this
study, whether they had diabetes or not, had
normal retinal fundus pictures and showed no
signs of diabetic eye disease. Ultimately, the study
aimed to develop an AI system capable of early
detection of DR in retinal fundus images. Not only
that, but also the research distinguished between
various disease durations.
Motivation and Contribution of Study
DRisoneofthemaincausesofavoidableblindness
around the world, so this study was motivated by
the urgent need to find it quickly and correctly.
People with diabetes are at a 1/3 chance of getting
DR, so finding it early is very important to avoid
permanent vision loss. However, screening by
hand takes a long time, costs a lot of money, and
can be different from one doctor to the next. The
use of fundus imaging being non-invasive and
widely accessible combined with the power of
AI and DL enables automated systems to detect
minute retinal abnormalities at early stages. This
study is driven by the goal of creating a scalable,
consistent, and accurate diagnostic framework for
DR detection using deep convolutional networks.
The main key contributions are as follows:
• Utilized the APTOS dataset, a large publicly
available fundus image dataset, to train and
validate the DR detection framework.
• Applied robust preprocessing techniques
including min–max normalization and image
resizing to standardize input dimensions,
along with data augmentation to increase
sample diversity and mitigate overfitting.
• ML model trained and released utilizing
ResNet50 architecture for automatic multi-
class classification across five DR severity
levels.
• Validated the model’s diagnostic reliability
and clinical application by evaluating its
performance using comprehensive criteria
such as accuracy, precision, recall, and
F1-score.
Justification and Novelty
The novelty of this study lies in its focus on the
early detection of diabetes and DR from fundus
images, even in patients who do not exhibit visible
signsofDR.Contrarytoseveralcurrentmodelsthat
simply focus only at detecting severe-to-moderate
levels or simply classify the DR as either present or
absent, the paper outlines an efficient multi-stage
classification scheme that is able to determine
each of the five levels of DR severity with the
help of a DL model comprising ResNet50. The
3.
Patel: Classification andidentification of diabetic retinopathy from fundus images based on deep convolutional networks
AJCSE/Jul-Sep-2025/Vol 10/Issue 3 3
implementation of a complex preprocessing chain
(including scaling, normalization, augmentation,
and class imbalance correction to promote model
robustness and superior generalization) further
bolsters the claim of its originality. The model
also outperforms more conventional models such
as Dense Net and Mobile Net in terms of accuracy,
precision, recall, and F1-score. This positions the
proposed system as not only highly accurate but
also clinically relevant for scalable, early-stage
screening. The study’s ability to detect subtle
retinal changes prior to the appearance of clinical
symptoms highlights its potential to transform
preventive care strategies and reduce the long-
term burden of diabetes-related visual impairment,
particularly in resource-limited settings.
Structure of Paper
The outline of this paper is as follows: Section
II lists some of the most popular DL approaches
to DR detection currently available. Section III
explains the solution, as well as the preprocessing
and the ResNet50 model. The results and analysis
of the experiments are given in Section IV.
Following a brief overview of the results, Section
V offers suggestions for further studies.
LITERATURE REVIEW
This section presents research on DR detection
of fundus image systems that utilize diverse
ML techniques; the summary of these studies is
provided in Table 1.
Basheer et al. (2025) reported that DR is one
of the common eye illnesses and needs timely
detection with a chosen imaging modality. Retinal
optical coherence tomography (OCT)-based
analysis is one of the clinical practices and this
work developed a DL scheme for detecting the
DR in OCT data. Data preparation (including
resizing and collecting), feature extraction (using
classification results to identify the best model),
feature reduction (using 50% dropout and serial
concatenation to obtain the fused-features-vector),
classification, and three-fold cross validation are
the various steps involved in this work. This work
considered 2000 OCT images of normal/DR class
for the examination and the k-nearest neighbors
model-based scheme helped to get a detection
accuracy of 98%. This confirms that the proposed
DL-model based on ResNet variants works well
on this database.[11]
Vikraman and Sumathi proposed the DRC-
PCS-Artificial Neural Network (ANN), a novel
Table 1: Comparative analysis of DL techniques for diabetic retinopathy detection
Author Methodology Data set Key findings Limitation Future work
Basheer et al.
(2025)
ResNet variant+
50% dropout+ serial
concatenation+ KNN
OCT images (2000
samples)
Achieved
98% accuracy
with three‑fold
cross‑validation
Limited to binary
classification (Normal/DR)
Extend to multi‑class
DR classification and
larger datasets
Vikraman and
Sumathi (2025)
DRC‑PCS‑ANN
(Pyramidal Conv+ Shuffle
Attention)+DAGAF
preprocessing+ statistical
features+ PCS‑ANN
MESSIDOR Outperformed
existing models by up
to 23% in accuracy
and precision
Computationally complex;
lacks real‑time validation
Explore lightweight
deployment and
real‑world integration
Ahmed et al.
(2024)
ResNet‑18 (DL model) Kaggle DR dataset 99.91% training
accuracy; 96.65% test
accuracy
May suffer from overfitting
due to high training
accuracy
Test on unseen data or
cross‑dataset validation
Jenefa and
Subburam (2024)
EfficientNetB3+ transfer
learning
Kaggle (2750
images, 5 severity
levels)
98.55% training,
76.36% test accuracy
Large drop between training
and testing accuracy
(generalization gap)
Enhance generalization
and apply to real clinical
data
Pranay et al.
(2023)
Modified DenseNet‑121+
advanced preprocessing
Large DR fundus
dataset
Achieved 97%
accuracy, classified
DR into 5 stages
Lacks details on dataset
size/split and validation
strategy
Improve interpretability
and clinical applicability
Pavithra et al.
(2022)
Optic Net versus
DenseNet on OCT data
Standard OCT
dataset
Optic Net achieved
98% accuracy, 100%
specificity
Focused only on DME
(diabetic macular edema),
not full DR spectrum
Expand to DR staging
and multi‑modal inputs
Srinivasan and
Rajagopal (2021)
Review of DL‑based DR
detection using CNNs
Various datasets
(review paper)
DL offers superior
feature extraction
and accuracy over
traditional methods
No experimental
implementation; only
literature review
Implement and compare
reviewed methods on
standard benchmarks
DL: Deep learning, DR: Diabetic retinopathy, CNNs: Convolutional neural networks, DME: Diabetic macular edema, OCT: Optical coherence tomography, KNN: k‑nearest
neighbor, DAGAF: Data‑Adaptive Gaussian Average Filtering
4.
Patel: Classification andidentification of diabetic retinopathy from fundus images based on deep convolutional networks
AJCSE/Jul-Sep-2025/Vol 10/Issue 3 4
architecture based on pyramidal convolution and
shuffle attention, for effective diabetic retinopathy
(DR) classification. The process begins with
acquiring input images from the MESSIDOR
database. For preprocessing, Data-Adaptive
Gaussian Average Filtering is applied to remove
noise and enhance image quality. Subsequently,
the one-dimensional quantum integer wavelet
S-transform is used to extract statistical features
such as mean, kurtosis, variance, and entropy.
Based on these initial features, the five DR
categories—No DR, Mild DR, Moderate DR,
Severe DR, and Proliferative DR (PDR)—are
classified, followed by the application of the
PCS-ANN model. The performance of DRC-
PCS-ANN is evaluated using metrics such as F1-
score, precision, and accuracy. When compared
to other DR classification models, including
DRC-MCNN-MLC, ADRPCS-DL, and ADR-
AFT-Convolutional Neural Network (CNN), the
DRC-PCS-ANN model demonstrates superior
performance, achieving increases in accuracy of
21.28%, 21.52%, and 20.34%, and in precision of
23.29%, 23.83%, and 21.72%, respectively.[12]
Ahmed et al. observed that DR is detected in
this work using a ResNet-18 DL model. The
dataset used in this study is divided into two
sections: training and testing. It was collected
through Kaggle with ResNet-18, able to achieve
96.65% testing accuracy and 99.91% training
accuracy. The results show that DL models, such
as as ResNet-18, can effectively detect DR early
on, which could completely change the way
screenings are done in clinical settings. Reducing
the overall risk of blindness among diabetes cases,
this proposed model can significantly expand
the breadth of early intervention and treatment
measures by simply streamlining the diagnostic
side of the treatment process. Patient outcomes
and healthcare resource allocation could both be
enhanced by implementing such technology.[13]
Jenefa and Subburam explain in depth how to use
Kaggle retinal scans to categorize the severity
of DR. The timeliness of the above response is
explained by the urgency of DR detection and
treatment measures. It should be noted that a
specifically arranged data set was created in the
described work, including 2750 pictures in with 5
groupsofseverity.Themaximumtrainingaccuracy
of 98.55% was reached using EfficientNetB3 with
transfer learning, and the validation and testing
accuracies constituted 71.27% and 76.36%,
respectively.[14]
Pranay et al. use DL to analyze various DR stages
and develop a unique methodology for detecting
DR. Model improves DR detection accuracy using
a modified pre-trained DenseNet-121 architecture
and better pre-processing algorithms. Once the
model has been trained on a large dataset, it may be
able to automatically identify the DR stage. From
0 to 4, the DR phases are grouped into five distinct
groups. According to this research, the patient’s
fundus ocular photos served as the model’s input
parameters. With a 97% accuracy rate, the model
surpassed the state-of-the-art models that were
discussed.[15]
Pavithra et al. (2022) observed that two DL
models, Optic Net, and Dense Net, were evaluated
and researched for diabetic macular edema (DME)
classification using a standard OCT dataset.
Comparing the two models’ performance is done
by statistically analyzing the accuracy measures
collected during the tests. As per the data, the
most suitable system for determining DME
might be the model Optic Net (Accuracy – 98%,
Specificity – 100%), which outperforms Dense
Net (Accuracy – 94%, Specificity – 96%).[16]
Srinivasan and Rajagopal (2021) reported that a
prevalentlong-termconditionaffectingindividuals
of all ages, characterized by inadequate insulin
synthesis and the resulting elevation of blood sugar
levels. Many other health problems might manifest
throughout the body as a result of untreated
diabetes. The asymptomatic deterioration of the
retinal vessels caused by diabetes is known as DR.
Conventional handcrafted traits have been utilized
in numerous automated diagnostic systems that
have been created in the literature. Since DL
automates feature extraction, it has the ability
to generate more precise and promising results,
which is especially useful in medical imaging.
One of the most common ways to employ DL
in medical image analysis is with CNN. To gain
a better understanding, this work analyses and
reviews various DL-based DR disease detection
and classification algorithms.[17]
Despite significant advancements in DR detection
using DL, several research gaps remain. Many
existing models, such as those using ResNet,
Dense Net, or Efficient Net variants, achieve high
training accuracy but often exhibit a notable drop
in validation or testing performance, indicating
5.
Patel: Classification andidentification of diabetic retinopathy from fundus images based on deep convolutional networks
AJCSE/Jul-Sep-2025/Vol 10/Issue 3 5
potential overfitting and limited generalization.
In addition, some approaches focus only on
binary classification (e.g., normal vs. DR) rather
than the clinically relevant multi-stage DR
classification. It is also challenging to compare
model performance accurately due to the absence
of standardized datasets and similar evaluation
methodologies across research. Furthermore,
real-time applicability, computer efficiency,
and interpretability are all essential to clinical
application, but few models take them into
consideration. These differences drive a much
stronger and more explainable representation
that scales to deliver across a wide variety of data
ranges and real-life conditions.
METHODOLOGY
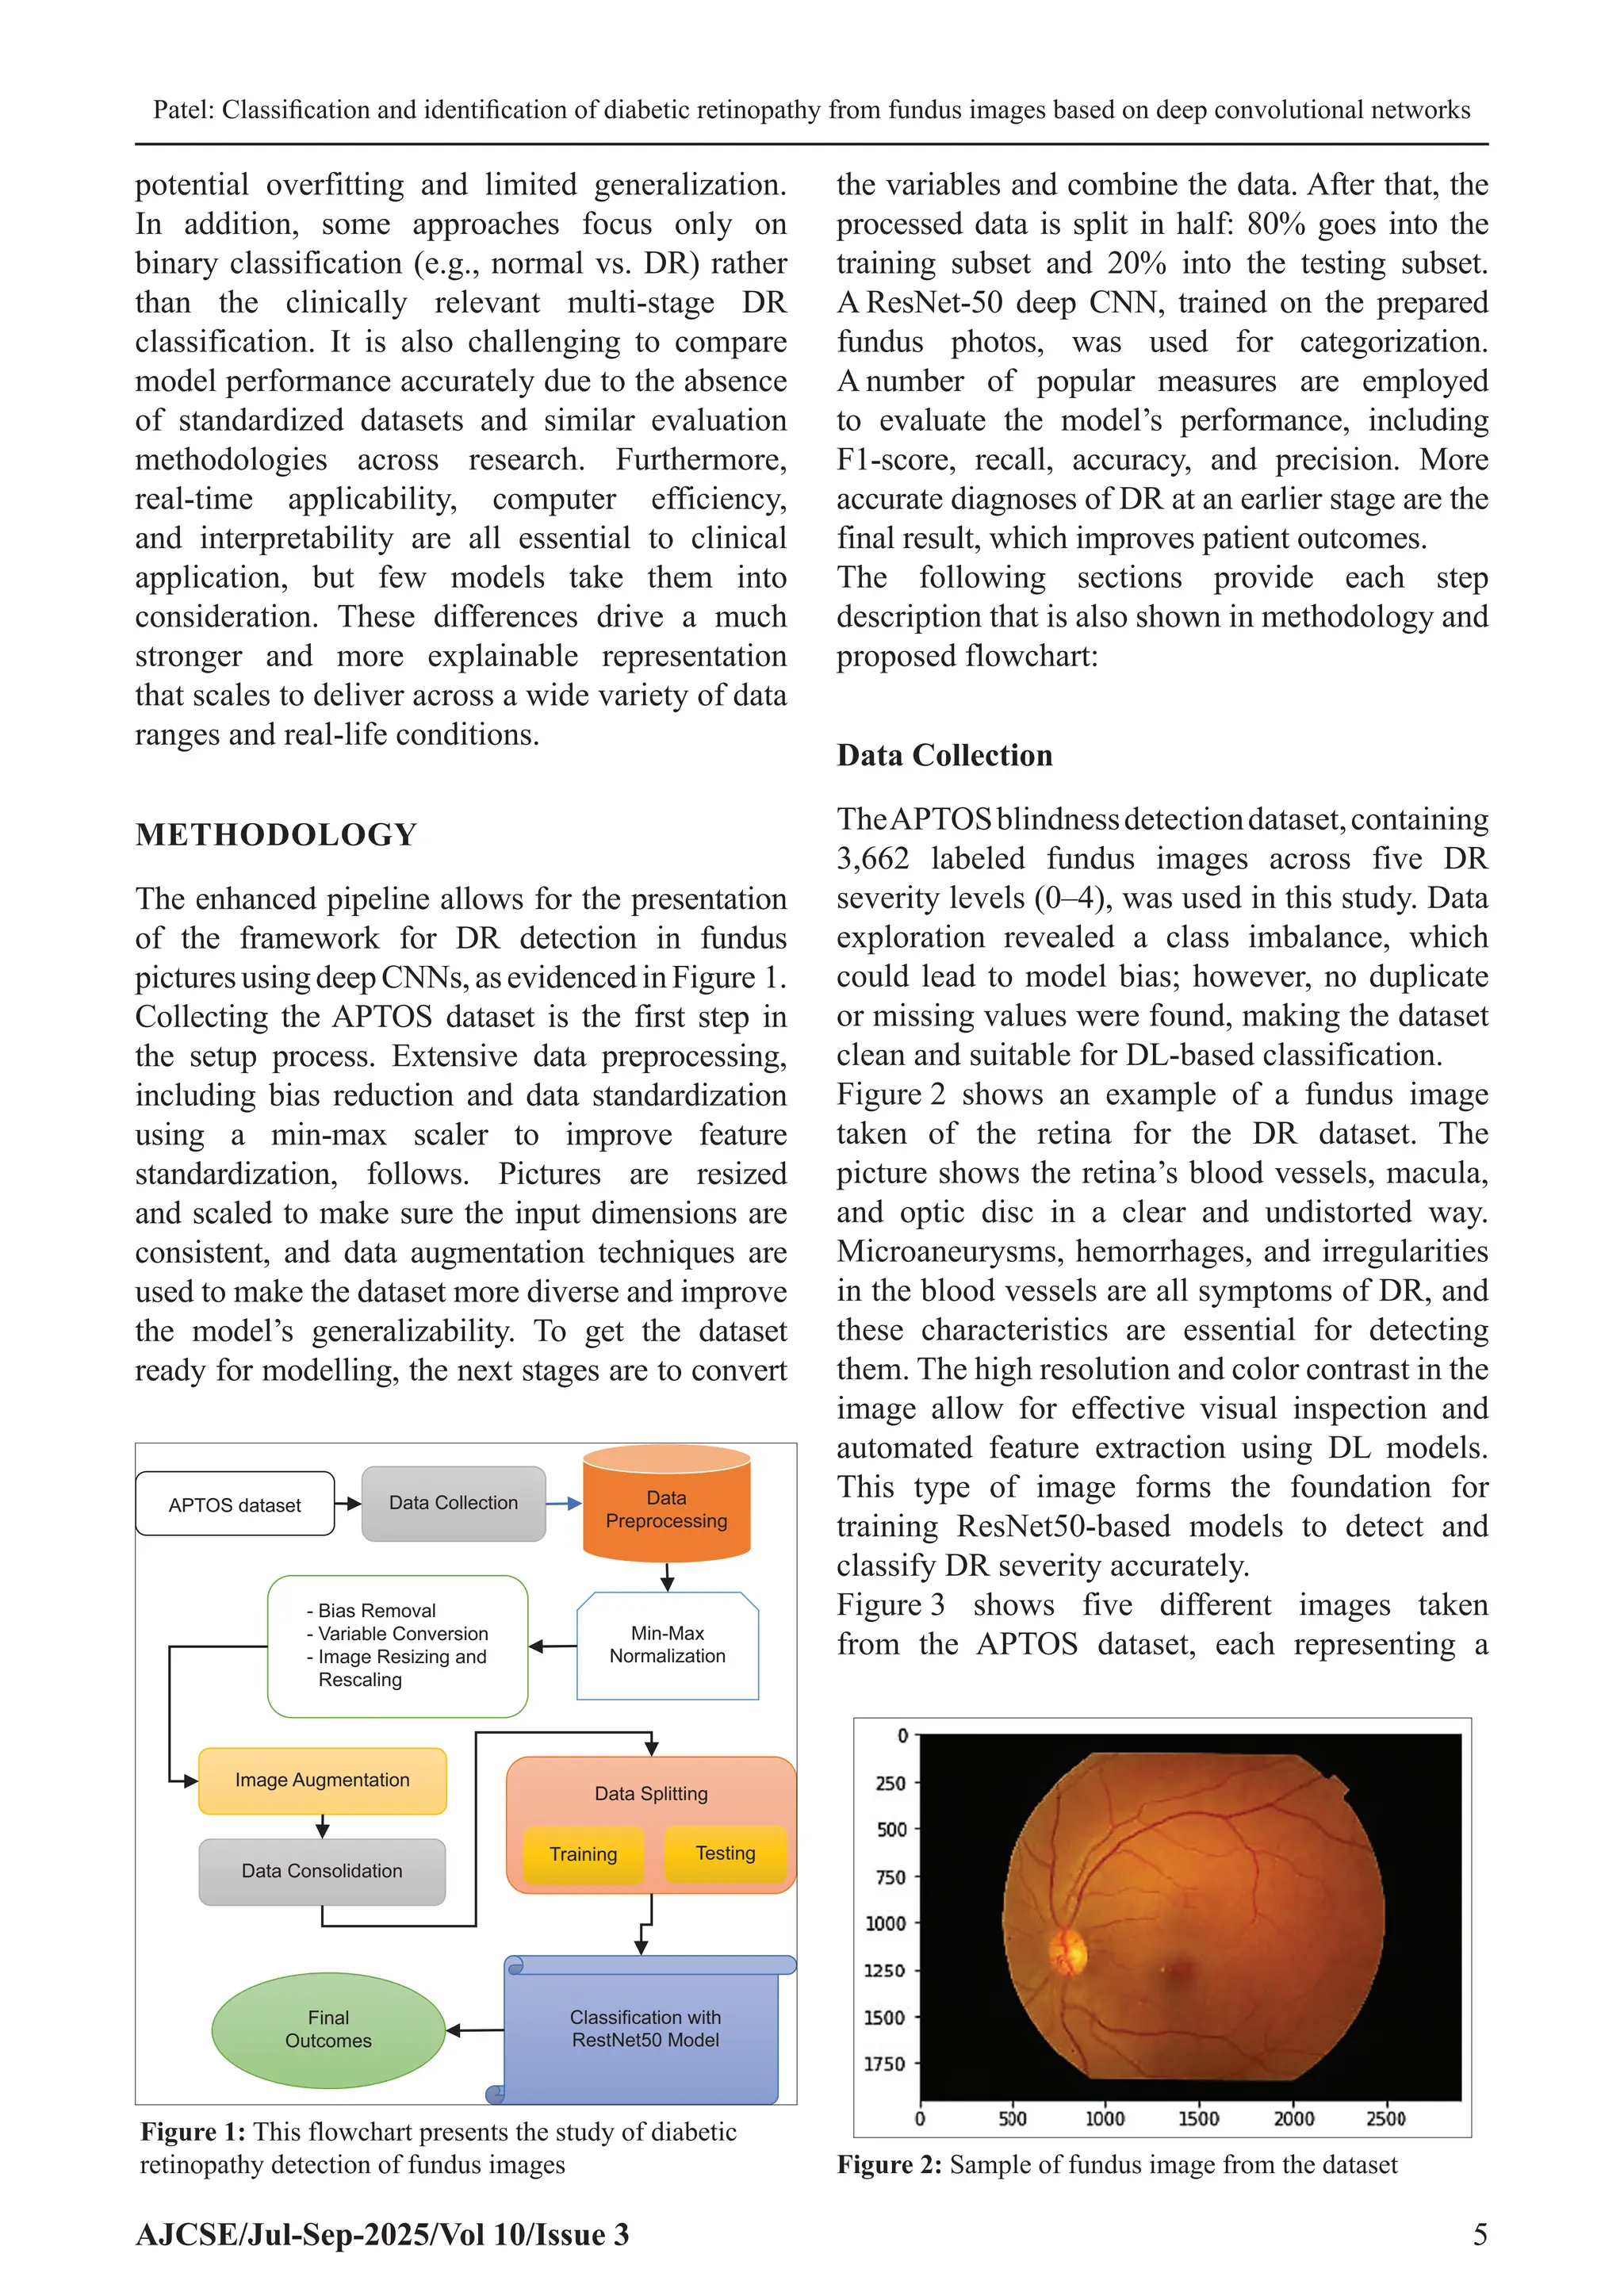
The enhanced pipeline allows for the presentation
of the framework for DR detection in fundus
picturesusingdeepCNNs,asevidencedinFigure 1.
Collecting the APTOS dataset is the first step in
the setup process. Extensive data preprocessing,
including bias reduction and data standardization
using a min-max scaler to improve feature
standardization, follows. Pictures are resized
and scaled to make sure the input dimensions are
consistent, and data augmentation techniques are
used to make the dataset more diverse and improve
the model’s generalizability. To get the dataset
ready for modelling, the next stages are to convert
the variables and combine the data. After that, the
processed data is split in half: 80% goes into the
training subset and 20% into the testing subset.
A ResNet-50 deep CNN, trained on the prepared
fundus photos, was used for categorization.
A number of popular measures are employed
to evaluate the model’s performance, including
F1-score, recall, accuracy, and precision. More
accurate diagnoses of DR at an earlier stage are the
final result, which improves patient outcomes.
The following sections provide each step
description that is also shown in methodology and
proposed flowchart:
Data Collection
TheAPTOSblindnessdetectiondataset,containing
3,662 labeled fundus images across five DR
severity levels (0–4), was used in this study. Data
exploration revealed a class imbalance, which
could lead to model bias; however, no duplicate
or missing values were found, making the dataset
clean and suitable for DL-based classification.
Figure 2 shows an example of a fundus image
taken of the retina for the DR dataset. The
picture shows the retina’s blood vessels, macula,
and optic disc in a clear and undistorted way.
Microaneurysms, hemorrhages, and irregularities
in the blood vessels are all symptoms of DR, and
these characteristics are essential for detecting
them. The high resolution and color contrast in the
image allow for effective visual inspection and
automated feature extraction using DL models.
This type of image forms the foundation for
training ResNet50-based models to detect and
classify DR severity accurately.
Figure 3 shows five different images taken
from the APTOS dataset, each representing a
Figure 2: Sample of fundus image from the dataset
APTOS dataset Data Collection Data
Preprocessing
- Bias Removal
- Variable Conversion
- Image Resizing and
Rescaling
Min-Max
Normalization
Image Augmentation
Data Consolidation
Data Splitting
Training Testing
Classification with
RestNet50 Model
Final
Outcomes
Figure 1: This flowchart presents the study of diabetic
retinopathy detection of fundus images
6.
Patel: Classification andidentification of diabetic retinopathy from fundus images based on deep convolutional networks
AJCSE/Jul-Sep-2025/Vol 10/Issue 3 6
distinct stage of DR. Each image is labeled to
indicate the severity of the condition: (0) No DR
shows a healthy retina, serving as a baseline. As
the condition progresses, visible signs of DR
become more apparent. (1) Mild DR exhibits
early, subtle changes. (2) Moderate DR indicates
a more pronounced progression of the disease.
(3) Extensive retinal damage is a hallmark of
severe DR, and (4) New aberrant blood vessels
appear in the final stage of DR, known as PDR.
DR is often graded according to the severity of
the condition using fundus photos, as seen in this
graphical progression.
Figure 4 presents the visual impact of data pre-
processing on fundus images, showcasing the
transformation from raw input to an enhanced
version for analysis. The top row, labeled
(a) Image 1, (b) Image 2, and (c) Image 3,
displays the original fundus images. These
images represent typical ophthalmic scans with
their inherent color, brightness, and contrast
variations. The bottom row, corresponding to
the same images after pre-processing, reveals
a significant change: the images appear
desaturated, almost grayscale, with a more
pronounced emphasis on the retinal blood vessels
and the optic disc. This transformation, likely
achieved through techniques such as grayscale
conversion, contrast enhancement, or perhaps
a form of edge detection or vessel extraction,
aims to normalize the image data and highlight
critical anatomical features, making them more
suitable for automated analysis, such as in the
detection of medical conditions.
Data Pre-processing
This is the final stage before feeding the data into
the ResNet50 models. Before training models,
performed several data pre-processing tasks, so
that the dataset is well structured and consistent.
The tasks include normalization, image resizing,
rescaling, and image augmentation.All these tasks
were performed to ensure the robustness of the
models.
Data Normalization with Min-Max Scaler
Reducing the size of individual pixels to a
uniform range is known as normalization. The
original range of pixel values in the fundus photos
was [0-255]; however, in this case, they were
scaled to [0–1]. Equation (1) ensures that all input
features (pixel intensities) are on the same scale,
which aids the ResNet50 model’s convergence
and increases numerical stability during training.
Normalized pixel value =
−
−
x x
x x
min
max min
(1)
Where:
• X = original pixel value (usually between 0
and 255 for RGB images)
• xmin
= 0
• Xmax
= 255
Bias Removal
The dataset used in this research was found to be
imbalanced, with an unequal distribution of images
across the five DR classes. As a result of this
disparity, training the model may become biassed
in favor of the dominant group. Oversampling
minority classes and using class weights during
training were two methods used to solve this
Figure 3: Sample fundus images from APTOS dataset
Figure 4: Before and after data preprocessing
7.
Patel: Classification andidentification of diabetic retinopathy from fundus images based on deep convolutional networks
AJCSE/Jul-Sep-2025/Vol 10/Issue 3 7
problem. These strategies enable the model to
learn more fairly across all classes and enhance
its ability to accurately predict underrepresented
categories.
Variable Conversion
The train.csv file included two columns: id_code
and diagnosis, where diagnosis represented the
DR severity level as numerical values (0–4). Since
frameworks like Keras expect classification labels
to be in categorical (string) format for proper
handling during training, all diagnosis values
were converted from integers to strings. This
conversion ensures compatibility with categorical
loss functions and label encoding tools, enabling
accurate multi-class classification.
Image Resizing and Rescaling
The original fundus images in the dataset were
of varying dimensions and resolutions, which is
not suitable for training a ResNet50 that expects
uniform input shapes. Therefore, all images were
resized to (256, 256, 3), where 256 × 256 defines
the width and height, and 3 indicates the RGB
color channels. In addition, all pixel values were
normalized to a range between 0 and 1 to speed up
convergence during training and ensure numerical
stability in the network.
Image Augmentation
The dataset size and variability were artificially
increased through the use of picture augmentation
due to the small number of photos and the
preexisting class imbalance.[18]
Applying various
transformations to the training photographs using
Keres’s Image Data Generator, such as shear,
zoom, and horizontal flipping. This enhancement
helps with both lowering the model’s overfitting
threshold and improving its generalizability
through learning from different versions of the
same image.
Data Consolidation
Toefficientlyloadtheimage-labelpairsfortraining,
the data from the train.csv file was consolidated.
The id_code column, which identifies each image,
was appended with a.png extension to match the
actual filenames in the image directory. This step
ensured that every image could be correctly linked
to its corresponding diagnosis label, streamlining
the process of feeding data into the ResNet50
model.
Data Splitting
Training the model used 80% of the dataset
samples, whereas testing it used 20% of each
version’s dataset samples.
Classification with ResNet50 Model
The 50-layer CNN ResNet-50 learns residuals
instead of features. To solve the problem of the
disappearing/exploding gradient, this design
incorporates the Residual Network concept.
Consequently,insteadofonlytryingtoapproximate
the desired underlying mapping, H(x),[19]
really
learn a residual function H(x). To do this, build a
stack of layers such that their output, denoted as
y = F(x) + x, is obtained by adding each element
of the original input, x, to the output, F(x).
Hence, if still wish to discover the underlying
mapping y = H(x), then F(x) = H(x) − x, and
y = F(x) + x = H(x) − x + x = H(x) follows. Since
now easily learn y = x by setting all weights to 0,
the concept of learning identity mappings becomes
simpler. This is because H(x) = 0 and F(x) = −x.
After that, have the activation function, f, and the
result is H(x), as demonstrated in Equations (2)
and (3), respectively.
H(x) = f(wx
+ b)(2)
H(x) = f(x) + x(3)
Performance Matrix
A wide range of performance evaluation criteria
are employed in this study. Most of these solutions
depend on the confusion matrix that is developed
during the identification job testing procedure.[20,21]
The calculations for these procedures are as
follows:
𝐴𝑐𝑐𝑢𝑟𝑎𝑐𝑦 (𝐴𝑐), 𝑝𝑟𝑒𝑐𝑖𝑠𝑖𝑜𝑛 (𝑃𝑒), 𝑅𝑒𝑐𝑎𝑙𝑙 (𝑅𝑒) and
𝐹1 s𝑐𝑜𝑟𝑒 (𝐹1−𝑠).
The following defines these performance matrices:
8.
Patel: Classification andidentification of diabetic retinopathy from fundus images based on deep convolutional networks
AJCSE/Jul-Sep-2025/Vol 10/Issue 3 8
Accuracy (Ac)
This metric is specified in Equation (4) and it
is calculated by adding up all the positive and
negative results and dividing that total by the total
number of results:
Accuracy
TP TN
TP FP FN TN
=
+
+ + +
(4)
Precision (Pe)
As a ratio to the ground truth in Equation (5), this
metric measures the positive predictions (5):
Precision
TP
TP FP
=
+
(5)
Recall (Re)
Comparing the positive segmentation forecast
to the ground truth, this approach identifies
the pertinent region. Equation (6) shows the
percentage of positive cases correctly identified
by the approach, which is in line with the idea of
sensitivity:
Recall
TP
TP FN
=
+
(6)
F1_Score (F1−S)
The F1-score, which is determined by Equation
(7), is a measure of the function of recall and
precision:
F score
Precision recall)
Precision recall
1 2
− =
+
( )
*
( *
(7)
An FN value indicates that DR photos were
mistakenly classified as non-DR, while an
FP value indicates that non-DR images were
improperly classified as DR. These ideas are
linked to two types of images: True positive (TP)
and true negative (TN), which are classified as DR
images and non-DR images, respectively.
RESULTS AND DISCUSSION
The setup of the experiment and findings of the
suggested model’s performance matrices are
presented in this section. The suggested model
architecture is put into action on a graphics
processor unit (GPU) and a central processing unit
(CPU) usingTensorFlow Lite and two quantization
techniques, respectively. The GPU and CPU used
in this implementation are an NVIDIA GeForce
GTX 1650 and an Intel(R) Core (TM) i7-9750H
CPU running at 2.60 GHz, respectively. The
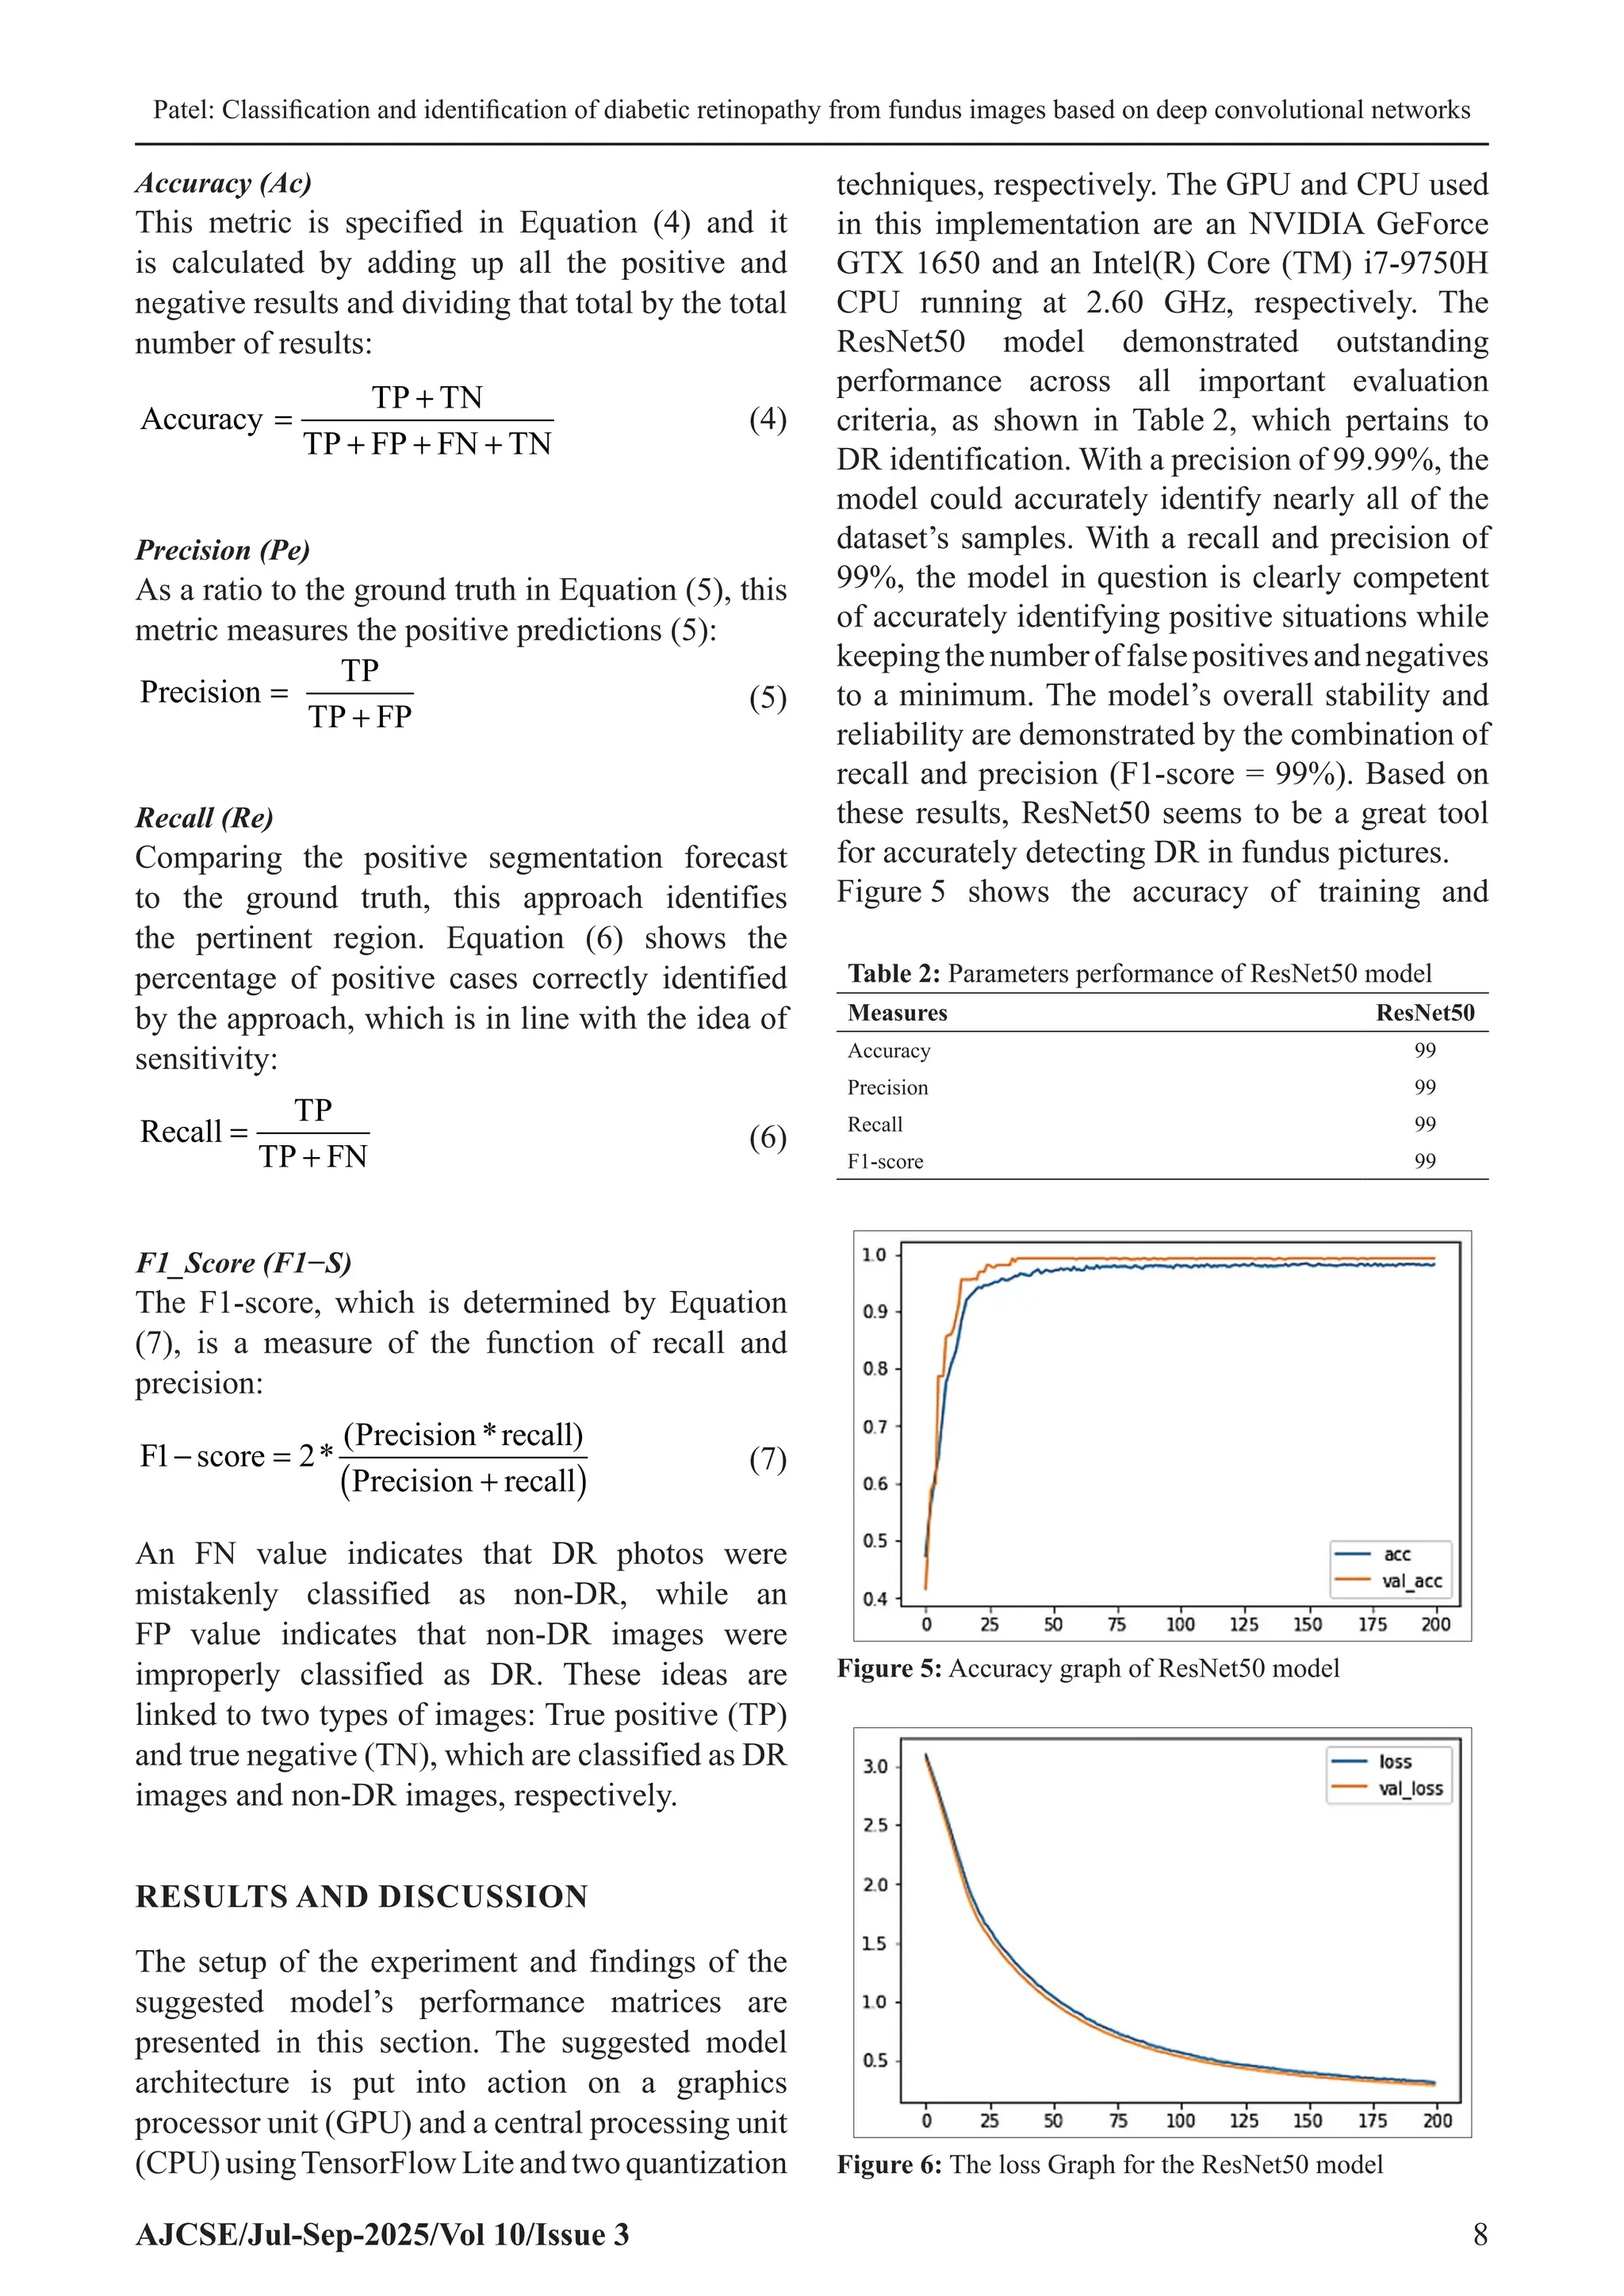
ResNet50 model demonstrated outstanding
performance across all important evaluation
criteria, as shown in Table 2, which pertains to
DR identification. With a precision of 99.99%, the
model could accurately identify nearly all of the
dataset’s samples. With a recall and precision of
99%, the model in question is clearly competent
of accurately identifying positive situations while
keepingthenumberoffalsepositivesandnegatives
to a minimum. The model’s overall stability and
reliability are demonstrated by the combination of
recall and precision (F1-score = 99%). Based on
these results, ResNet50 seems to be a great tool
for accurately detecting DR in fundus pictures.
Figure 5 shows the accuracy of training and
Table 2: Parameters performance of ResNet50 model
Measures ResNet50
Accuracy 99
Precision 99
Recall 99
F1‑score 99
Figure 5: Accuracy graph of ResNet50 model
Figure 6: The loss Graph for the ResNet50 model
9.
Patel: Classification andidentification of diabetic retinopathy from fundus images based on deep convolutional networks
AJCSE/Jul-Sep-2025/Vol 10/Issue 3 9
validation of model ResNet50 during 200 epochs.
The graph indicates that training (acc) and
validation (val_acc) accuracy is quickly rising in
the first 25 epochs of the model, and the validation
accuracy has already approached perfection levels
at an early stage. As the training improves, the two
curves will converge and stabilize at a rate of about
99–100% accuracy which implies good learning
and generalization. On the whole, the ResNet50
model turns out to be quite effective and robust
in terms of categorizing DR using fundus images.
The training and validation loss curves of the
ResNet50 model are shown in Figure 6 during
the 200 epochs training. The two loss curves
begin above 3.0 and take a steady and smooth
path towards the end of the training process
with the loss curves finally converging to form
values of 0.5. The fact that training loss (loss)
and validation loss (val_loss) are very similar
is an indication of the fact that the model is
learning efficiently and not overfitting. These
two curves maintain a smooth decline, indicating
a steady optimization procedure along with good
generalization abilities. The ResNet50 model is,
in general, effective in the learning process and
robust, which makes the process of determining
the DR an accurate process.
Figure 7 shows a confusion matrix of ResNet50
model,whichshowsexcellentclassificationresults.
In a sample size of 102 where all the samples
were used, the model did not misclassify any of
the samples; the model was right in 6 of the cases
of someone being healthy and a total of 96 cases
of DR when matched with the original results. It
did not include false positives and negative cases,
leading to a perfect classification. The result
proves that the ResNet50 model reached 100%
accuracy, precision, recall, and F1-score on this
dataset, which proves that it is extremely effective
at differentiating between the healthy and DR-
affected retina images without a single mistake.
Comparative analysis of different models
considered on theAPTOS dataset to classify retinal
diseases can be obtained with the help of Table 3.
Demonstrating better accuracy, the ResNet50
model is proved to be more efficient in finding
complex patterns in the dataset. Conversely,
models like Mobile Net, DenseNet-121, and
support vector machine (SVM) display relatively
lower levels of accuracy, which, in turn, underlines
the merit of more profound convolutional
architectures when analyzing medical images.
The findings indicate that the residual learning
structure of ResNet50 serves as a more confident
choice in terms of applying it in high precision
diagnosing tasks, especially in ophthalmology
https://truewriter.game/, since it encompasses
more features extractions skills.
The offered ResNet50 program demonstrates
excellent results on the APTOS set, being the most
accurate among the reviewed programs. Its long-
lasting account of learning models is proficient in
training very deep networks as it tends to relieve
the vanishing gradient issue, advancing feature
representation and categorization capacity. Such an
architecturalrobustnessenablesthemodeltoidentify
even pronounced patterns in the retinal images and
hence is one of the reasons why the model is best
suited where medical images are under analysis.
The accuracy of more than 92% is indicative of the
strength of the model, generalization capacity, and
its relevance in the implementation of automated
DR screening systems.
CONCLUSION AND FUTURE SCOPE
Patients with delayed diagnosis and treatment are
more prone to lose sight despite being DR patients.
Table 3: Comparison between models on APTOS dataset
Matrix ResNet50 Mobile
net[22]
DenseNet‑121[23]
SVM[24]
Accuracy 99 79.01 81.23 94.5
SVM: Support vector machine
Figure 7: Confusion matrix of ResNet50 model
10.
Patel: Classification andidentification of diabetic retinopathy from fundus images based on deep convolutional networks
AJCSE/Jul-Sep-2025/Vol 10/Issue 3 10
The severity of the disease should be identified
after the recognition of early warning signals, and
the treatment selection made dependent on the
best therapy. The proposition aims at using a DL
model to identify fundus pictures of DR according
to severities. The given paper introduces a
DL-based method of categorizing fundus DR
photographs. An eye condition known as DR, due
to high blood glucose, has increased in number.
More than half of the globe’s under-70s have
diabetes. Without timely diagnosing and treating,
DR patients inadvertently lose eyesight. The paper
has effectively modeled the success of a DL frame
ResNet50 in the DR type of the disease through
leveling it all the way to the severities based on the
fundus pictures. With a 99% accuracy, precision
score, recall score, and F1-score, the model looks
better than current methods, such as Mobile Net,
DenseNet-121, and SVM, which proves that it is a
robustmodel,withhighgeneralizationcapacityand
clinical chances. This performance was properly
attributed to a wide range of preprocessing, data
augmentation, and overcoming bias techniques.
Interestingly, the model also did not produce
overfitting since there was a lot of correlation in
training and validation results.
Each of these analyses is limited to the current
temporal dataset of diverse imaging conditions.
Larger datasets with an increased range of
samples and their populations may allow better
generalization of the models. In addition,
incorporating explainable AI techniques would
enhance clinical trust and interpretability. Real-
time deployment on lightweight platforms such as
mobile or edge devices could make DR screening
accessible in remote or resource-limited areas.
Finally, integrating multimodal data (e.g., OCT,
patient history) and testing across real clinical
environments will be vital for broader adoption
and impact.
REFERENCES
1. Shamsan A, Senan EM, Shatnawim HS. Predicting
of diabetic retinopathy development stages of fundus
images using deep learning based on combined features.
PLoS One 2023;18:e0289555.
2. Neeli SS. Heart disease prediction for a cloud-based
smart healthcare monitoring system using gans and
ant colony optimization. Int J Med Public Health
2024;14:1219-29.
3. Pahune S, Rewatkar N. Large language models and
generative AI’s expanding role in healthcare. Int J Res
Appl Sci Eng Technol 2024;11:2288-302.
4. Mahajan RP. Transfer learning for MRI image
reconstruction: Enhancing model performance with
pretrainednetworks.IntJSciResArch2025;15:298-309.
5. Dattangire R, Biradar D, Vaidya R, Joon A.
A comprehensive analysis of cholera disease prediction
using machine learning. In: Fifth Congress on Intelligent
Systems. Berlin: Springer; 2025. p. 555-68.
6. Rom Y, Aviv R, Cohen GY, Friedman YE, Ianchulev T,
Dvey-Aharon Z. Diabetes detection from non-diabetic
retinopathy fundus images using deep learning
methodology. Heliyon 2024;10:e36592.
7. Singamsetty S. Neurofusion: Advancing Alzheimer’s
diagnosis with deep learning and multimodal feature
integration. Int J Educ Appl Sci Res 2021;8:23-32.
8. Sagili SR, Goswami C, Bharathi VC,Ananthi S, Rani K,
Sathya R. Identification of Diabetic Retinopathy by
Transfer Learning Based Retinal Images. In:
2024 9th
International Conference on Communication
and Electronics Systems (ICCES). IEEE; 2024.
p. 1149-54.
9. Dai L, Wu L, Li H, Cai C, Wu Q, Kong H, et al. A deep
learning system for detecting diabetic retinopathy across
the disease spectrum. Nat Commun 2021;12:3242.
10. Mostafiz MA. Machine learning for early cancer
detection and classification: AI-based medical
imaging analysis in healthcare. Int J Curr Eng Technol
2025;15:251-60.
11. BasheerN,SenthilnayakiB,NarayananM,IllavarasonP.
Diabetic Retinopathy Detection in Retinal OCT Images
with Fused Resnet Features. In: 2025 International
Conference on Frontier Technologies and Solutions
(ICFTS). IEEE; 2025. p. 1-6.
12. Vikraman L, Sumathi R. Diabetic Retinopathy
Classification using Pyramidal Convolution Shuffle
Attention Neural Network. In: 2025 International
Conference on Computational Robotics, Testing and
EngineeringEvaluation(ICCRTEE).IEEE;2025.p. 1-5.
13. Ahmed F, Fatima A, Mamoon M, Khan S. Identification
of the Diabetic Retinopathy using Resnet-18. In:
2024 2nd
International Conference on Cyber Resilience
(ICCR). IEEE; 2024. p. 1-6.
14. Jenefa L, Subburam R. Improving Diagnosis and
Classification of Severity in Diabetic Retinopathy using
Transfer Learning. In: 2024 International Conference
on Integration of Emerging Technologies for the Digital
World (ICIETDW). IEEE; 2024. p. 1-5.
15. Pranay G, MisraO, Mishra S, Rathore SS,
Bhattacharya M. Detection Analysis of Diabetic
Retinopathy using Modified Densnet-121. In: 2023
IEEE International Conference on Computer Vision and
Machine Intelligence (CVMI). IEEE; 2023. p. 1-6.
16. Pavithra K, Kumar P, Geetha M, Bhandary S. Statistical
Analysis of Deep Learning Models for Diabetic Macular
Edema Classification using oct Images. In: 2022
International Conference on Distributed Computing,
VLSI, Electrical Circuits and Robotics (DISCOVER).
IEEE; 2022. p. 305-10.
17. Srinivasan V, Rajagopal V. A Survey on Diabetic
Retinopathy Disease Detection and Classification
11.
Patel: Classification andidentification of diabetic retinopathy from fundus images based on deep convolutional networks
AJCSE/Jul-Sep-2025/Vol 10/Issue 3 11
using Deep Learning Techniques. In: 2021 Seventh
International conference on Bio Signals, Images, and
Instrumentation (ICBSII). IEEE; 2021. p. 1-4.
18. Patel N. Quantum cryptography in healthcare
information systems: Enhancing security in medical
data storage and communication. J Emerg Technol
Innov Res 2022;9:193-202.
19. Jalaja PP, Kommineni D, Mishra A, Tumati R,
Joseph CA, Veer Samara Sihman Bharattej Rupavath R.
Predictors of mortality in acute myocardial infarction:
Insights from the healthcare cost and utilization project
(HCUP) nationwide readmission database. Cureus
2025;17:e83675.
20. Fayyaz AM, Sharif MI, Azam S, Karim A, El-Den J.
Analysis of diabetic retinopathy (DR) based on the deep
learning. Information 2023;14:30.
21. Sagili SR, Chidambaranathan S, Nallametti N,
Bodele HM, Raja L, Gayathri PG. NeuroPCA:
Enhancing Alzheimer’s Disorder Disease Detection
Through Optimized Feature Reduction and Machine
Learning. In: 2024 Third International Conference on
Electrical, Electronics, Information and Communication
Technologies (ICEEICT). IEEE; 2024. p. 1-9.
22. Kassani SH, Kassani PH, Khazaeinezhad R,
Wesolowski MJ, Schneider KA, Deters R. Diabetic
Retinopathy Classification using a Modified Xception
Architecture. In: 2019 IEEE International Symposium
on Signal Processing and Information Technology
(ISSPIT). IEEE; 2019. p. 1-6.
23. Alwakid G, Gouda W, Humayun M, Jhanjhi NZ.
Deep learning-enhanced diabetic retinopathy image
classification.DigitHealth2023;9:20552076231194942.
24. Alwakid G, Gouda W, Humayun M,
Jhanjhi NZ. Enhancing diabetic retinopathy
classification using deep learning. Digit Health
2023;9:20552076231203676.
![© 2025, AJCSE. All Rights Reserved 1
RESEARCH ARTICLE
Classification and Identification of Diabetic Retinopathy from Fundus Images
Based on Deep Convolutional Networks
Jvalantkumar Kanaiyalal Patel*
Department of Computer Science, Shri Manilal Kadakia College of Commerce, Management, Science and
Computer Studies, Ankleshwar, Gujarat, India
Received on: 09-07-2025; Revised on: 17-08-2025; Accepted on: 25-09-2025
ABSTRACT
A disease known as diabetic retinopathy (DR) can develop in people who have diabetes for an extended
period. Visual impairment can result from a postponed diagnosis. Diabetics are disproportionately likely
to get DR due to their chronically elevated blood sugar levels. The retina’s blood vessels are affected
by this. This study demonstrates the use of the ResNet50 architecture in a deep learning-based method
for the early detection and categorization of DR using images of the retinal fundus. This research takes
advantage of fundus photography, a non-invasive, high-resolution imaging technology, to detect retinal
alterations even when no outward signs of DR are present. Diabetes is on the rise around the world,
and if not caught early, DR can lead to permanent visual loss; thus, this is crucial. The work guarantees
strong training of the ResNet50 model by preprocessing images using normalization, augmentation,
and scaling, and by controlling for class imbalances. The APTOS dataset includes photos from all five
severity levels of DR. The model demonstrated outstanding results in terms of recall, accuracy, precision,
and F1-score during training, suggesting high reliability and promising clinical use. Aiming to improve
preventive diabetes treatment, particularly in places with limited resources, the research highlights the
usefulness of artificial intelligence in scalable, early-stage DR screening.
Key words: APTOS dataset, Deep learning, Diabetic retinopathy, Fundus images, ResNet50 model
INTRODUCTION
A condition known as diabetic retinopathy (DR)
occurswhenapersonwithdiabeteshasconsistently
high blood sugar levels over an extended period.
This condition affects the retina, a layer of the eye
that is photosensitive and responsible for vision.
Problems with the retina’s ability to transform light
into signals that the brain can use can cause severe
vision loss or even blindness. Dorsal ganglion
cysts form when microvascular structures in the
retina expand, leak, or burst as a consequence of
aberrant blood flow and excessive pressure.[1,2]
Worldwide, 642 million people will be living
with diabetes by 2040, with one-third developing
complications from the disease. This puts diabetes
ahead of all other causes of mortality, according to
the World Health Organization. The five stages of
disease progression are as follows: no illness, mild
Address for correspondence:
Jvalantkumar Kanaiyalal Patel
E-mail: jvalant007@gmail.com
disease, moderate disease, severe disease, and
proliferative disease.[3]
Proliferative DR (PDR) is
very similar to the first four types of DR, which
are together called non-PDR. Both of these types
include the development of aberrant blood vessels,
which can burst and lead to blindness. Early
signs include microaneurysms.[4]
Hard and soft
exudates, and hemorrhages. Different treatment
protocols are needed at each stage, and, at early
stages, monitoring is used, and laser therapy or
surgery is required at later stages. The key to the
treatment of DR is early detection and, in the case
of unavoidable progression, before complications
have occurred. Manual screening is inefficient,
slow, and prone to failure. Therefore, automated
diagnosis based on artificial intelligence (AI) is
more and more used, which promises to be quick,
reliable, and precise.
Fundus images have proved an effective and
non-invasive form of diagnosis in detection and
treatmentofdiabetesandoneofitscomplications.[5]
These photographs required detailed images of
the retina to be captured with its inner details such
Available Online at www.ajcse.info
Asian Journal of Computer Science Engineering 2025;10(3):1-11
ISSN 2581 – 3781](https://image.slidesharecdn.com/ajcse2392520250805v2-251010073110-d105f5e1/75/Classification-and-Identification-of-Diabetic-Retinopathy-from-Fundus-Images-Based-on-Deep-Convolutional-Networks-1-2048.jpg)
![Patel: Classification and identification of diabetic retinopathy from fundus images based on deep convolutional networks
AJCSE/Jul-Sep-2025/Vol 10/Issue 3 2
as the optic disc, macula, and blood vessels that
are greatly affected by diabetes. As commonly
known, fundus is traditionally considered to be
useful in the diagnosis of DR, but recent research
studies indicate that in cases where there are no
apparent signs of DR, fundus images still evince
microscopic alterations in the microvasculature,
which suggest an early occurrence of
diabetes.[6,7]
Due to the era of AI, scientists have
created machine learning (ML) model types that
can analyze such pictures and identify not only DR
but diabetes itself at a very early stage. Diagnostic
performance AI models based on fundus images
have been demonstrated in several studies to reach
high area under the receiver operating curves,
with values greater than. The models provide an
affordable, fast, and scalable method of screening,
especially in underserved regions where there is
little specialized care available.[8]
Further, using
fundus-based AI systems, the diabetes type can be
distinguished in terms of the duration, with better
results being observed where vascular changes are
more severe than less. It renders fundus imaging an
irreproachable instrument in early diagnosis and
monitoring of diabetes, which may revolutionize
the process of prevention and mitigate the long-
term conditions such as blindness and organ
failure.
In the recent past, computers have been able
to learn about large data sets in a manner that
surpasses or surpasses human capabilities in most
fields, owing to deep learning (DL) algorithms.
A number of algorithms which are highly
specific and sensitive in classifying or detecting
the existence of some disease conditions by
way of classifying medical images like retinal
images, exist.[9,10]
The current state of DL-based
DR screening algorithms is mostly focused on
finding individuals with referable or vision-
threatening DR. The goal is for these algorithms
to send patients to ophthalmologists for further
evaluation or follow-up. The importance of
finding early-stage DR should not be overlooked,
though. Diabetes can be put off or even reversed
if glucose, blood pressure, and lipid profiles are
well-controlled early on. All participants in this
study, whether they had diabetes or not, had
normal retinal fundus pictures and showed no
signs of diabetic eye disease. Ultimately, the study
aimed to develop an AI system capable of early
detection of DR in retinal fundus images. Not only
that, but also the research distinguished between
various disease durations.
Motivation and Contribution of Study
DRisoneofthemaincausesofavoidableblindness
around the world, so this study was motivated by
the urgent need to find it quickly and correctly.
People with diabetes are at a 1/3 chance of getting
DR, so finding it early is very important to avoid
permanent vision loss. However, screening by
hand takes a long time, costs a lot of money, and
can be different from one doctor to the next. The
use of fundus imaging being non-invasive and
widely accessible combined with the power of
AI and DL enables automated systems to detect
minute retinal abnormalities at early stages. This
study is driven by the goal of creating a scalable,
consistent, and accurate diagnostic framework for
DR detection using deep convolutional networks.
The main key contributions are as follows:
• Utilized the APTOS dataset, a large publicly
available fundus image dataset, to train and
validate the DR detection framework.
• Applied robust preprocessing techniques
including min–max normalization and image
resizing to standardize input dimensions,
along with data augmentation to increase
sample diversity and mitigate overfitting.
• ML model trained and released utilizing
ResNet50 architecture for automatic multi-
class classification across five DR severity
levels.
• Validated the model’s diagnostic reliability
and clinical application by evaluating its
performance using comprehensive criteria
such as accuracy, precision, recall, and
F1-score.
Justification and Novelty
The novelty of this study lies in its focus on the
early detection of diabetes and DR from fundus
images, even in patients who do not exhibit visible
signsofDR.Contrarytoseveralcurrentmodelsthat
simply focus only at detecting severe-to-moderate
levels or simply classify the DR as either present or
absent, the paper outlines an efficient multi-stage
classification scheme that is able to determine
each of the five levels of DR severity with the
help of a DL model comprising ResNet50. The](https://image.slidesharecdn.com/ajcse2392520250805v2-251010073110-d105f5e1/75/Classification-and-Identification-of-Diabetic-Retinopathy-from-Fundus-Images-Based-on-Deep-Convolutional-Networks-2-2048.jpg)
![Patel: Classification and identification of diabetic retinopathy from fundus images based on deep convolutional networks
AJCSE/Jul-Sep-2025/Vol 10/Issue 3 3
implementation of a complex preprocessing chain
(including scaling, normalization, augmentation,
and class imbalance correction to promote model
robustness and superior generalization) further
bolsters the claim of its originality. The model
also outperforms more conventional models such
as Dense Net and Mobile Net in terms of accuracy,
precision, recall, and F1-score. This positions the
proposed system as not only highly accurate but
also clinically relevant for scalable, early-stage
screening. The study’s ability to detect subtle
retinal changes prior to the appearance of clinical
symptoms highlights its potential to transform
preventive care strategies and reduce the long-
term burden of diabetes-related visual impairment,
particularly in resource-limited settings.
Structure of Paper
The outline of this paper is as follows: Section
II lists some of the most popular DL approaches
to DR detection currently available. Section III
explains the solution, as well as the preprocessing
and the ResNet50 model. The results and analysis
of the experiments are given in Section IV.
Following a brief overview of the results, Section
V offers suggestions for further studies.
LITERATURE REVIEW
This section presents research on DR detection
of fundus image systems that utilize diverse
ML techniques; the summary of these studies is
provided in Table 1.
Basheer et al. (2025) reported that DR is one
of the common eye illnesses and needs timely
detection with a chosen imaging modality. Retinal
optical coherence tomography (OCT)-based
analysis is one of the clinical practices and this
work developed a DL scheme for detecting the
DR in OCT data. Data preparation (including
resizing and collecting), feature extraction (using
classification results to identify the best model),
feature reduction (using 50% dropout and serial
concatenation to obtain the fused-features-vector),
classification, and three-fold cross validation are
the various steps involved in this work. This work
considered 2000 OCT images of normal/DR class
for the examination and the k-nearest neighbors
model-based scheme helped to get a detection
accuracy of 98%. This confirms that the proposed
DL-model based on ResNet variants works well
on this database.[11]
Vikraman and Sumathi proposed the DRC-
PCS-Artificial Neural Network (ANN), a novel
Table 1: Comparative analysis of DL techniques for diabetic retinopathy detection
Author Methodology Data set Key findings Limitation Future work
Basheer et al.
(2025)
ResNet variant+
50% dropout+ serial
concatenation+ KNN
OCT images (2000
samples)
Achieved
98% accuracy
with three‑fold
cross‑validation
Limited to binary
classification (Normal/DR)
Extend to multi‑class
DR classification and
larger datasets
Vikraman and
Sumathi (2025)
DRC‑PCS‑ANN
(Pyramidal Conv+ Shuffle
Attention)+DAGAF
preprocessing+ statistical
features+ PCS‑ANN
MESSIDOR Outperformed
existing models by up
to 23% in accuracy
and precision
Computationally complex;
lacks real‑time validation
Explore lightweight
deployment and
real‑world integration
Ahmed et al.
(2024)
ResNet‑18 (DL model) Kaggle DR dataset 99.91% training
accuracy; 96.65% test
accuracy
May suffer from overfitting
due to high training
accuracy
Test on unseen data or
cross‑dataset validation
Jenefa and
Subburam (2024)
EfficientNetB3+ transfer
learning
Kaggle (2750
images, 5 severity
levels)
98.55% training,
76.36% test accuracy
Large drop between training
and testing accuracy
(generalization gap)
Enhance generalization
and apply to real clinical
data
Pranay et al.
(2023)
Modified DenseNet‑121+
advanced preprocessing
Large DR fundus
dataset
Achieved 97%
accuracy, classified
DR into 5 stages
Lacks details on dataset
size/split and validation
strategy
Improve interpretability
and clinical applicability
Pavithra et al.
(2022)
Optic Net versus
DenseNet on OCT data
Standard OCT
dataset
Optic Net achieved
98% accuracy, 100%
specificity
Focused only on DME
(diabetic macular edema),
not full DR spectrum
Expand to DR staging
and multi‑modal inputs
Srinivasan and
Rajagopal (2021)
Review of DL‑based DR
detection using CNNs
Various datasets
(review paper)
DL offers superior
feature extraction
and accuracy over
traditional methods
No experimental
implementation; only
literature review
Implement and compare
reviewed methods on
standard benchmarks
DL: Deep learning, DR: Diabetic retinopathy, CNNs: Convolutional neural networks, DME: Diabetic macular edema, OCT: Optical coherence tomography, KNN: k‑nearest
neighbor, DAGAF: Data‑Adaptive Gaussian Average Filtering](https://image.slidesharecdn.com/ajcse2392520250805v2-251010073110-d105f5e1/75/Classification-and-Identification-of-Diabetic-Retinopathy-from-Fundus-Images-Based-on-Deep-Convolutional-Networks-3-2048.jpg)
![Patel: Classification and identification of diabetic retinopathy from fundus images based on deep convolutional networks
AJCSE/Jul-Sep-2025/Vol 10/Issue 3 4
architecture based on pyramidal convolution and
shuffle attention, for effective diabetic retinopathy
(DR) classification. The process begins with
acquiring input images from the MESSIDOR
database. For preprocessing, Data-Adaptive
Gaussian Average Filtering is applied to remove
noise and enhance image quality. Subsequently,
the one-dimensional quantum integer wavelet
S-transform is used to extract statistical features
such as mean, kurtosis, variance, and entropy.
Based on these initial features, the five DR
categories—No DR, Mild DR, Moderate DR,
Severe DR, and Proliferative DR (PDR)—are
classified, followed by the application of the
PCS-ANN model. The performance of DRC-
PCS-ANN is evaluated using metrics such as F1-
score, precision, and accuracy. When compared
to other DR classification models, including
DRC-MCNN-MLC, ADRPCS-DL, and ADR-
AFT-Convolutional Neural Network (CNN), the
DRC-PCS-ANN model demonstrates superior
performance, achieving increases in accuracy of
21.28%, 21.52%, and 20.34%, and in precision of
23.29%, 23.83%, and 21.72%, respectively.[12]
Ahmed et al. observed that DR is detected in
this work using a ResNet-18 DL model. The
dataset used in this study is divided into two
sections: training and testing. It was collected
through Kaggle with ResNet-18, able to achieve
96.65% testing accuracy and 99.91% training
accuracy. The results show that DL models, such
as as ResNet-18, can effectively detect DR early
on, which could completely change the way
screenings are done in clinical settings. Reducing
the overall risk of blindness among diabetes cases,
this proposed model can significantly expand
the breadth of early intervention and treatment
measures by simply streamlining the diagnostic
side of the treatment process. Patient outcomes
and healthcare resource allocation could both be
enhanced by implementing such technology.[13]
Jenefa and Subburam explain in depth how to use
Kaggle retinal scans to categorize the severity
of DR. The timeliness of the above response is
explained by the urgency of DR detection and
treatment measures. It should be noted that a
specifically arranged data set was created in the
described work, including 2750 pictures in with 5
groupsofseverity.Themaximumtrainingaccuracy
of 98.55% was reached using EfficientNetB3 with
transfer learning, and the validation and testing
accuracies constituted 71.27% and 76.36%,
respectively.[14]
Pranay et al. use DL to analyze various DR stages
and develop a unique methodology for detecting
DR. Model improves DR detection accuracy using
a modified pre-trained DenseNet-121 architecture
and better pre-processing algorithms. Once the
model has been trained on a large dataset, it may be
able to automatically identify the DR stage. From
0 to 4, the DR phases are grouped into five distinct
groups. According to this research, the patient’s
fundus ocular photos served as the model’s input
parameters. With a 97% accuracy rate, the model
surpassed the state-of-the-art models that were
discussed.[15]
Pavithra et al. (2022) observed that two DL
models, Optic Net, and Dense Net, were evaluated
and researched for diabetic macular edema (DME)
classification using a standard OCT dataset.
Comparing the two models’ performance is done
by statistically analyzing the accuracy measures
collected during the tests. As per the data, the
most suitable system for determining DME
might be the model Optic Net (Accuracy – 98%,
Specificity – 100%), which outperforms Dense
Net (Accuracy – 94%, Specificity – 96%).[16]
Srinivasan and Rajagopal (2021) reported that a
prevalentlong-termconditionaffectingindividuals
of all ages, characterized by inadequate insulin
synthesis and the resulting elevation of blood sugar
levels. Many other health problems might manifest
throughout the body as a result of untreated
diabetes. The asymptomatic deterioration of the
retinal vessels caused by diabetes is known as DR.
Conventional handcrafted traits have been utilized
in numerous automated diagnostic systems that
have been created in the literature. Since DL
automates feature extraction, it has the ability
to generate more precise and promising results,
which is especially useful in medical imaging.
One of the most common ways to employ DL
in medical image analysis is with CNN. To gain
a better understanding, this work analyses and
reviews various DL-based DR disease detection
and classification algorithms.[17]
Despite significant advancements in DR detection
using DL, several research gaps remain. Many
existing models, such as those using ResNet,
Dense Net, or Efficient Net variants, achieve high
training accuracy but often exhibit a notable drop
in validation or testing performance, indicating](https://image.slidesharecdn.com/ajcse2392520250805v2-251010073110-d105f5e1/75/Classification-and-Identification-of-Diabetic-Retinopathy-from-Fundus-Images-Based-on-Deep-Convolutional-Networks-4-2048.jpg)
![Patel: Classification and identification of diabetic retinopathy from fundus images based on deep convolutional networks
AJCSE/Jul-Sep-2025/Vol 10/Issue 3 6
distinct stage of DR. Each image is labeled to
indicate the severity of the condition: (0) No DR
shows a healthy retina, serving as a baseline. As
the condition progresses, visible signs of DR
become more apparent. (1) Mild DR exhibits
early, subtle changes. (2) Moderate DR indicates
a more pronounced progression of the disease.
(3) Extensive retinal damage is a hallmark of
severe DR, and (4) New aberrant blood vessels
appear in the final stage of DR, known as PDR.
DR is often graded according to the severity of
the condition using fundus photos, as seen in this
graphical progression.
Figure 4 presents the visual impact of data pre-
processing on fundus images, showcasing the
transformation from raw input to an enhanced
version for analysis. The top row, labeled
(a) Image 1, (b) Image 2, and (c) Image 3,
displays the original fundus images. These
images represent typical ophthalmic scans with
their inherent color, brightness, and contrast
variations. The bottom row, corresponding to
the same images after pre-processing, reveals
a significant change: the images appear
desaturated, almost grayscale, with a more
pronounced emphasis on the retinal blood vessels
and the optic disc. This transformation, likely
achieved through techniques such as grayscale
conversion, contrast enhancement, or perhaps
a form of edge detection or vessel extraction,
aims to normalize the image data and highlight
critical anatomical features, making them more
suitable for automated analysis, such as in the
detection of medical conditions.
Data Pre-processing
This is the final stage before feeding the data into
the ResNet50 models. Before training models,
performed several data pre-processing tasks, so
that the dataset is well structured and consistent.
The tasks include normalization, image resizing,
rescaling, and image augmentation.All these tasks
were performed to ensure the robustness of the
models.
Data Normalization with Min-Max Scaler
Reducing the size of individual pixels to a
uniform range is known as normalization. The
original range of pixel values in the fundus photos
was [0-255]; however, in this case, they were
scaled to [0–1]. Equation (1) ensures that all input
features (pixel intensities) are on the same scale,
which aids the ResNet50 model’s convergence
and increases numerical stability during training.
Normalized pixel value =
−
−
x x
x x
min
max min
(1)
Where:
• X = original pixel value (usually between 0
and 255 for RGB images)
• xmin
= 0
• Xmax
= 255
Bias Removal
The dataset used in this research was found to be
imbalanced, with an unequal distribution of images
across the five DR classes. As a result of this
disparity, training the model may become biassed
in favor of the dominant group. Oversampling
minority classes and using class weights during
training were two methods used to solve this
Figure 3: Sample fundus images from APTOS dataset
Figure 4: Before and after data preprocessing](https://image.slidesharecdn.com/ajcse2392520250805v2-251010073110-d105f5e1/75/Classification-and-Identification-of-Diabetic-Retinopathy-from-Fundus-Images-Based-on-Deep-Convolutional-Networks-6-2048.jpg)
![Patel: Classification and identification of diabetic retinopathy from fundus images based on deep convolutional networks
AJCSE/Jul-Sep-2025/Vol 10/Issue 3 7
problem. These strategies enable the model to
learn more fairly across all classes and enhance
its ability to accurately predict underrepresented
categories.
Variable Conversion
The train.csv file included two columns: id_code
and diagnosis, where diagnosis represented the
DR severity level as numerical values (0–4). Since
frameworks like Keras expect classification labels
to be in categorical (string) format for proper
handling during training, all diagnosis values
were converted from integers to strings. This
conversion ensures compatibility with categorical
loss functions and label encoding tools, enabling
accurate multi-class classification.
Image Resizing and Rescaling
The original fundus images in the dataset were
of varying dimensions and resolutions, which is
not suitable for training a ResNet50 that expects
uniform input shapes. Therefore, all images were
resized to (256, 256, 3), where 256 × 256 defines
the width and height, and 3 indicates the RGB
color channels. In addition, all pixel values were
normalized to a range between 0 and 1 to speed up
convergence during training and ensure numerical
stability in the network.
Image Augmentation
The dataset size and variability were artificially
increased through the use of picture augmentation
due to the small number of photos and the
preexisting class imbalance.[18]
Applying various
transformations to the training photographs using
Keres’s Image Data Generator, such as shear,
zoom, and horizontal flipping. This enhancement
helps with both lowering the model’s overfitting
threshold and improving its generalizability
through learning from different versions of the
same image.
Data Consolidation
Toefficientlyloadtheimage-labelpairsfortraining,
the data from the train.csv file was consolidated.
The id_code column, which identifies each image,
was appended with a.png extension to match the
actual filenames in the image directory. This step
ensured that every image could be correctly linked
to its corresponding diagnosis label, streamlining
the process of feeding data into the ResNet50
model.
Data Splitting
Training the model used 80% of the dataset
samples, whereas testing it used 20% of each
version’s dataset samples.
Classification with ResNet50 Model
The 50-layer CNN ResNet-50 learns residuals
instead of features. To solve the problem of the
disappearing/exploding gradient, this design
incorporates the Residual Network concept.
Consequently,insteadofonlytryingtoapproximate
the desired underlying mapping, H(x),[19]
really
learn a residual function H(x). To do this, build a
stack of layers such that their output, denoted as
y = F(x) + x, is obtained by adding each element
of the original input, x, to the output, F(x).
Hence, if still wish to discover the underlying
mapping y = H(x), then F(x) = H(x) − x, and
y = F(x) + x = H(x) − x + x = H(x) follows. Since
now easily learn y = x by setting all weights to 0,
the concept of learning identity mappings becomes
simpler. This is because H(x) = 0 and F(x) = −x.
After that, have the activation function, f, and the
result is H(x), as demonstrated in Equations (2)
and (3), respectively.
H(x) = f(wx
+ b)(2)
H(x) = f(x) + x(3)
Performance Matrix
A wide range of performance evaluation criteria
are employed in this study. Most of these solutions
depend on the confusion matrix that is developed
during the identification job testing procedure.[20,21]
The calculations for these procedures are as
follows:
𝐴𝑐𝑐𝑢𝑟𝑎𝑐𝑦 (𝐴𝑐), 𝑝𝑟𝑒𝑐𝑖𝑠𝑖𝑜𝑛 (𝑃𝑒), 𝑅𝑒𝑐𝑎𝑙𝑙 (𝑅𝑒) and
𝐹1 s𝑐𝑜𝑟𝑒 (𝐹1−𝑠).
The following defines these performance matrices:](https://image.slidesharecdn.com/ajcse2392520250805v2-251010073110-d105f5e1/75/Classification-and-Identification-of-Diabetic-Retinopathy-from-Fundus-Images-Based-on-Deep-Convolutional-Networks-7-2048.jpg)
![Patel: Classification and identification of diabetic retinopathy from fundus images based on deep convolutional networks
AJCSE/Jul-Sep-2025/Vol 10/Issue 3 9
validation of model ResNet50 during 200 epochs.
The graph indicates that training (acc) and
validation (val_acc) accuracy is quickly rising in
the first 25 epochs of the model, and the validation
accuracy has already approached perfection levels
at an early stage. As the training improves, the two
curves will converge and stabilize at a rate of about
99–100% accuracy which implies good learning
and generalization. On the whole, the ResNet50
model turns out to be quite effective and robust
in terms of categorizing DR using fundus images.
The training and validation loss curves of the
ResNet50 model are shown in Figure 6 during
the 200 epochs training. The two loss curves
begin above 3.0 and take a steady and smooth
path towards the end of the training process
with the loss curves finally converging to form
values of 0.5. The fact that training loss (loss)
and validation loss (val_loss) are very similar
is an indication of the fact that the model is
learning efficiently and not overfitting. These
two curves maintain a smooth decline, indicating
a steady optimization procedure along with good
generalization abilities. The ResNet50 model is,
in general, effective in the learning process and
robust, which makes the process of determining
the DR an accurate process.
Figure 7 shows a confusion matrix of ResNet50
model,whichshowsexcellentclassificationresults.
In a sample size of 102 where all the samples
were used, the model did not misclassify any of
the samples; the model was right in 6 of the cases
of someone being healthy and a total of 96 cases
of DR when matched with the original results. It
did not include false positives and negative cases,
leading to a perfect classification. The result
proves that the ResNet50 model reached 100%
accuracy, precision, recall, and F1-score on this
dataset, which proves that it is extremely effective
at differentiating between the healthy and DR-
affected retina images without a single mistake.
Comparative analysis of different models
considered on theAPTOS dataset to classify retinal
diseases can be obtained with the help of Table 3.
Demonstrating better accuracy, the ResNet50
model is proved to be more efficient in finding
complex patterns in the dataset. Conversely,
models like Mobile Net, DenseNet-121, and
support vector machine (SVM) display relatively
lower levels of accuracy, which, in turn, underlines
the merit of more profound convolutional
architectures when analyzing medical images.
The findings indicate that the residual learning
structure of ResNet50 serves as a more confident
choice in terms of applying it in high precision
diagnosing tasks, especially in ophthalmology
https://truewriter.game/, since it encompasses
more features extractions skills.
The offered ResNet50 program demonstrates
excellent results on the APTOS set, being the most
accurate among the reviewed programs. Its long-
lasting account of learning models is proficient in
training very deep networks as it tends to relieve
the vanishing gradient issue, advancing feature
representation and categorization capacity. Such an
architecturalrobustnessenablesthemodeltoidentify
even pronounced patterns in the retinal images and
hence is one of the reasons why the model is best
suited where medical images are under analysis.
The accuracy of more than 92% is indicative of the
strength of the model, generalization capacity, and
its relevance in the implementation of automated
DR screening systems.
CONCLUSION AND FUTURE SCOPE
Patients with delayed diagnosis and treatment are
more prone to lose sight despite being DR patients.
Table 3: Comparison between models on APTOS dataset
Matrix ResNet50 Mobile
net[22]
DenseNet‑121[23]
SVM[24]
Accuracy 99 79.01 81.23 94.5
SVM: Support vector machine
Figure 7: Confusion matrix of ResNet50 model](https://image.slidesharecdn.com/ajcse2392520250805v2-251010073110-d105f5e1/75/Classification-and-Identification-of-Diabetic-Retinopathy-from-Fundus-Images-Based-on-Deep-Convolutional-Networks-9-2048.jpg)