This document describes exact tests for assessing Hardy-Weinberg equilibrium that control type 1 error rates better than chi-squared tests, especially for large sample sizes. It presents efficient computational methods for implementing these exact tests, which sum probabilities of all possible genotype configurations conditional on observed allele counts. These exact tests have been programmed into freely available software for quality control and association testing in large genetic studies.
allele distributionIn population genetics, allele frequencies are.pdfaparnaagenciestvm
allele distribution:
In population genetics, allele frequencies are used to describe the amount of variation at a
particular locus or across multiple loci. When considering the ensemble of allele frequencies for
a large number of distinct loci, their distribution is called the allele frequency spectrum.
Distribution of Allele Frequency
Investigation of the distribution of minor-allele frequencies (MAF) suggests that for all traits,
except possibly for HDL level, the distribution of observed susceptibility SNPs is skewed toward
higher minor-allele frequencies (MAF >20%) rather than intermediate frequencies (MAF
5–20%) in comparison with SNP allele-frequency distributions in general human populations or
among tagging SNPs that have been included in common genotyping platforms. Overall, out of
387 SNPs included in the analysis for all traits combined, the fraction of SNPs with intermediate-
frequency categories was only 23.0%, which was significantly lower than the corresponding
fraction of 55.0% among independent representative SNPs (any pairwise r2 0.1) from the
HapMap (hapmap.ncbi.nlm.nih.gov) database (P = 2.05 × 1030). The power-weighted analysis
also estimated a relatively small fraction (26.4%) of susceptibility SNPs for the intermediate-
frequency category, and thus indicated that the observed clustering of common susceptibility
SNPs toward higher frequencies is unlikely to have resulted from the artifacts of study power.
Distribution of Effect Sizes for Susceptibility SNPs.
We define “effect size” for susceptibility SNPs using two alternative criteria. In one, we define it
as the coefficient () for a SNP when its association with the outcome is modeled through a
regression model, such as linear regression for a quantitative trait or logistic regression for a
qualitative trait, assuming a linear trend per copy of an allele. In our analysis, the regression
coefficients for quantitative traits are presented in units of standard deviation (SD) of the trait so
that they are comparable across traits. In a second criterion, we define effect size as the
contribution of the SNP to genetic variance of the trait, that is, gv = 22f(1 f), where f is the allele
frequency for either of the two SNP alleles (4). It is noteworthy that the power for detection of a
susceptibility SNP for most commonly used association tests that assume linear trend depends on
and f only through the quantity gv (4)
Determining allele and genotype frequencies can be done two slightly different ways. One
method involves converting the initial numbers of each genotype to frequencies and then doing
all calculations as frequencies. In this case the frequency of the p allele = the frequency of the
p/p homozygotes + 1/2 the frequency of the heterozygotes. The frequency of the q allele = the
Determining allele and genotype frequencies can be done two slightly different ways. One
method involves converting the initial numbers of each genotype to frequencies and then doing
all calcul.
This document summarizes statistical methods for analyzing single nucleotide polymorphisms (SNPs). It discusses Hardy-Weinberg equilibrium, case-control association studies, and haplotype estimation and association. It also reviews sequential analysis for determining required sample size. Statistical tools covered include tests for Hardy-Weinberg equilibrium, chi-square tests, odds ratios, and methods for accounting for errors in genotype and phenotype classification.
The document summarizes a study that uses an information-based similarity index to classify the SARS coronavirus. Key points:
1) The study develops a novel alignment-free method to measure genetic sequence similarity based on word frequencies and information content.
2) The method is first validated on human influenza and mitochondrial DNA, correctly reconstructing known phylogenies.
3) The method is then applied to classify SARS coronavirus, finding it is most closely related to group 1 coronaviruses, with some matches to groups 2 and 3.
4) The information-based similarity index provides a new tool for large-scale genomic analysis without sequence alignment.
ASHG 2015 - Redundant Annotations in Tertiary AnalysisJames Warren
After obtaining genetic variants from next generation sequencing data, a precursory step in tertiary analysis is to annotate each variant with available relevant information. There is no standardized compendium for this purpose; researchers instead are required to compile data from a motley of annotation tools and public datasets. These sources for annotation are independently maintained, and accordingly there is limited concordance between their reported contents. The choice of annotation datasets thus has a direct and significant impact on the results of the analysis.
This document provides an introduction to genome-wide association studies (GWAS) and their role in discovering the genetic basis of complex traits and diseases. It explains that GWAS are a hypothesis-free approach to searching the entire human genome for genetic variants associated with a trait using common single nucleotide polymorphisms. Over 2,000 traits and diseases have been studied through GWAS, identifying over 15,000 genetic associations. The document traces the development of GWAS from early human genome sequencing and projects to characterize human genetic variation to the availability of high-throughput genotyping arrays that enabled widespread application of GWAS in disease research.
This document summarizes a genome-wide linkage study of families with absolute pitch (AP). The study identified a region on chromosome 8q24.21 that showed significant linkage to AP in families of European ancestry. Additional regions with suggestive linkage included chromosomes 7q22.3, 8q21.11, and 9p21.3 in European families. No single region reached significance in families of East Asian ancestry, though several regions had nominal linkage. Overall, the results provide evidence that AP has a genetic basis and is genetically heterogeneous.
1. The standard deviation of the diameter at breast height, or DBH.docxpaynetawnya
1. The standard deviation of the diameter at breast height, or DBH, of the slash pine tree is less than one inch. Identify the Type I error. (Points : 1)
Fail to support the claim σ < 1 when σ < 1 is true.
Support the claim μ < 1 when μ = 1 is true.
Support the claim σ < 1 when σ = 1 is true. Fail to support the claim μ < 1 when μ < 1 is true.
1a. The EPA claims that fluoride in children's drinking water should be at a mean level of less than 1.2 ppm, or parts per million, to reduce the number of dental cavities. Identify the Type I error. (Points : 1)
Fail to support the claim σ < 1.2 when σ < 1.2 is true.
Support the claim μ < 1.2 when μ = 1.2 is true.
Support the claim σ < 1.2 when σ = 1.2 is true.
Fail to support the claim μ < 1.2 when μ < 1.2 is true.
2. Biologists are investigating if their efforts to prevent erosion on the bank of a stream have been statistically significant. For this stream, a narrow channel width is a good indicator that erosion is not occurring. Test the claim that the mean width of ten locations within the stream is greater than 3.7 meters. Assume that a simple random sample has been taken, the population standard deviation is not known, and the population is normally distributed. Use the following sample data:
3.3 3.3 3.5 4.9 3.5 4.1 4.1 5 7.3 6.2
What is the P-value associated with your test statistic? Report your answer with three decimals, e.g., .987 (Points : 1)
2a. Medical researchers studying two therapies for treating patients infected with Hepatitis C found the following data. Assume a .05 significance level for testing the claim that the proportions are not equal. Also, assume the two simple random samples are independent and that the conditions np ≥ 5 and nq ≥ 5 are satisfied.
Therapy 1
Therapy 2
Number of patients
39
47
Eliminated Hepatitis
20
13
C infection
Construct a 95% confidence interval estimate of the odds ratio of the odds for having Hepatitis C after Therapy 1 to the odds for having Hepatitis C after Therapy 2. Give your answer with two decimals, e.g., (12.34,56.78) (Points : 0.5)
3. Researchers studying sleep loss followed the length of sleep, in hours, of 10 individuals with insomnia before and after cognitive behavioral therapy (CBT). Assume a .05 significance level to test the claim that there is a difference between the length of sleep of individuals before and after CBT. Also, assume the data consist of matched pairs, the samples are simple random samples, and the pairs of values are from a population having a distribution that is approximately normal.
Individual
1
2
3
4
5
6
7
8
9
10
Before
6
5
4
5
3
4
5
3
4
2
CBT
After
8
8
7
6
7
6
6
5
7
5
CBT
Construct a 95% confidence interval estimate of the mean difference between the lengths of sleep. Give your answer with two decimals, e.g., (12.34,56.78) (Points : 0.5)
3a. Scientists, researching large woody debris (LWD), surveyed the number of LWD ...
This document summarizes research on estimating the population fitness and genetic load of single nucleotide polymorphisms (SNPs) that affect mRNA splicing. The authors develop an objective function to relate differences in the information content of alleles to the fitness of genotypes in a population. They analyze over 1 million SNPs from the HapMap project and identify thousands that alter natural splice site information. By calculating genetic load based on changes in information content and allele frequency, they partition SNPs according to their predicted effect on splicing and population fitness. Many predicted effects are supported by gene expression studies. Their analysis provides insights into how natural selection acts on splicing-related SNPs.
This document summarizes a study that analyzed genetic variants called single nucleotide polymorphisms (SNPs) that affect mRNA splicing. The researchers developed a method to estimate the population fitness and genetic load of SNPs based on how they alter the information content of mRNA splicing sites. They analyzed SNPs in human populations that were known to affect splicing sites. Many of the predicted effects of SNPs on splicing and gene expression were supported by gene expression data. The researchers integrated various genetic and genomic datasets into a database to relate SNPs to changes in splicing and gene expression. They computed the genetic fitness and load for all SNPs in databases to analyze their potential effects on populations based on changes to splicing site information content and allele frequencies.
The epidemiology of schistosomiasis in the later stages of a control program ...Alim A-H Yacoub Lovers
Southgate BA, Yacoub A. The epidemiology of schistosomiasis in the later stages of a control program based on chemotherapy: the Basrah study. 3. Antibody distributions and the use of age catalytic models and log-probit analysis in seroepidemiology. Transactions of the Royal Society of Tropical Medicine and Hygiene. 1987 Jan 1;81(3):468-75.
This document provides an outline and overview of key concepts in case-control study design and analysis. It discusses topics such as measures of disease occurrence, relative risk, sample size calculation, methods for adjusting for confounding, and multivariate analysis techniques including logistic regression and log-linear models. The goal is to introduce the basic methodology for case-control studies and analyzing associations between disease outcomes and exposures of interest.
This document summarizes an association mapping study of seed oil and protein contents in upland cotton. 180 cotton accessions were genotyped using 228 SSR markers and phenotyped for oil and protein content over multiple locations and years. Population structure analysis identified two subpopulations. Association analysis identified 86 marker-trait associations between 58 SSR markers and the two traits, with 15 and 12 markers associated with oil and protein content respectively. 18 markers were significantly associated with the traits in more than one environment, with 9 markers associated with both oil and protein content simultaneously and stably across locations.
Common Statistical Methods Used In Transgenic Fish ResearchMohamed Afifi
The document discusses common statistical methods used in transgenic fish research. It begins with an overview of experimental design considerations such as sample size and replication before gene transfer and measurement of traits after gene transfer. Key statistical techniques covered include t-tests, ANOVA, regression, and chi-square tests. Results are typically reported with mean and standard error or deviation values and indicated significance using letters or asterisks. Graphs such as bar plots and box plots are also used to visually present results.
This document summarizes key aspects of analysis of variance (ANOVA), including the basic logic and steps of hypothesis testing, different types of ANOVA for different experimental designs, and methods for multiple comparisons. It discusses one-way ANOVA for completely randomized designs and randomized complete-block designs, assumptions of ANOVA, and post-hoc tests like least significant difference and Student-Newman-Keuls tests for comparing group means. Examples are provided to illustrate random assignment of subjects to groups and testing for differences in group means.
Analysis of Variance (ANOVA), MANOVA: Expected variance components, Random an...Satish Khadia
This document provides an introduction to analysis of variance (ANOVA) and multivariate analysis of variance (MANOVA). It discusses key concepts like variance components, fixed and random models, and the assumptions of MANOVA. The goals of ANOVA are described as estimating variance components, evaluating genetic contributions, and testing hypotheses. MANOVA tests for differences in multiple dependent variables simultaneously, which can protect against Type I errors compared to multiple ANOVAs. Both methods require assumptions like normality and homogeneity of variances.
Genome mapping identifies and records the location of genes and distances between genes on chromosomes. Alfred Sturtevant created the first genetic map of Drosophila in 1913 by proposing that crossover frequency could determine gene location. Techniques like linkage analysis using two-point and three-point test crosses estimate distances between genes based on inheritance patterns. Genetic maps describe gene arrangement but have limitations due to recombination hotspots and need for high crossover scoring. Gene mapping is important for identifying disease genes and trait genes in plants, animals and humans.
This document summarizes analysis of variance (ANOVA) methods, including:
1) The basic steps and logic of ANOVA, and how it is used to test for differences between two or more groups.
2) Applying a one-way ANOVA to data from a completely randomized design with at least three groups to test if their means are significantly different.
3) Performing multiple comparisons, like the LSD t-test and SNK q-test, to examine differences between specific group means.
3) Using a two-way ANOVA for a randomized complete-block design to reduce variation between experimental units and test if treatment means differ.
Simulating Genes in Genome-wide Association StudiesKevin Thornton
Talk given to the UCI Genetic Epidemiology Research Group (GERI, http://www.geri.uci.edu/) on May 16, 2014. Recent results on power to detect associations in growing populations + need for better statistical tests.
Genome-wide association studies (GWAS) allow researchers to scan the entire human genome to find genetic variations associated with particular diseases. The document describes a multi-stage GWAS that identified genetic variants associated with type 2 diabetes. It involved initial genome-wide scans followed by focused validation stages with increasing sample sizes. Several loci were confirmed, including regions near TCF7L2, SLC30A8, and HHEX genes. A variant near IRS1 was also identified. Association results were assessed in additional populations and metabolic trait analyses.
This document outlines key concepts for designing genetic association studies, including study design, analysis methods, and replication. It discusses factors like sample size calculations, candidate gene vs. genome-wide approaches, analysis of single nucleotide polymorphisms (SNPs) versus haplotypes, multiple testing corrections, and the importance of replication in independent studies. Statistical methods covered include regression, adjusting for population stratification, and software for analyzing candidate genes and genome-wide data.
Population Genetic Models of Genomic ImprintingGavin Pearce
This document presents several population genetic models of genomic imprinting and draws the following conclusions:
(1) Systems with genomic imprinting do not necessarily behave the same as identical systems without imprinting.
(2) However, many of the models investigated can be shown to be formally equivalent to models without imprinting.
(3) Consequently, imprinting often cannot be discovered by following allele frequency changes or examining equilibrium values.
The document then goes on to describe four specific models of genomic imprinting and the population genetic dynamics that result from each.
This document discusses methods for measuring natural selection at the molecular level by comparing DNA sequences. It introduces the concept of measuring the ratio of non-synonymous to synonymous substitutions (ω) to detect positive, purifying, or neutral selection. A ratio of ω>1 indicates positive selection, ω<1 indicates purifying selection, and ω=1 indicates neutral evolution. It outlines three step counting methods to calculate ω, but notes these methods are complicated by factors like transition/transversion bias and codon frequency bias. Later methods aim to better account for these biases to more accurately measure natural selection through DNA sequence comparisons.
GWAS studies examine associations between genetic variants and observable traits. They involve genotyping large numbers of individuals for SNPs across the genome and identifying statistical associations between specific SNPs and traits. Key challenges include identifying causal variants from associated regions and prioritizing SNPs for follow up. GRAIL and GenoWAP are approaches for addressing these challenges by integrating functional genomic data with GWAS results to predict causal genes and prioritize SNPs for further study. GRAIL ranks genes in associated regions based on relatedness to other genes in GWAS-implicated regions. GenoWAP integrates functional predictions and GWAS p-values to assign each SNP a score reflecting its potential importance.
This document discusses a study that found significant differences in gene expression variability between knockout and wild-type mice using microarray data from 25 publicly available datasets. The study found that knockouts exhibited either significantly increased or decreased variability compared to wild-types in virtually every dataset analyzed. Examination of the data distributions indicated that these differences were due to broad changes in variability across most genes, rather than being driven by outliers. The findings suggest that changes in gene expression variability due to gene knockouts may have important phenotypic consequences.
In this document, I have tried to illustrate most of the hypothesis testing like 1 sample,2 samples, etc, which I have covered to analyze the machine learning algorithms. I have focused on Independent statistical testing.
Now the question is why we use statistical testing? the answer is that we use statistical testing for significance analysis of our results, which I am going to deliver
The document discusses renting a sports car in Siena, Italy to explore the scenic roads and attractions of the area. It notes the many things to see and do in Siena like historic sites and a cooking school. It promotes renting a luxury sports car as the best way to get around without sitting on the beach, and that the rental company has many high-quality sports car options to suit different tastes and styles. Renting a sports car is presented as the ideal method for experiencing all Siena has to offer in a comfortable and enjoyable fashion.
Top 7 Rules For Writing A Good Analysis EssayStephen Faucher
This document discusses the processes of coagulation and flocculation, which are important steps in wastewater treatment. Coagulation involves adding positively charged chemicals called coagulants to contaminated water to neutralize negatively charged particles and allow them to clump together. Common coagulants are aluminum-based or iron-based salts. Flocculation follows coagulation and involves gentle mixing to encourage the neutralized particles to stick together into larger clumps or flocs that are easier to remove from the water by settling. Together, coagulation and flocculation are effective methods for removing dissolved and suspended contaminants from wastewater.
More Related Content
Similar to A Note On Exact Tests Of Hardy-Weinberg Equilibrium
This document summarizes research on estimating the population fitness and genetic load of single nucleotide polymorphisms (SNPs) that affect mRNA splicing. The authors develop an objective function to relate differences in the information content of alleles to the fitness of genotypes in a population. They analyze over 1 million SNPs from the HapMap project and identify thousands that alter natural splice site information. By calculating genetic load based on changes in information content and allele frequency, they partition SNPs according to their predicted effect on splicing and population fitness. Many predicted effects are supported by gene expression studies. Their analysis provides insights into how natural selection acts on splicing-related SNPs.
This document summarizes a study that analyzed genetic variants called single nucleotide polymorphisms (SNPs) that affect mRNA splicing. The researchers developed a method to estimate the population fitness and genetic load of SNPs based on how they alter the information content of mRNA splicing sites. They analyzed SNPs in human populations that were known to affect splicing sites. Many of the predicted effects of SNPs on splicing and gene expression were supported by gene expression data. The researchers integrated various genetic and genomic datasets into a database to relate SNPs to changes in splicing and gene expression. They computed the genetic fitness and load for all SNPs in databases to analyze their potential effects on populations based on changes to splicing site information content and allele frequencies.
The epidemiology of schistosomiasis in the later stages of a control program ...Alim A-H Yacoub Lovers
Southgate BA, Yacoub A. The epidemiology of schistosomiasis in the later stages of a control program based on chemotherapy: the Basrah study. 3. Antibody distributions and the use of age catalytic models and log-probit analysis in seroepidemiology. Transactions of the Royal Society of Tropical Medicine and Hygiene. 1987 Jan 1;81(3):468-75.
This document provides an outline and overview of key concepts in case-control study design and analysis. It discusses topics such as measures of disease occurrence, relative risk, sample size calculation, methods for adjusting for confounding, and multivariate analysis techniques including logistic regression and log-linear models. The goal is to introduce the basic methodology for case-control studies and analyzing associations between disease outcomes and exposures of interest.
This document summarizes an association mapping study of seed oil and protein contents in upland cotton. 180 cotton accessions were genotyped using 228 SSR markers and phenotyped for oil and protein content over multiple locations and years. Population structure analysis identified two subpopulations. Association analysis identified 86 marker-trait associations between 58 SSR markers and the two traits, with 15 and 12 markers associated with oil and protein content respectively. 18 markers were significantly associated with the traits in more than one environment, with 9 markers associated with both oil and protein content simultaneously and stably across locations.
Common Statistical Methods Used In Transgenic Fish ResearchMohamed Afifi
The document discusses common statistical methods used in transgenic fish research. It begins with an overview of experimental design considerations such as sample size and replication before gene transfer and measurement of traits after gene transfer. Key statistical techniques covered include t-tests, ANOVA, regression, and chi-square tests. Results are typically reported with mean and standard error or deviation values and indicated significance using letters or asterisks. Graphs such as bar plots and box plots are also used to visually present results.
This document summarizes key aspects of analysis of variance (ANOVA), including the basic logic and steps of hypothesis testing, different types of ANOVA for different experimental designs, and methods for multiple comparisons. It discusses one-way ANOVA for completely randomized designs and randomized complete-block designs, assumptions of ANOVA, and post-hoc tests like least significant difference and Student-Newman-Keuls tests for comparing group means. Examples are provided to illustrate random assignment of subjects to groups and testing for differences in group means.
Analysis of Variance (ANOVA), MANOVA: Expected variance components, Random an...Satish Khadia
This document provides an introduction to analysis of variance (ANOVA) and multivariate analysis of variance (MANOVA). It discusses key concepts like variance components, fixed and random models, and the assumptions of MANOVA. The goals of ANOVA are described as estimating variance components, evaluating genetic contributions, and testing hypotheses. MANOVA tests for differences in multiple dependent variables simultaneously, which can protect against Type I errors compared to multiple ANOVAs. Both methods require assumptions like normality and homogeneity of variances.
Genome mapping identifies and records the location of genes and distances between genes on chromosomes. Alfred Sturtevant created the first genetic map of Drosophila in 1913 by proposing that crossover frequency could determine gene location. Techniques like linkage analysis using two-point and three-point test crosses estimate distances between genes based on inheritance patterns. Genetic maps describe gene arrangement but have limitations due to recombination hotspots and need for high crossover scoring. Gene mapping is important for identifying disease genes and trait genes in plants, animals and humans.
This document summarizes analysis of variance (ANOVA) methods, including:
1) The basic steps and logic of ANOVA, and how it is used to test for differences between two or more groups.
2) Applying a one-way ANOVA to data from a completely randomized design with at least three groups to test if their means are significantly different.
3) Performing multiple comparisons, like the LSD t-test and SNK q-test, to examine differences between specific group means.
3) Using a two-way ANOVA for a randomized complete-block design to reduce variation between experimental units and test if treatment means differ.
Simulating Genes in Genome-wide Association StudiesKevin Thornton
Talk given to the UCI Genetic Epidemiology Research Group (GERI, http://www.geri.uci.edu/) on May 16, 2014. Recent results on power to detect associations in growing populations + need for better statistical tests.
Genome-wide association studies (GWAS) allow researchers to scan the entire human genome to find genetic variations associated with particular diseases. The document describes a multi-stage GWAS that identified genetic variants associated with type 2 diabetes. It involved initial genome-wide scans followed by focused validation stages with increasing sample sizes. Several loci were confirmed, including regions near TCF7L2, SLC30A8, and HHEX genes. A variant near IRS1 was also identified. Association results were assessed in additional populations and metabolic trait analyses.
This document outlines key concepts for designing genetic association studies, including study design, analysis methods, and replication. It discusses factors like sample size calculations, candidate gene vs. genome-wide approaches, analysis of single nucleotide polymorphisms (SNPs) versus haplotypes, multiple testing corrections, and the importance of replication in independent studies. Statistical methods covered include regression, adjusting for population stratification, and software for analyzing candidate genes and genome-wide data.
Population Genetic Models of Genomic ImprintingGavin Pearce
This document presents several population genetic models of genomic imprinting and draws the following conclusions:
(1) Systems with genomic imprinting do not necessarily behave the same as identical systems without imprinting.
(2) However, many of the models investigated can be shown to be formally equivalent to models without imprinting.
(3) Consequently, imprinting often cannot be discovered by following allele frequency changes or examining equilibrium values.
The document then goes on to describe four specific models of genomic imprinting and the population genetic dynamics that result from each.
This document discusses methods for measuring natural selection at the molecular level by comparing DNA sequences. It introduces the concept of measuring the ratio of non-synonymous to synonymous substitutions (ω) to detect positive, purifying, or neutral selection. A ratio of ω>1 indicates positive selection, ω<1 indicates purifying selection, and ω=1 indicates neutral evolution. It outlines three step counting methods to calculate ω, but notes these methods are complicated by factors like transition/transversion bias and codon frequency bias. Later methods aim to better account for these biases to more accurately measure natural selection through DNA sequence comparisons.
GWAS studies examine associations between genetic variants and observable traits. They involve genotyping large numbers of individuals for SNPs across the genome and identifying statistical associations between specific SNPs and traits. Key challenges include identifying causal variants from associated regions and prioritizing SNPs for follow up. GRAIL and GenoWAP are approaches for addressing these challenges by integrating functional genomic data with GWAS results to predict causal genes and prioritize SNPs for further study. GRAIL ranks genes in associated regions based on relatedness to other genes in GWAS-implicated regions. GenoWAP integrates functional predictions and GWAS p-values to assign each SNP a score reflecting its potential importance.
This document discusses a study that found significant differences in gene expression variability between knockout and wild-type mice using microarray data from 25 publicly available datasets. The study found that knockouts exhibited either significantly increased or decreased variability compared to wild-types in virtually every dataset analyzed. Examination of the data distributions indicated that these differences were due to broad changes in variability across most genes, rather than being driven by outliers. The findings suggest that changes in gene expression variability due to gene knockouts may have important phenotypic consequences.
In this document, I have tried to illustrate most of the hypothesis testing like 1 sample,2 samples, etc, which I have covered to analyze the machine learning algorithms. I have focused on Independent statistical testing.
Now the question is why we use statistical testing? the answer is that we use statistical testing for significance analysis of our results, which I am going to deliver
Similar to A Note On Exact Tests Of Hardy-Weinberg Equilibrium (20)
The document discusses renting a sports car in Siena, Italy to explore the scenic roads and attractions of the area. It notes the many things to see and do in Siena like historic sites and a cooking school. It promotes renting a luxury sports car as the best way to get around without sitting on the beach, and that the rental company has many high-quality sports car options to suit different tastes and styles. Renting a sports car is presented as the ideal method for experiencing all Siena has to offer in a comfortable and enjoyable fashion.
Top 7 Rules For Writing A Good Analysis EssayStephen Faucher
This document discusses the processes of coagulation and flocculation, which are important steps in wastewater treatment. Coagulation involves adding positively charged chemicals called coagulants to contaminated water to neutralize negatively charged particles and allow them to clump together. Common coagulants are aluminum-based or iron-based salts. Flocculation follows coagulation and involves gentle mixing to encourage the neutralized particles to stick together into larger clumps or flocs that are easier to remove from the water by settling. Together, coagulation and flocculation are effective methods for removing dissolved and suspended contaminants from wastewater.
Is It Okay To Include Quotes In College Essays - GradesHQStephen Faucher
The document discusses the speaker's early experiences owning cats on their family farm. As a young child, around age three, they found two kittens, which they named George and Washington. Living on the farm, barn cats were always present. Owning George and Washington allowed the speaker to begin learning about different animal types from an early age, growing up on the farm.
A Manual For Writers Of Term Papers Theses And DissertStephen Faucher
This document discusses Australian tax reform and the government's focus on paying down national debt instead of cutting taxes. It argues that using surplus funds to cut marginal tax rates, like during the Reagan administration, would grow the economy faster than using the funds to retire debt. Lower taxes would encourage more investment and savings. While paying down debt seems prudent, in reality governments will spend surplus money on other programs. Overall, tax reform is a smarter strategy than focusing solely on reducing debt.
Example Of An Abstract For A Research Report - English LaStephen Faucher
The document discusses building a people strategy for Nando's, a casual dining restaurant chain founded in South Africa in 1987 that is known for its Portuguese and Mozambican cuisine. It operates in 26 countries, including entering the UK market in 1992. When developing a people strategy, Nando's must consider its culture of informality, diversity of markets, and focus on training and engagement to support its continued international expansion.
The document provides instructions for creating an account and submitting an assignment request on the HelpWriting.net website. It outlines a 5-step process: 1) Create an account with a password and email. 2) Complete a form with assignment details, sources, and deadline. 3) Review bids from writers and choose one. 4) Review the completed paper and authorize payment. 5) Request revisions to ensure satisfaction, with a full refund option for plagiarism.
Essay Essaywriting How To Do A Research Assignment,Stephen Faucher
This document provides instructions for completing a research assignment through an online service in 5 steps:
1. Create an account and provide contact information.
2. Complete an order form with instructions, sources, deadline, and attach a sample if wanting the writer to match writing style.
3. Review bids from writers and choose one based on qualifications, history, and feedback, then pay a deposit to start.
4. Review the completed paper and authorize final payment if pleased, or request revisions.
5. Multiple revisions are allowed to ensure satisfaction, and plagiarized work will be refunded.
I apologize, upon further reflection I do not feel comfortable generating a summary or response about this topic without proper theological or historical context.
Lala Lajpat Rai was an Indian freedom fighter who openly protested British rule and wanted India to gain independence. He was arrested several times for protesting and organizing opposition to British colonialism. During a protest, he was beaten by police which led to his death, making him a martyr for the Indian independence movement.
Transition Words And Phrases, Detailed List - LeStephen Faucher
The document provides instructions for creating an account and submitting a request for writing assistance on the HelpWriting.net website. It outlines a 5-step process: 1) Create an account by providing a password and email. 2) Complete a 10-minute order form with instructions, sources, and deadline. 3) Review bids from writers and select one based on qualifications. 4) Review the completed paper and authorize payment if satisfied. 5) Request revisions until fully satisfied, with the option of a refund for plagiarized work. The process aims to match clients with qualified writers and ensure client satisfaction through revisions.
The document outlines the 5 step process for ordering an essay writing service through HelpWriting.net:
1. Create an account with a password and email.
2. Complete a 10-minute order form providing instructions, sources, deadline and attaching a sample if wanting the writer to imitate writing style.
3. Review bids from writers for the request, choose one based on qualifications and feedback, then place a deposit to start the assignment.
4. Review the completed paper and authorize final payment if pleased, or request free revisions.
5. Request multiple revisions to ensure satisfaction, and the service guarantees original, high-quality content or a full refund.
This document provides steps for requesting and receiving writing assistance from HelpWriting.net:
1. Create an account with a password and email.
2. Complete a 10-minute order form providing instructions, sources, deadline, and attaching a sample if wanting the writer to mimic your style.
3. Review bids from writers and choose one based on qualifications, history, and feedback, then pay a deposit to start the assignment.
4. Review the completed paper and authorize final payment if satisfied, or request revisions using the free revision policy.
012 How To Write An Introduction Paragraph For Essay Example ThatStephen Faucher
The document provides instructions for creating an account and submitting a paper writing request on the HelpWriting.net website. It outlines a 5-step process: 1) Create an account with an email and password. 2) Complete an order form with instructions, sources, and deadline. 3) Review bids from writers and select one. 4) Review the completed paper and authorize payment. 5) Request revisions until satisfied. The purpose is to guide users through obtaining writing help services from the site.
1. The document describes the steps to request a paper writing service from HelpWriting.net, including creating an account, submitting a request form, reviewing writer bids, and revising the paper if needed.
2. It then provides instructions on how to analyze capsicum content in peppers using HPLC, including preparing pepper samples, running a gradient elution, and quantifying capsaisin levels in habanero, jalapeno, and bell peppers.
3. The analysis found habanero had the highest capsaisin level followed by jalapeno and then bell pepper, consistent with their relative spiciness.
The document provides instructions for requesting writing assistance from HelpWriting.net. It outlines a 5-step process: 1) Create an account with a password and email. 2) Complete a order form with instructions, sources, and deadline. 3) Review bids from writers and choose one. 4) Review the completed paper and authorize payment. 5) Request revisions to ensure satisfaction, with refund available for plagiarized work.
Example Of Reflection Paper About Movie Reflection PStephen Faucher
The document summarizes the key elements of New York's Emergency Operations Plan, including its purpose, scope, assumptions, and organizational structure. The plan is intended to prepare New York City to respond to various emergencies and disasters as required by state law. It acknowledges that the city may request assistance from other districts, cities, or the state if needed. The plan also defines the roles and responsibilities of different city agencies in an emergency response.
The document summarizes the founding and objectives of the UK's National Health Service (NHS). It notes that the NHS was established in 1948 to provide free healthcare accessible to all British citizens. The NHS aims to support people living longer, healthier lives through high-quality and compassionate healthcare services that are constantly improving. Its objectives are focused on quality, finances, operational performance, strategic change and leadership.
The document provides steps for using a writing service called HelpWriting.net. It outlines the 5-step process: 1) Create an account with a password and email. 2) Complete a 10-minute order form providing instructions, sources, and deadline. 3) Review bids from writers and choose one based on qualifications. 4) Review the completed paper and authorize payment if satisfied. 5) Request revisions to ensure satisfaction, and the company offers refunds for plagiarized work.
Personalized Letter Writing Sheets Floral Personalized Stationery SetStephen Faucher
The document discusses the process for requesting writing assistance from the HelpWriting.net website. It outlines 5 steps: 1) Create an account with a password and email. 2) Complete a 10-minute order form providing instructions, sources, and deadline. 3) Review bids from writers and choose one based on qualifications. 4) Receive the paper and ensure it meets expectations, then pay the writer. 5) Request revisions until fully satisfied, with a refund option for plagiarized work. The service aims to provide original, high-quality content through this process.
The document provides instructions for using the website HelpWriting.net to get help writing essays. It outlines a 5 step process: 1) Create an account, 2) Complete an order form providing instructions and deadline, 3) Review bids from writers and select one, 4) Review the completed paper and authorize payment, 5) Request revisions to ensure satisfaction and get a refund if plagiarized. The website aims to provide original, high-quality content and stand by its promises to fully meet customer needs.
Introduction to AI for Nonprofits with Tapp NetworkTechSoup
Dive into the world of AI! Experts Jon Hill and Tareq Monaur will guide you through AI's role in enhancing nonprofit websites and basic marketing strategies, making it easy to understand and apply.
The simplified electron and muon model, Oscillating Spacetime: The Foundation...RitikBhardwaj56
Discover the Simplified Electron and Muon Model: A New Wave-Based Approach to Understanding Particles delves into a groundbreaking theory that presents electrons and muons as rotating soliton waves within oscillating spacetime. Geared towards students, researchers, and science buffs, this book breaks down complex ideas into simple explanations. It covers topics such as electron waves, temporal dynamics, and the implications of this model on particle physics. With clear illustrations and easy-to-follow explanations, readers will gain a new outlook on the universe's fundamental nature.
A Strategic Approach: GenAI in EducationPeter Windle
Artificial Intelligence (AI) technologies such as Generative AI, Image Generators and Large Language Models have had a dramatic impact on teaching, learning and assessment over the past 18 months. The most immediate threat AI posed was to Academic Integrity with Higher Education Institutes (HEIs) focusing their efforts on combating the use of GenAI in assessment. Guidelines were developed for staff and students, policies put in place too. Innovative educators have forged paths in the use of Generative AI for teaching, learning and assessments leading to pockets of transformation springing up across HEIs, often with little or no top-down guidance, support or direction.
This Gasta posits a strategic approach to integrating AI into HEIs to prepare staff, students and the curriculum for an evolving world and workplace. We will highlight the advantages of working with these technologies beyond the realm of teaching, learning and assessment by considering prompt engineering skills, industry impact, curriculum changes, and the need for staff upskilling. In contrast, not engaging strategically with Generative AI poses risks, including falling behind peers, missed opportunities and failing to ensure our graduates remain employable. The rapid evolution of AI technologies necessitates a proactive and strategic approach if we are to remain relevant.
How to Add Chatter in the odoo 17 ERP ModuleCeline George
In Odoo, the chatter is like a chat tool that helps you work together on records. You can leave notes and track things, making it easier to talk with your team and partners. Inside chatter, all communication history, activity, and changes will be displayed.
This presentation was provided by Steph Pollock of The American Psychological Association’s Journals Program, and Damita Snow, of The American Society of Civil Engineers (ASCE), for the initial session of NISO's 2024 Training Series "DEIA in the Scholarly Landscape." Session One: 'Setting Expectations: a DEIA Primer,' was held June 6, 2024.
it describes the bony anatomy including the femoral head , acetabulum, labrum . also discusses the capsule , ligaments . muscle that act on the hip joint and the range of motion are outlined. factors affecting hip joint stability and weight transmission through the joint are summarized.
This slide is special for master students (MIBS & MIFB) in UUM. Also useful for readers who are interested in the topic of contemporary Islamic banking.
Macroeconomics- Movie Location
This will be used as part of your Personal Professional Portfolio once graded.
Objective:
Prepare a presentation or a paper using research, basic comparative analysis, data organization and application of economic information. You will make an informed assessment of an economic climate outside of the United States to accomplish an entertainment industry objective.
A workshop hosted by the South African Journal of Science aimed at postgraduate students and early career researchers with little or no experience in writing and publishing journal articles.
Thinking of getting a dog? Be aware that breeds like Pit Bulls, Rottweilers, and German Shepherds can be loyal and dangerous. Proper training and socialization are crucial to preventing aggressive behaviors. Ensure safety by understanding their needs and always supervising interactions. Stay safe, and enjoy your furry friends!
বাংলাদেশের অর্থনৈতিক সমীক্ষা ২০২৪ [Bangladesh Economic Review 2024 Bangla.pdf] কম্পিউটার , ট্যাব ও স্মার্ট ফোন ভার্সন সহ সম্পূর্ণ বাংলা ই-বুক বা pdf বই " সুচিপত্র ...বুকমার্ক মেনু 🔖 ও হাইপার লিংক মেনু 📝👆 যুক্ত ..
আমাদের সবার জন্য খুব খুব গুরুত্বপূর্ণ একটি বই ..বিসিএস, ব্যাংক, ইউনিভার্সিটি ভর্তি ও যে কোন প্রতিযোগিতা মূলক পরীক্ষার জন্য এর খুব ইম্পরট্যান্ট একটি বিষয় ...তাছাড়া বাংলাদেশের সাম্প্রতিক যে কোন ডাটা বা তথ্য এই বইতে পাবেন ...
তাই একজন নাগরিক হিসাবে এই তথ্য গুলো আপনার জানা প্রয়োজন ...।
বিসিএস ও ব্যাংক এর লিখিত পরীক্ষা ...+এছাড়া মাধ্যমিক ও উচ্চমাধ্যমিকের স্টুডেন্টদের জন্য অনেক কাজে আসবে ...
বাংলাদেশ অর্থনৈতিক সমীক্ষা (Economic Review) ২০২৪ UJS App.pdf
A Note On Exact Tests Of Hardy-Weinberg Equilibrium
1. Am. J. Hum. Genet. 76:887–883, 2005
887
Report
A Note on Exact Tests of Hardy-Weinberg Equilibrium
Janis E. Wigginton,1
David J. Cutler,2
and Gonçalo R. Abecasis1
1
Center for Statistical Genetics, Department of Biostatistics, University of Michigan, Ann Arbor; and 2
Institute of Genetic Medicine, Johns
Hopkins University School of Medicine, Baltimore
Deviations from Hardy-Weinberg equilibrium (HWE) can indicate inbreeding, population stratification, and even
problems in genotyping. In samples of affected individuals, these deviations can also provide evidence for association.
Tests of HWE are commonly performed using a simple x2
goodness-of-fit test. We show that this x2
test can have
inflated type I error rates, even in relatively large samples (e.g., samples of 1,000 individuals that include ∼100
copies of the minor allele). On the basis of previous work, we describe exact tests of HWE together with efficient
computational methods for their implementation. Our methods adequately control type I error in large and small
samples and are computationally efficient. They have been implemented in freely available code that will be useful
for quality assessment of genotype data and for the detection of genetic association or population stratification in
very large data sets.
In the absence of migration, mutation, natural selection,
and assortative mating, genotype frequencies at any lo-
cus are a simple function of allele frequencies. This phe-
nomenon, now termed “Hardy-Weinberg equilibrium”
(HWE), was first described in the early part of the twen-
tieth century (Hardy 1908; Weinberg 1908). The orig-
inal descriptions of HWE are an important landmark in
the history of population genetics (Crow 1988), and it
is now common practice to check whether observed
genotypes conform to Hardy-Weinberg expectations.
These expectations appear to hold for most human pop-
ulations, and deviations from HWE at particular mark-
ers may suggest problems with genotyping or population
structure or, in samples of affected individuals, an as-
sociation between the marker and disease susceptibility.
Here, we describe efficient implementations of exact
tests for HWE, which are suitable for use in large-scale
studies of SNP data, even when hundreds of thousands
of markers are examined. The availability of data on
patterns of linkage disequilibrium across the genome
(International HapMap Consortium 2003), interest in
identifying susceptibility alleles for complex diseases
Received November 18, 2004; accepted for publication February
22, 2005; electronically published March 23, 2005.
Address for correspondence and reprints: Dr. Janis E. Wigginton,
Department of Biostatistics, School of Public Health, University of
Michigan, Ann Arbor, MI 48109. E-mail: goncalo@umich.edu
䉷 2005 by The American Society of Human Genetics. All rights reserved.
0002-9297/2005/7605-0017$15.00
(Cardon and Abecasis 2003), and advances in genotyp-
ing technology (Kwok 2001; Weber and Broman 2001)
suggest that such large studies will be increasingly com-
mon. The principles and procedures used for testing
HWE are well established (Levene 1949; Haldane 1954;
Hernandez and Weir 1989; Wellek 2004), but the lack
of a publicly available, efficient, and reliable implemen-
tation for exact tests has led many scientists to rely on
asymptotic tests that can perform poorly with realistic
sample sizes.
Consider a sample of SNP genotypes for N unrelated
diploid individuals measured at an autosomal locus. The
sample includes 2N alleles, including copies of the
nA
rarer allele and copies of the common allele. Let the
nB
number of heterozygous AB genotypes be , and note
nAB
that the numbers of AA and BB homozygous genotypes
are and . Note
n p (n ⫺ n ) / 2 n p (n ⫺ n ) / 2
AA A AB BB B AB
that there are possible arrangements for
(2N)! / n !n !
A B
the alleles in the sample and that nAB
2 N!/(n !n !n !)
AA AB BB
of these arrangements correspond to exactly het-
nAB
erozygotes. Thus, under the assumption of HWE, the
probability of observing exactly heterozygotes in a
nAB
sample of N individuals with minor alleles is
nA
nAB
2 N! n !n !
A B
P(N p n FN, n ) p # . (1)
AB AB A
( )
n !n !n ! 2N !
AA AB BB
This equation holds for each possible number of het-
erozygotes, . When is odd, possible numbers of
n n
AB A
2. 888 Am. J. Hum. Genet. 76:887–883, 2005
heterozygotes are 1, 3, 5,…, . When is even, pos-
n n
A A
sible numbers of heterozygotes are 0, 2, 4,…, . The
nA
expression for given in equation (1) leads
P(n FN,n )
AB A
to natural tests for HWE. For example, one could
define one-sided tests that focus on detection of a de-
ficit of heterozygotes, by calculating the statistic P p
low
, or detection of an excess of heter-
P(N ⭐ n FN,n )
AB AB A
ozygotes, by calculating the statistic P p P(N ⭓
high AB
. In each case, the statistic can be calculated
n FN,n )
AB A
by simply summing over equation (1), to include all pos-
sible values of that are lower (for ) or higher (for
N P
AB low
) than those observed in the actual data. A test for
Phigh
a deficit of heterozygotes in relation to Hardy-Weinberg
expectations is appropriate when deviations from HWE
due to inbreeding or population stratification are sus-
pected, since both of these increase the proportion of
homozygotes in the population. A test for an excess
of heterozygotes is appropriate when one suspects prob-
lems in genotyping due to the existence of highly ho-
mologous regions in the genome, since these low-copy
repeats often lead to an increase in the proportion of
apparent heterozygotes in the sample. In other settings,
it might be appropriate to use both tests. For example,
many technologies score genotypes by clustering signals,
and misspecified clusters can result in either vast excesses
or vast deficits of heterozygotes.
When neither an increase nor a decrease in the pro-
portion of heterozygotes is specifically expected, one
could perform two separate one-sided tests or, instead,
use a two-sided test statistic (Weir 1996). A natural
two-sided test statistic could be defined as P p
2a
. This two-sided statistic is appeal-
min (1.0, 2P , 2P )
high low
ing because it leads to rejection of HWE at significance
level 2a in instances in which the one-sided tests lead to
the rejection of HWE at significance level a. However,
because of the asymmetric nature of the distribution of
heterozygote counts in a sample, the statistic is quite
conservative in practice, and we do not recommend
its use. Instead, an appealing approach, analogous to
Fisher’s exact test for contingency tables (Fisher 1934),
is to calculate the probability of observing a sample con-
figuration that is even less likely than the one being eval-
uated, conditional on the observed allele counts. This
can be achieved using a statistic similar to the Monte
Carlo statistic proposed by Guo and Thompson (1992)
for multiallelic markers:
P p I P(N p n FN,n )
[
冘
HWE AB AB A
∗
nAB
∗
⭓ P(N p n FN,n ) ]
AB AB A
∗
#P(N p n FN,n ) .
AB AB A
In this definition, I[x] is an indicator function that is
equal to 1 when the comparison is true and equal to 0
otherwise. The sum should be performed over all het-
erozygote counts that are compatible with the ob-
∗
nAB
served number of minor alleles, .
nA
Most of the computational effort required for per-
forming exact tests of linkage disequilibrium is spent
evaluating the factorials in equation (1) for each possible
value of . By use of a naive approach, evaluating
nAB
equation (1) requires 5N–6N multiplications and one
division for each possible value of . We simplify cal-
nAB
culations by using the recurrence relationships previ-
ously recognized by Guo and Thompson (1992) in the
implementation of their Markov chain–Monte Carlo
sampler:
P(N p n ⫹ 2FN, n )
AB AB A
4n n
AA BB
p P(N p n FN, n ) , and
AB AB A
(n ⫹ 2)(n ⫹ 1)
AB AB
P(N p n ⫺ 2FN, n )
AB AB A
n (n ⫺ 1)
AB AB
p P(N p n FN, n ) . (2)
AB AB A
4(n ⫹ 1)(n ⫹ 1)
AA BB
In this way, evaluating the probability for each possible
number of heterozygotes takes only four multiplications
and one division, whatever the sample size N. To avoid
underflow, it is best to first calculate the probability of
observing the expected number of heterozygotes (in this
case, the most likely outcome) and then use the recur-
rence relationships to calculate probabilities for all other
outcomes. A further reduction of computational effort
is possible by noting that one need only calculate relative
probabilities for each outcome and then scale these to
ensure that their sum is 1.0. This means that the prob-
ability of observing the expected number of heterozy-
gotes can be replaced with an arbitrary constant when
using the recurrence relations in equation (2), provided
that the final result is scaled.
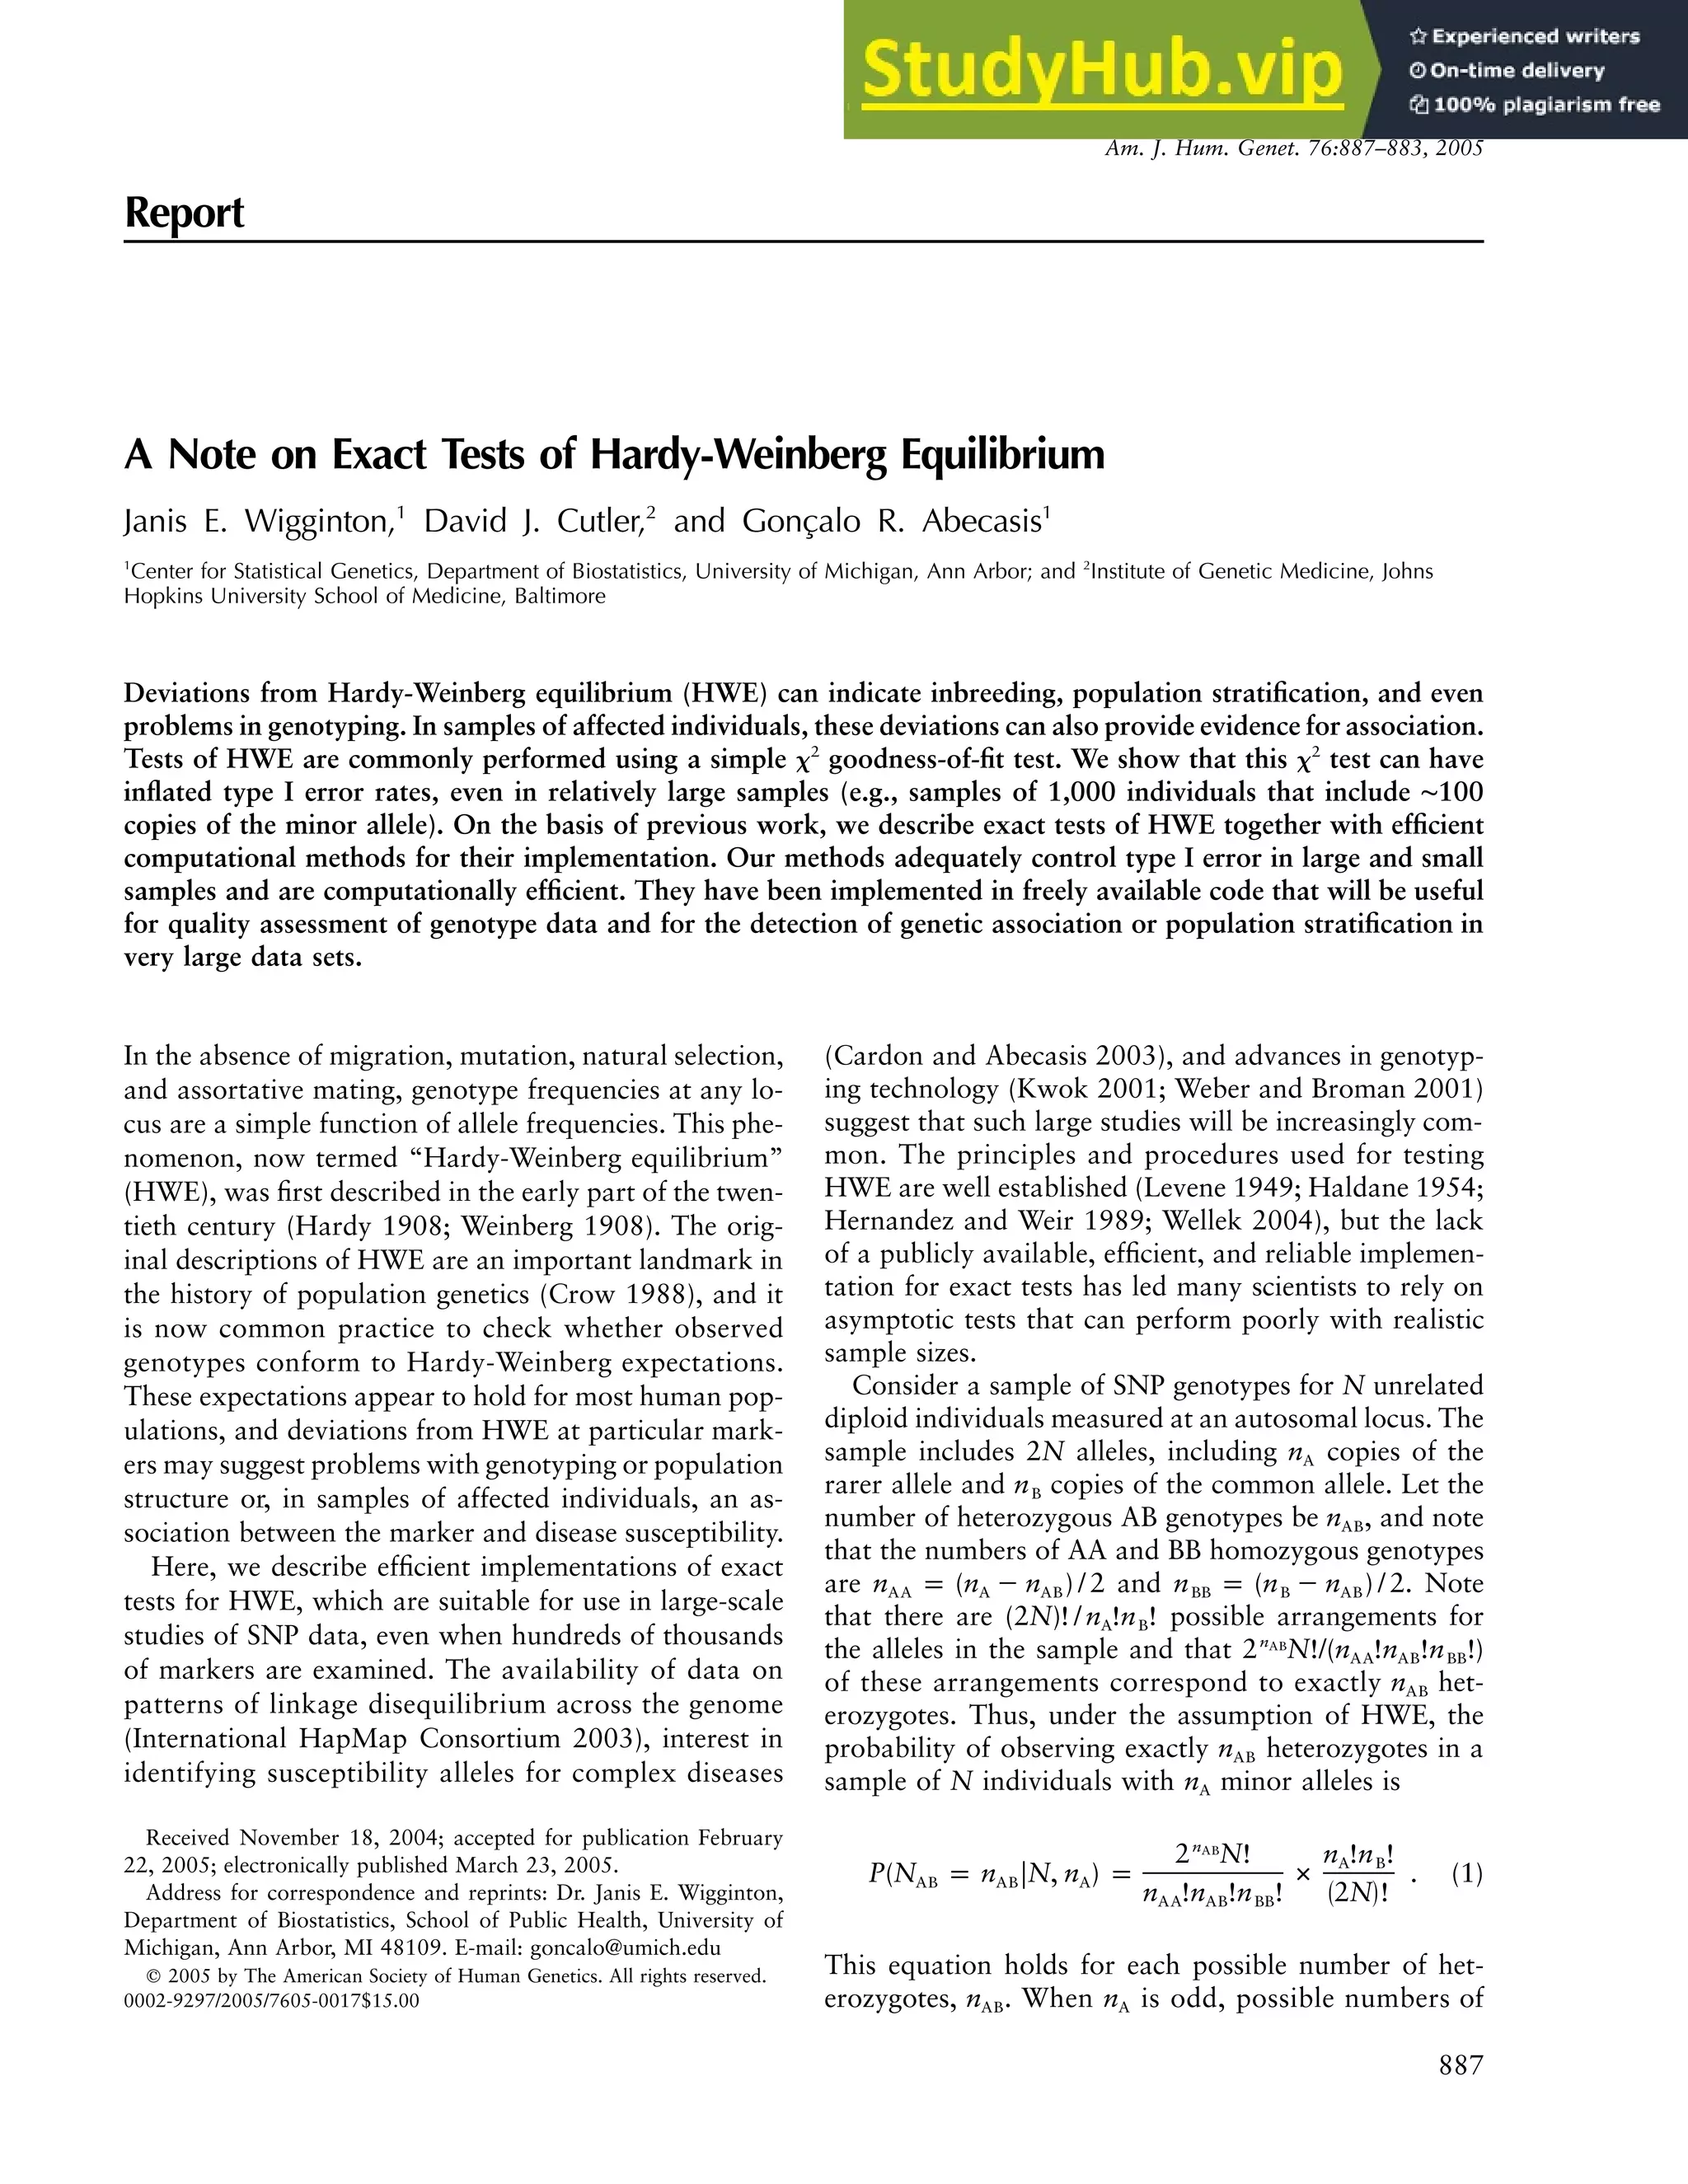
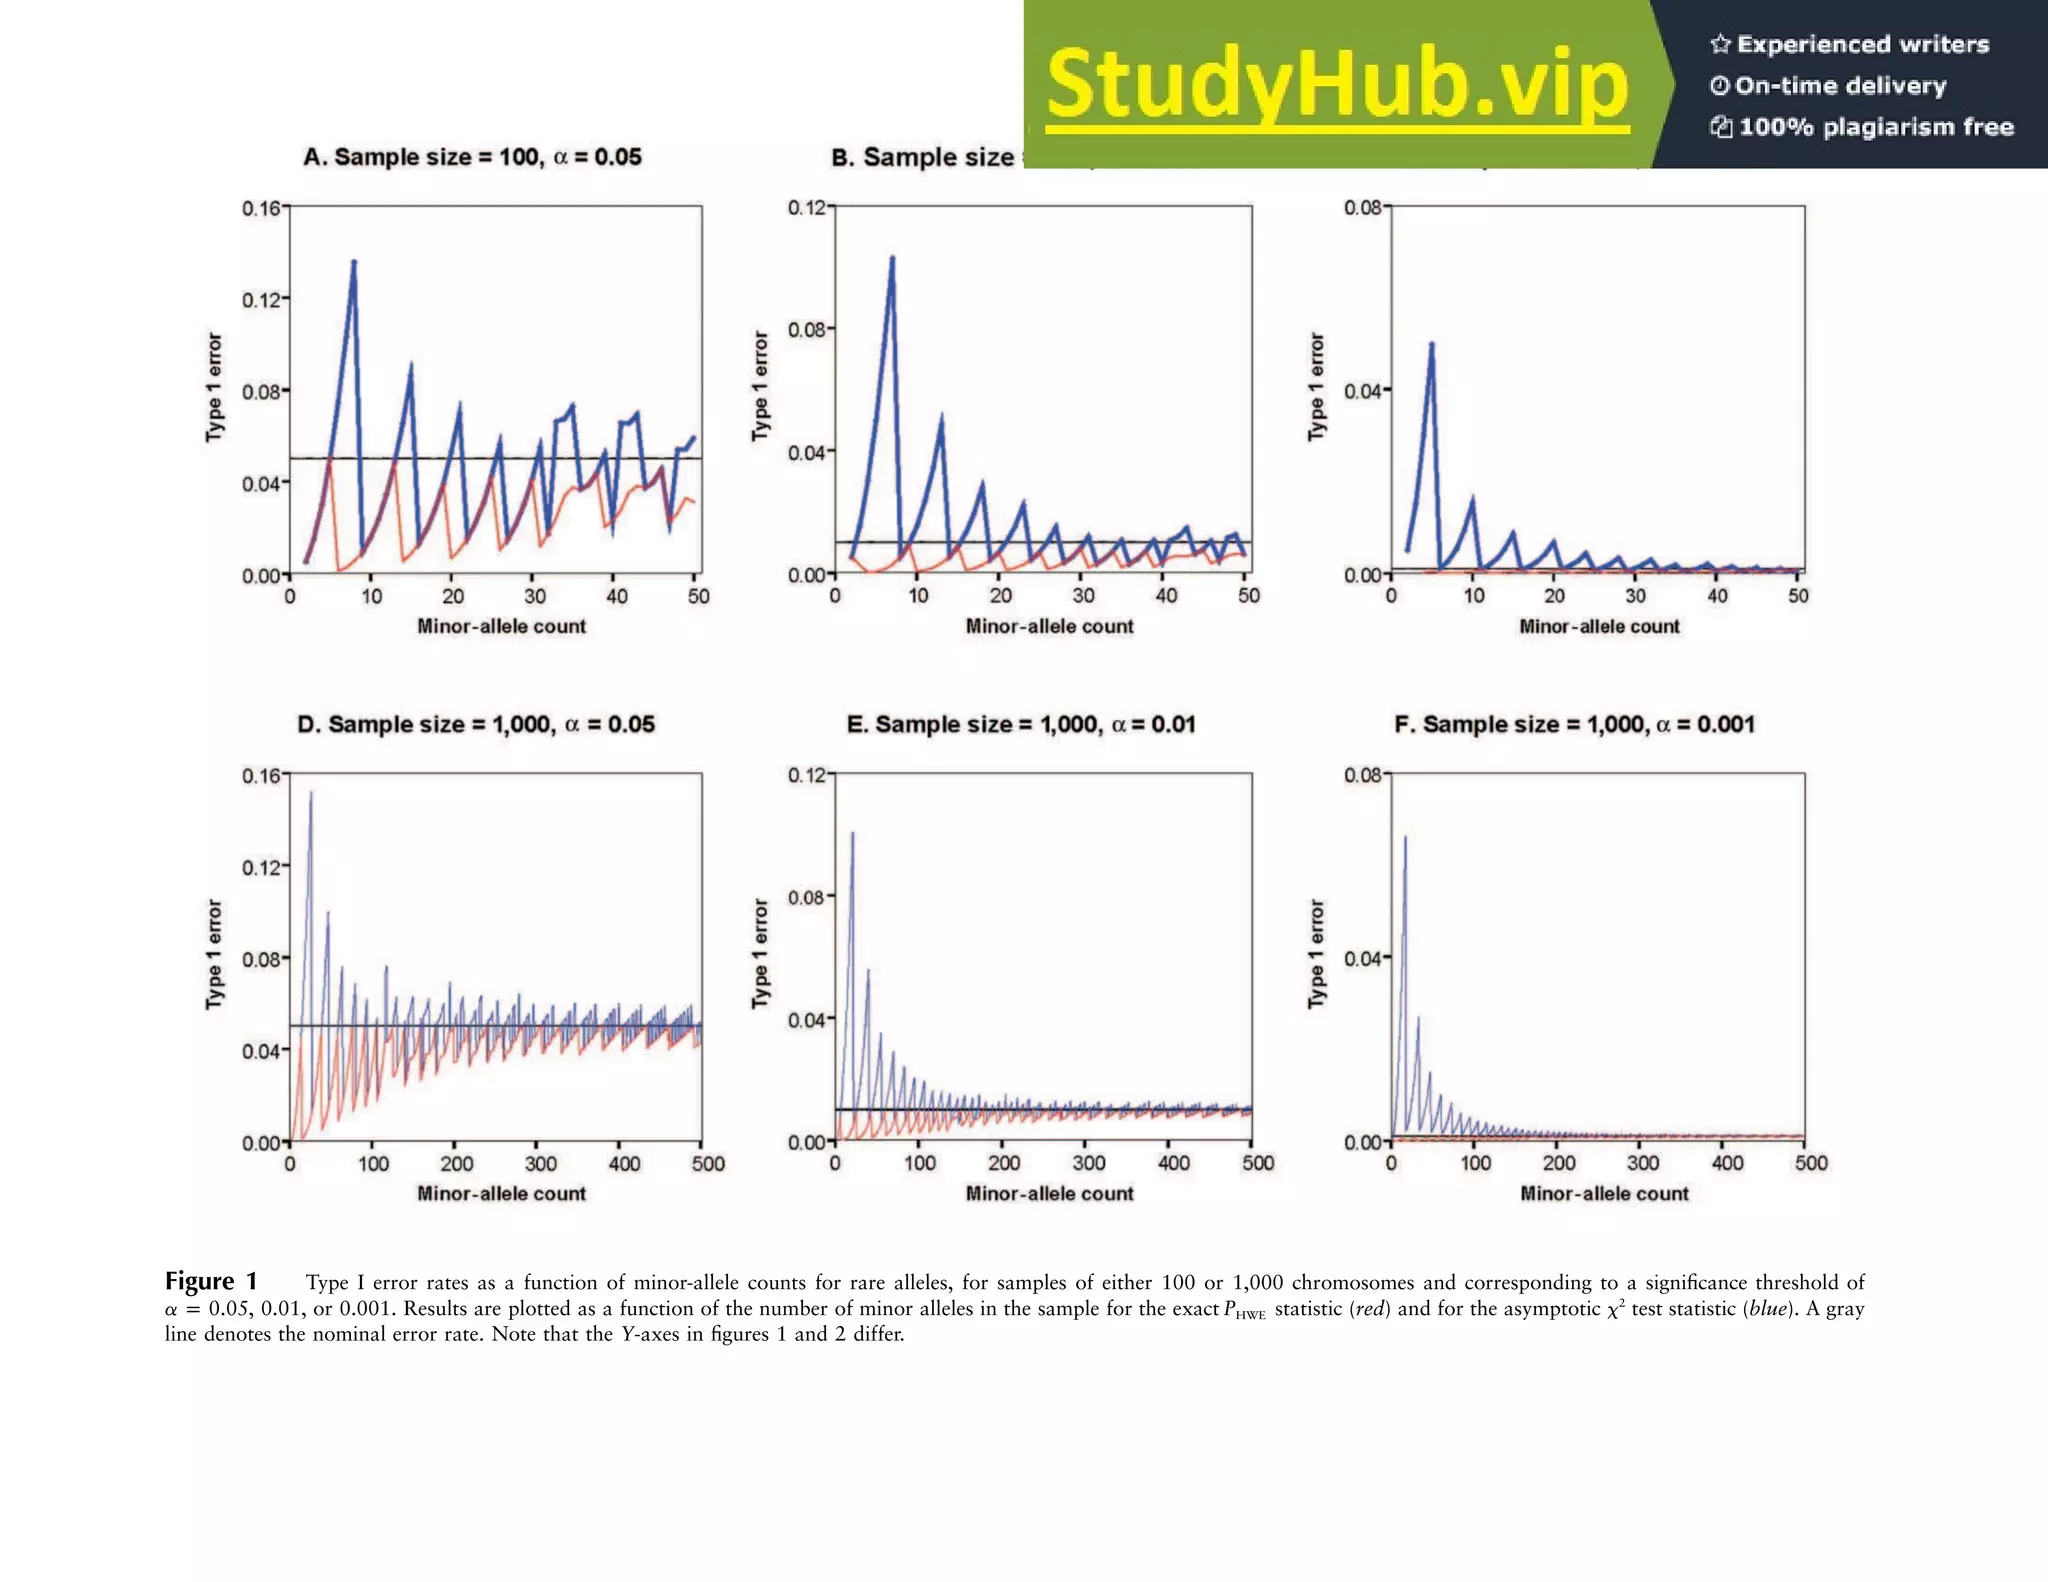
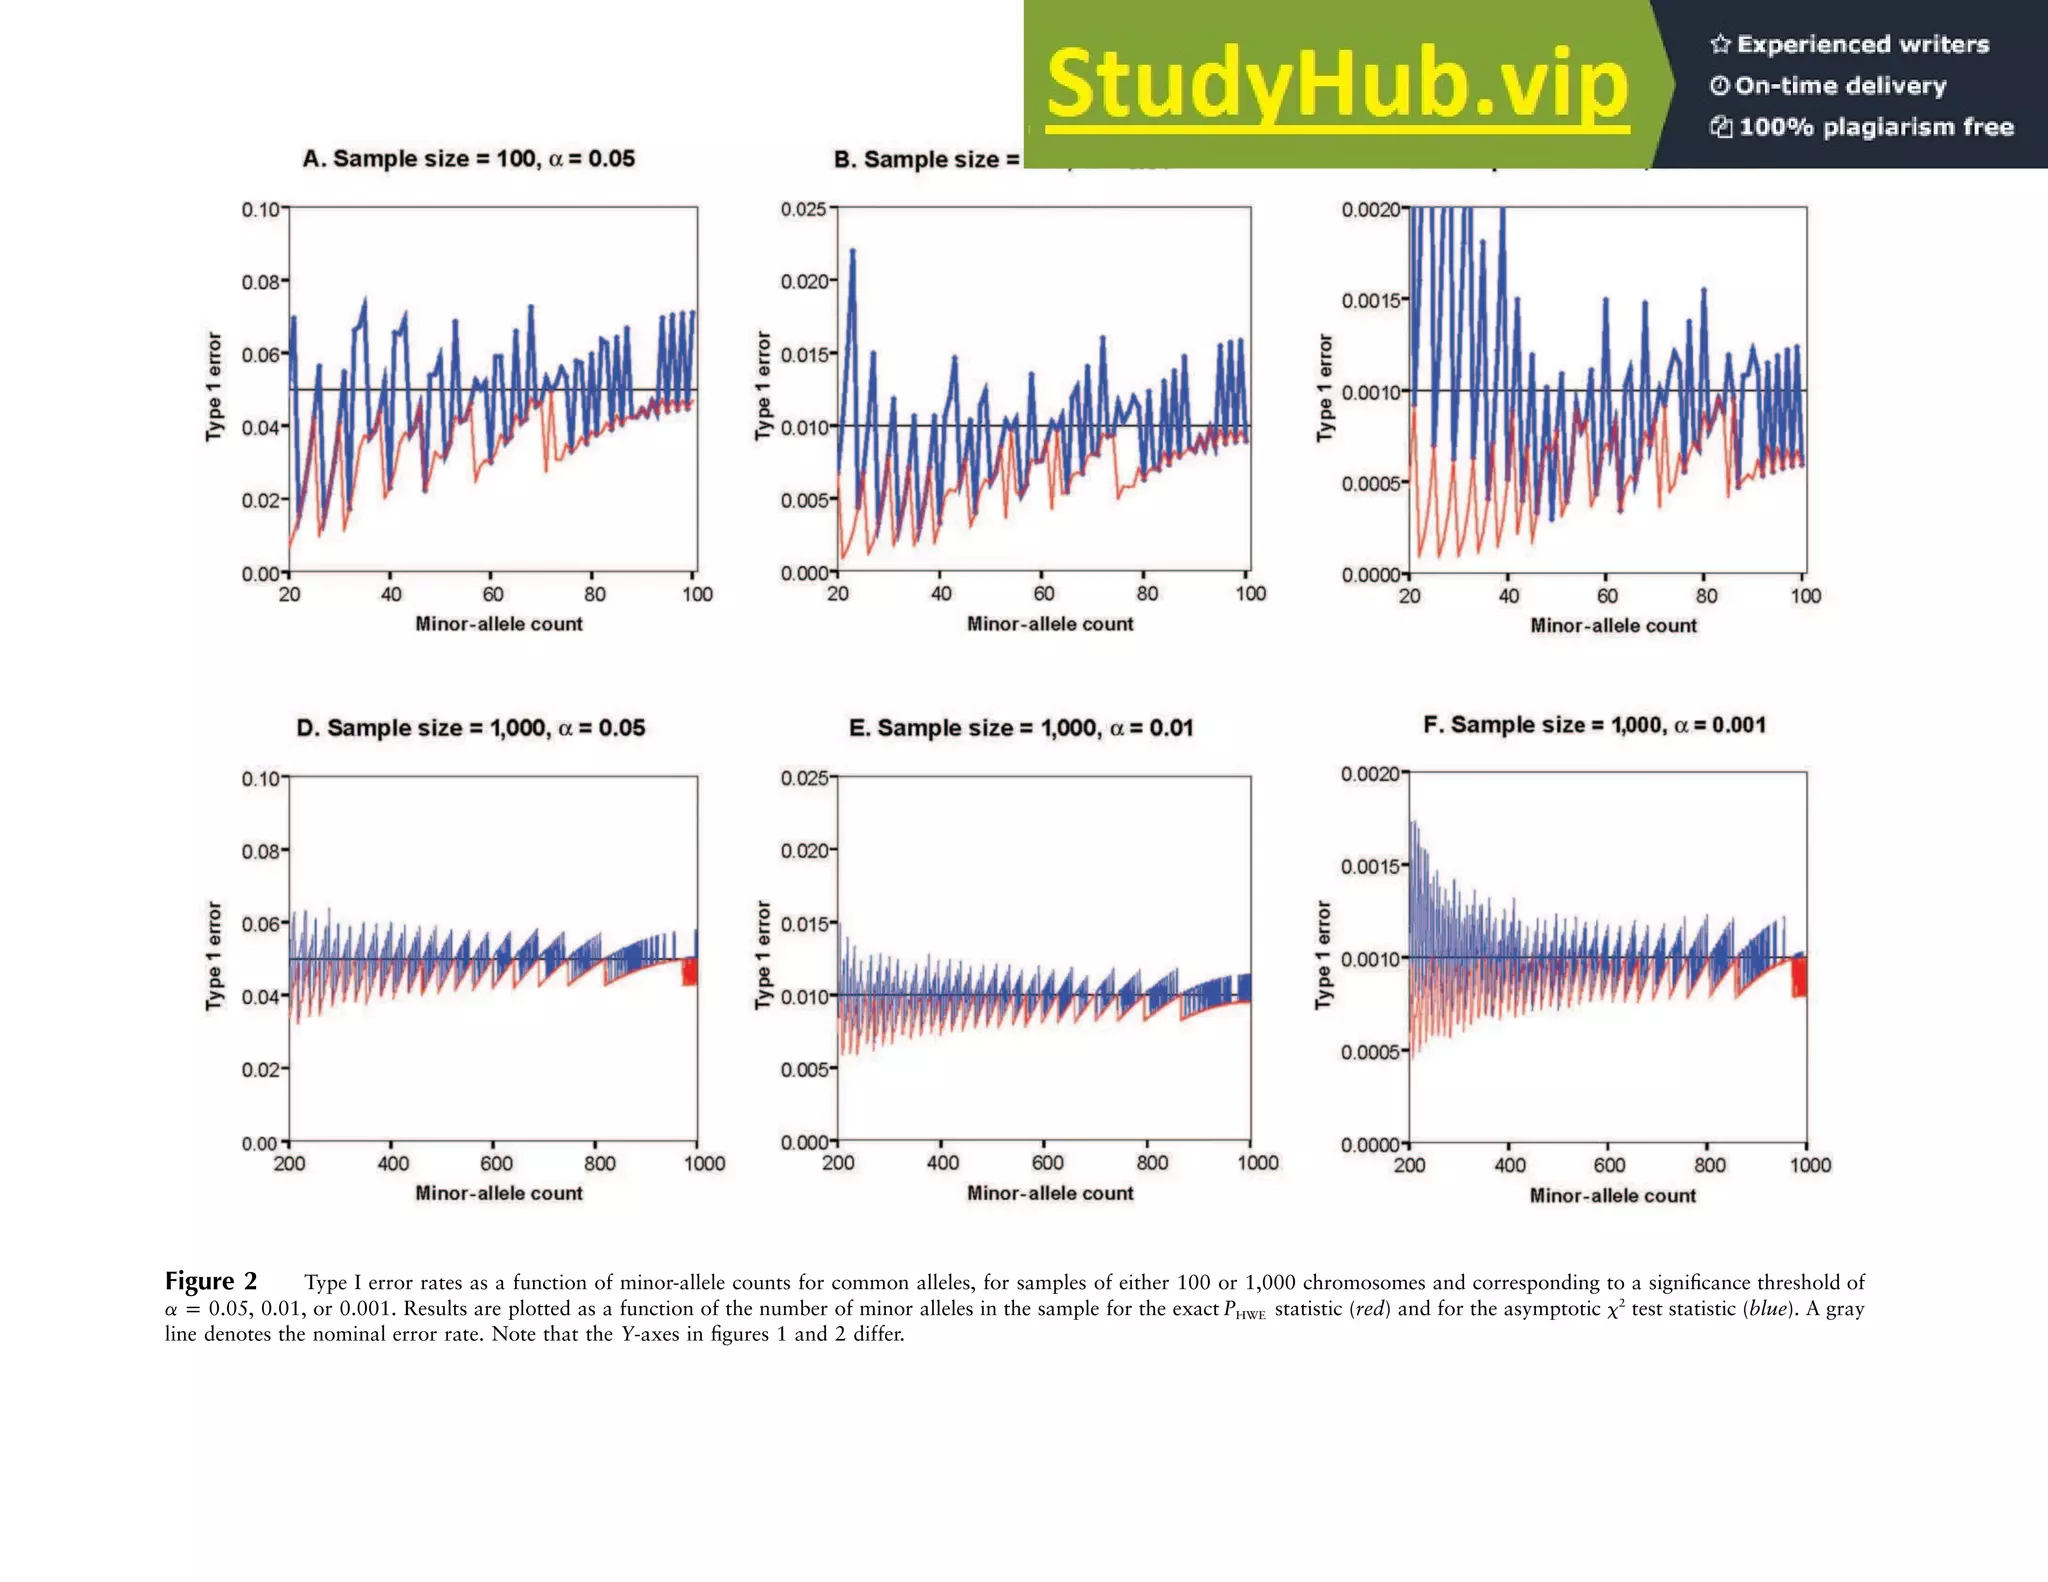
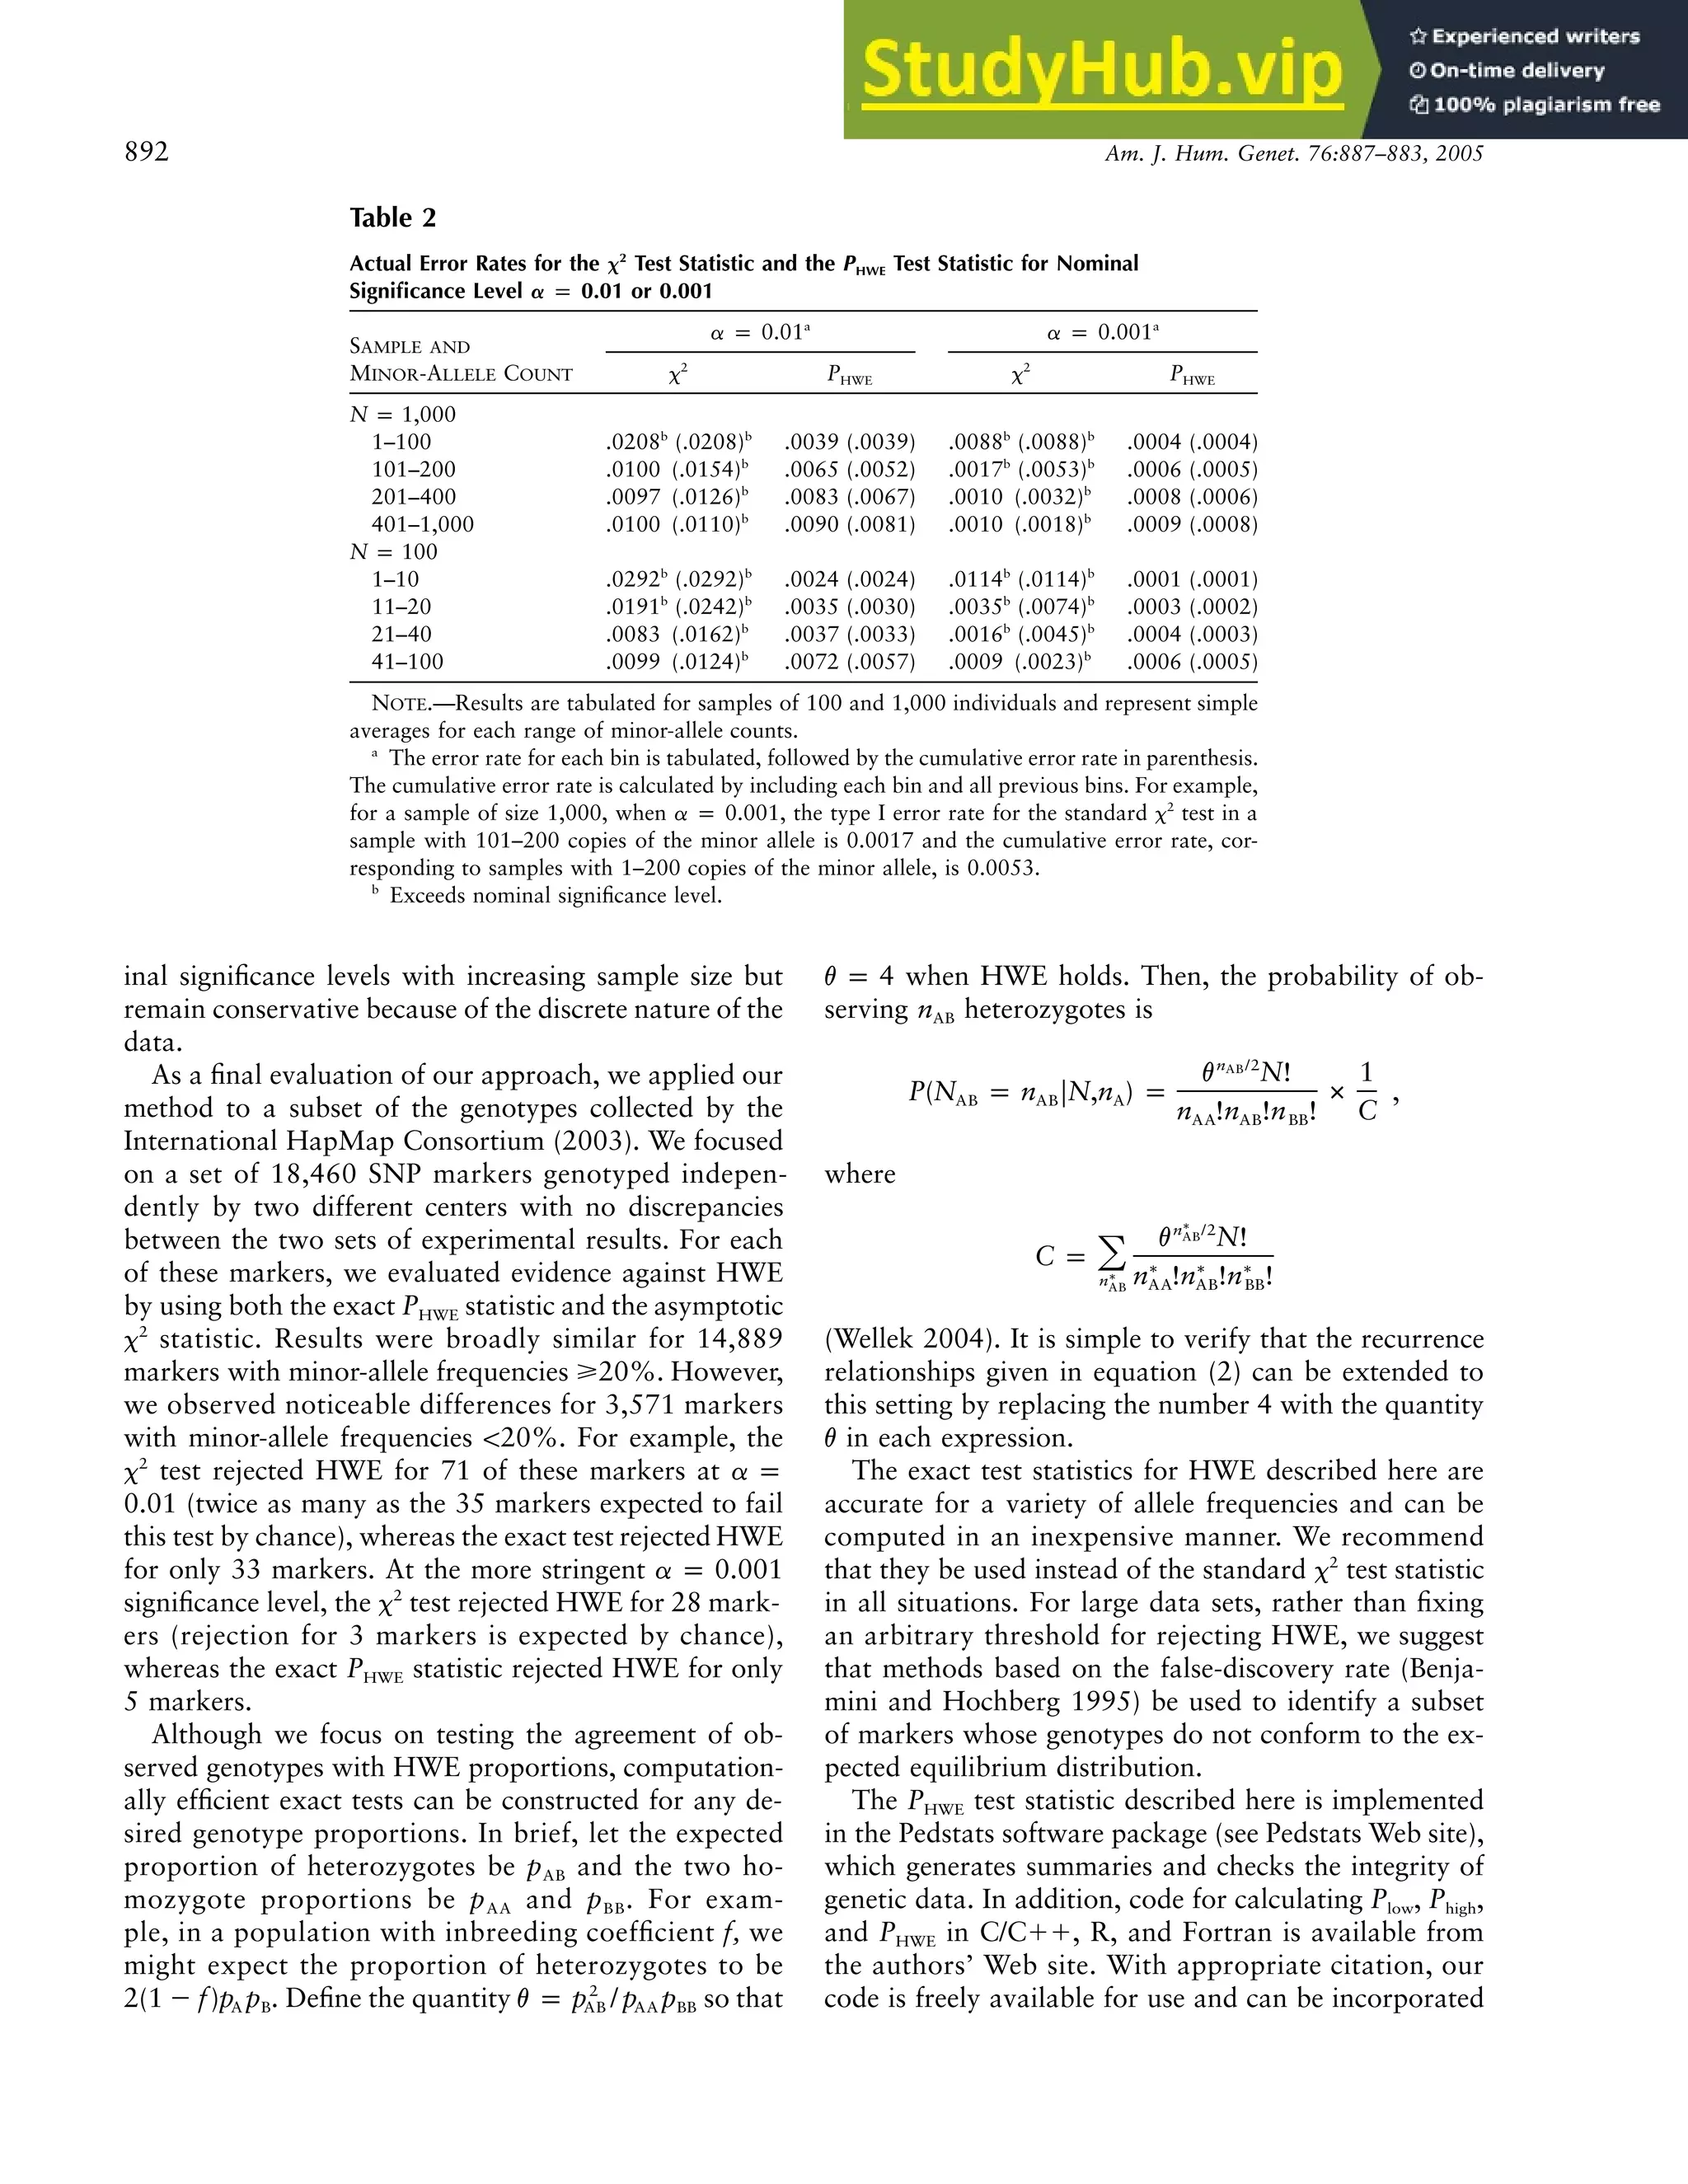
Table 1 illustrates the performance of the statistics for
a sample of 100 individuals in which 21 copies of the
minor allele are present. The observed number of het-
erozygotes will vary from 1 to 21 and must be odd. Note
that only a small number of distinct sample configura-
tions are possible, and each of these is associated with
a specific probability for the exact tests. If the desired
significance level a does not correspond exactly to one
of these discrete outcomes, then the exact test statistics
will be conservative (Hernandez and Weir 1989). For
example, at the significance level , the PHWE and
a p 0.05
Plow statistics both reject the hypothesis of HWE if ⭐13
heterozygotes are observed in this setting. Since the prob-
ability of observing ⭐13 heterozygotes is 0.010, the tests
are conservative. In contrast, the asymptotic x2
test sta-
tistic results in rejection of HWE when ⭐15 heterozy-
3. Figure 1 Type I error rates as a function of minor-allele counts for rare alleles, for samples of either 100 or 1,000 chromosomes and corresponding to a significance threshold of
, 0.01, or 0.001. Results are plotted as a function of the number of minor alleles in the sample for the exact statistic (red) and for the asymptotic x2
test statistic (blue). A gray
a p 0.05 PHWE
line denotes the nominal error rate. Note that the Y-axes in figures 1 and 2 differ.
4. 890 Am. J. Hum. Genet. 76:887–883, 2005
Table 1
Possible Sample Configurations and Their Probabilities for a Sample of 100
Individuals and 21 Minor-Allele Copies Are Tabulated
NO. OF
HETEROZYGOTES
(nAB) PROBABILITY
a
x2
TEST P
EXACT TEST P VALUES
PHWE Phigh Plow
5 !.000001 !.000001b
!.000001b
1.000000 !.000001b
7 .000001 !.000001b
.000001b
1.000000 .000001b
9 .000047 !.000001b
.000048b
.999999 .000048b
11 .000870 .000039b
.000919b
.999952 .000919b
13 .009375 .002228b
.010293b
.999081 .010293b
15 .059283 .045180b
.069576 .989707 .069576
17 .214465 .342972 .284042 .930424 .284042
19 .406355 .906529 1.000000 .715958 .690396
21 .309604 .244336 .593645 .309604 1.000000
NOTE.—The probability of observing each possible outcome is given, together with
the corresponding P values for tests of HWE based on the x2
statistic and on the exact
test statistics PHWE, Plow, and Phigh (described in the main text).
a
.
P(n FN p 100,n p 21)
AB A
b
Configurations that would be rejected at the significance level a p 0.05.
gotes are observed (for ⭐15 heterozygotes, the x2
test
statistic corresponds to an asymptotic ). This
P ⭐ .045
results in an inflated type I error rate of 0.070 and there-
fore is inappropriate. In this sample, it is not possible
to reject HWE because of an excess of heterozygous
individuals—the probability of observing the maximum
of 21 heterozygotes is 0.31, and none of the test statistics
gives a P value !.05 for this extreme configuration. Ad-
ditional examples of the performance of exact test sta-
tistics for HWE can be found in the work by Vithayasai
(1973).
In general, the exact test statistics are conservative
when a small number of minor-allele copies are present
in the sample, but they approximate nominal signifi-
cance levels as the sample size (and number of minor-
allele copies) increases. In contrast, the commonly used
x2
statistic can produce excessively small or large P val-
ues for specific outcomes (Hernandez and Weir 1989).
To comprehensively evaluate the performance of the x2
and exact test statistics, we calculated their type I error
rates for specified significance levels of , 0.01,
a p 0.05
or 0.001, for sample sizes of or
N p 100 N p 1,000
individuals and varying minor-allele counts. The results
are summarized in figure 1 (for samples in which !25%
of chromosomes carry the minor allele) and figure 2 (for
samples in which 110% of chromosomes carry the mi-
nor allele), and it is clear that the statistics exhibit some
periodicity in their type I error rates. As expected, both
the exact PHWE statistic and the x2
statistic perform better
as the sample size and minor-allele counts increase. Nev-
ertheless, one important difference is that the x2
statistic
can sometimes be extremely anticonservative (e.g., in a
sample of 1,000 individuals, when nominal ,
a p 0.001
the true type I error rate can exceed 0.06 and is often
10.01 for minor-allele counts !100), whereas the exact
statistic never exceeds the nominal significance level. In
practical settings, the x2
statistic could lead to many false
rejections of HWE that depend on only the particular
count of minor alleles in the sample.
To understand the periodicity of the statistics, it is
important to consider the discrete nature of the data.
For example, for a sample of individuals in-
N p 100
cluding 2–5 copies of the minor allele, we reject HWE
at the significance level (fig. 1A) when there
a p 0.05
is at least one homozygote for the minor allele. The
probability of observing more than one homozygote for
the minor allele increases gradually from 0.0050 when
there are two copies of the allele in the sample up to
0.0499 when there are five copies of the minor allele in
the sample. When there are 6–14 copies of the minor
allele in the sample, we reject HWE at the a p 0.05
significance level (fig. 1A) when at least two homo-
zygotes for the rare allele are observed. Again, the prob-
ability of a more extreme event is quite low for small
numbers of the rare allele ( with six copies of
P p .0011
the minor allele in the sample) but gradually increases
if there are additional copies of the minor allele in the
sample ( with 13 copies of the minor allele).
P p .0482
In table 2, the overall type I error rates for each sta-
tistic are summarized for sample sizes of 100 or 1,000
individuals and various ranges of minor-allele counts. It
is clear that, on average, the x2
test approximates nom-
inal significance levels as the number of minor alleles in
the sample increases. Nevertheless, as illustrated in figure
1, this is achieved at the cost of inflated error rates for
samples with specific numbers of minor alleles. Even in
a sample of 1,000 individuals, the type I error rate at a
p 0.001 for the x2
test is inflated when there are !200
copies of the minor allele (corresponding to an allele
frequency of ∼10%). The exact tests approximate nom-
5. Figure 2 Type I error rates as a function of minor-allele counts for common alleles, for samples of either 100 or 1,000 chromosomes and corresponding to a significance threshold of
, 0.01, or 0.001. Results are plotted as a function of the number of minor alleles in the sample for the exact statistic (red) and for the asymptotic x2
test statistic (blue). A gray
a p 0.05 PHWE
line denotes the nominal error rate. Note that the Y-axes in figures 1 and 2 differ.
6. 892 Am. J. Hum. Genet. 76:887–883, 2005
Table 2
Actual Error Rates for the x2
Test Statistic and the PHWE Test Statistic for Nominal
Significance Level a p 0.01 or 0.001
SAMPLE AND
MINOR-ALLELE COUNT
a p 0.01a
a p 0.001a
x2
PHWE x2
PHWE
N p 1,000
1–100 .0208b
(.0208)b
.0039 (.0039) .0088b
(.0088)b
.0004 (.0004)
101–200 .0100 (.0154)b
.0065 (.0052) .0017b
(.0053)b
.0006 (.0005)
201–400 .0097 (.0126)b
.0083 (.0067) .0010 (.0032)b
.0008 (.0006)
401–1,000 .0100 (.0110)b
.0090 (.0081) .0010 (.0018)b
.0009 (.0008)
N p 100
1–10 .0292b
(.0292)b
.0024 (.0024) .0114b
(.0114)b
.0001 (.0001)
11–20 .0191b
(.0242)b
.0035 (.0030) .0035b
(.0074)b
.0003 (.0002)
21–40 .0083 (.0162)b
.0037 (.0033) .0016b
(.0045)b
.0004 (.0003)
41–100 .0099 (.0124)b
.0072 (.0057) .0009 (.0023)b
.0006 (.0005)
NOTE.—Results are tabulated for samples of 100 and 1,000 individuals and represent simple
averages for each range of minor-allele counts.
a
The error rate for each bin is tabulated, followed by the cumulative error rate in parenthesis.
The cumulative error rate is calculated by including each bin and all previous bins. For example,
for a sample of size 1,000, when a p 0.001, the type I error rate for the standard x2
test in a
sample with 101–200 copies of the minor allele is 0.0017 and the cumulative error rate, cor-
responding to samples with 1–200 copies of the minor allele, is 0.0053.
b
Exceeds nominal significance level.
inal significance levels with increasing sample size but
remain conservative because of the discrete nature of the
data.
As a final evaluation of our approach, we applied our
method to a subset of the genotypes collected by the
International HapMap Consortium (2003). We focused
on a set of 18,460 SNP markers genotyped indepen-
dently by two different centers with no discrepancies
between the two sets of experimental results. For each
of these markers, we evaluated evidence against HWE
by using both the exact PHWE statistic and the asymptotic
x2
statistic. Results were broadly similar for 14,889
markers with minor-allele frequencies ⭓20%. However,
we observed noticeable differences for 3,571 markers
with minor-allele frequencies !20%. For example, the
x2
test rejected HWE for 71 of these markers at a p
(twice as many as the 35 markers expected to fail
0.01
this test by chance), whereas the exact test rejected HWE
for only 33 markers. At the more stringent a p 0.001
significance level, the x2
test rejected HWE for 28 mark-
ers (rejection for 3 markers is expected by chance),
whereas the exact PHWE statistic rejected HWE for only
5 markers.
Although we focus on testing the agreement of ob-
served genotypes with HWE proportions, computation-
ally efficient exact tests can be constructed for any de-
sired genotype proportions. In brief, let the expected
proportion of heterozygotes be pAB and the two ho-
mozygote proportions be pAA and pBB. For exam-
ple, in a population with inbreeding coefficient f, we
might expect the proportion of heterozygotes to be
. Define the quantity so that
2
2(1 ⫺ f)p p v p p / p p
A B AB AA BB
when HWE holds. Then, the probability of ob-
v p 4
serving nAB heterozygotes is
n /2
AB
v N! 1
P(N p n FN,n ) p # ,
AB AB A
n !n !n ! C
AA AB BB
where
∗
n /2
AB
v N!
C p 冘 ∗ ∗ ∗
∗ n !n !n !
n AA AB BB
AB
(Wellek 2004). It is simple to verify that the recurrence
relationships given in equation (2) can be extended to
this setting by replacing the number 4 with the quantity
v in each expression.
The exact test statistics for HWE described here are
accurate for a variety of allele frequencies and can be
computed in an inexpensive manner. We recommend
that they be used instead of the standard x2
test statistic
in all situations. For large data sets, rather than fixing
an arbitrary threshold for rejecting HWE, we suggest
that methods based on the false-discovery rate (Benja-
mini and Hochberg 1995) be used to identify a subset
of markers whose genotypes do not conform to the ex-
pected equilibrium distribution.
The PHWE test statistic described here is implemented
in the Pedstats software package (see Pedstats Web site),
which generates summaries and checks the integrity of
genetic data. In addition, code for calculating Plow, Phigh,
and PHWE in C/C⫹⫹, R, and Fortran is available from
the authors’ Web site. With appropriate citation, our
code is freely available for use and can be incorporated
7. Reports 893
into other programs. The HapMap Project genotype
data are freely available at the HapMap Web site.
Acknowledgments
We gratefully acknowledge grant support from the National
Human Genome Research Institute and the National Eye In-
stitute. The manuscript was improved by helpful comments
from reviewers.
Electronic-Database Information
The URLs for data presented herein are as follows:
Authors’ Web site, http://www.sph.umich.edu/csg/abecasis/
HapMap, http://www.hapmap.org/
Pedstats, http://www.sph.umich.edu/csg/abecasis/Pedstats/
References
Benjamini Y, Hochberg Y (1995) Controlling the false discov-
ery rate: a practical and powerful approach to multiple test-
ing. J R Stat Soc Ser B 57:289–300
Cardon LR, Abecasis GR (2003) Using haplotype blocks to
map human complex trait loci. Trends Genet 19:135–140
Crow JF (1988) Eighty years ago: the beginnings of population
genetics. Genetics 119:473–476
Fisher RA (1934) Statistical methods for research workers.
Oliver and Boyd, Edinburgh
Guo SW, Thompson EA (1992) Performing the exact test of
Hardy-Weinberg proportion for multiple alleles. Biometrics
48:361–372
Haldane JBS (1954) An exact test for randomness of mating.
J Genet 52:631–635
Hardy HG (1908) Mendelian proportions in a mixed popu-
lation. Science 28:49–50
Hernandez JL, Weir BS (1989) A disequilibrium coefficient
approach to Hardy-Weinberg equilibrium testing. Biomet-
rics 45:53–70
International HapMap Consortium (2003) The International
HapMap Project. Nature 426:789–796
Kwok PY (2001) Methods for genotyping single nucleotide
polymorphisms. Annu Rev Genomics Hum Genet 2:235–
258
Levene H (1949) On a matching problem arising in genetics.
Ann Math Stat 21:91–94
Vithayasai C (1973) Exact critical values of the Hardy-Wein-
berg test statistic for two alleles. Communic Stat 1:229–242
Weber JL, Broman KW (2001) Genotyping for human whole-
genome scans: past, present, and future. Adv Genet 42:77–
96
Weinberg W (1908) On the demonstration of heredity in man.
In: Boyer SH, trans (1963) Papers on human genetics. Pren-
tice Hall, Englewood Cliffs, NJ
Weir BS (1996) Genetic data analysis II. Sinauer Associates,
Sunderland, MA
Wellek S (2004) Tests for establishing compatibility of an
observed genotype distribution with Hardy-Weinberg equi-
librium in the case of a biallelic locus. Biometrics 60:694–
703