Downloaded 87 times

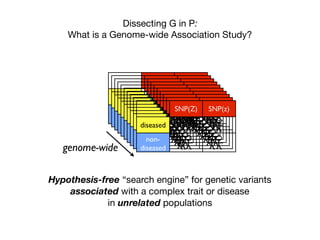

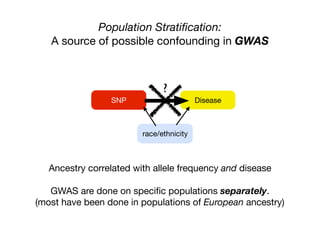
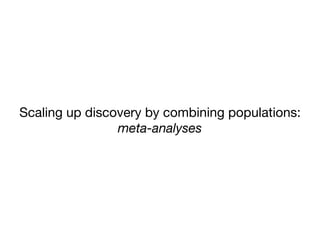
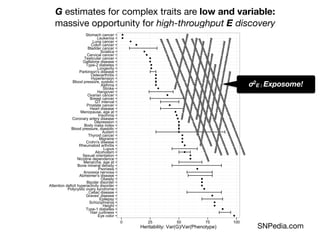
![Can’t measure everything:
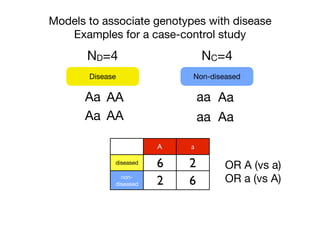
Tag SNPs and Linkage Disequilibrium
Tag SNPs are common proxies for other SNPs
500K - 1M per chip
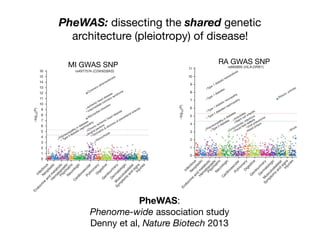
tified significant associations for seven SNPs representing four new
T2DM loci (Table 1). In all cases, the strongest association for the
MAX statistic (see Methods) was obtained with the additive model.
of this gene (Fig. 2a)
solely in the secretory
final stages of insulin
*
*
*
0
2
4
–log10[P]
–log10[P]
*
4954642sr
2373971sr
3373971sr
445409sr
8012261sr
3349941sr
883429sr
2019462sr
0349941sr
90350501sr
036169sr
0415007sr
2225991sr
6136642sr
8136642sr
1869646sr
8798751sr
04928201sr
3926642sr
5926642sr
43666231sr
9926642sr
2954642sr
01350501sr
5769646sr
4577187sr
4769646sr
41350501sr
5784931sr
2173387sr
39250501sr
5050007sr
7492602sr
1255051sr
156868sr
4373387sr
4784931sr
7501107sr
2697402sr
91518711sr
6461001sr
29250501sr
5889103sr
8669646sr
0889103sr
4688392sr
SLC30A8 IDE
0
2
4
7912381sr
3148707sr
0283856sr
52078111sr
5227373sr
0491242sr
2369412sr
2297881sr
662155sr
7790197sr
44068701sr
35075221sr
5826807sr
7851092sr
9409522sr
–log10[P]
–log10[P]
EXT2 ALX4
0
2
4
*** *
0
2
4
a b
c d
LD block
2 alleles are correlated because they are inherited
together
Sladek et al, 2007](https://image.slidesharecdn.com/bmi7011212015-151210222642/85/Intro-to-Biomedical-Informatics-701-16-320.jpg)
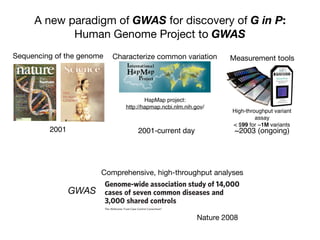
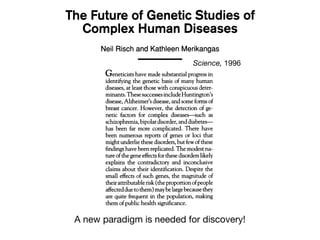
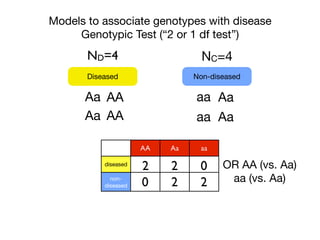
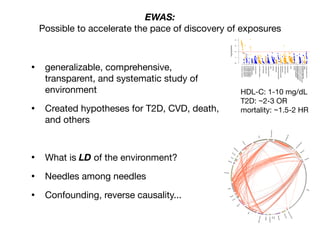
![Associating One SNP with Disease
Calculating the Odds Ratio
DiseaseSNP (A/a)
?
A a
diseased c d
non-
diseased
x y
cases
controls
Chi-squared test
Odds Ratio
dx
cy
y/x
d/c
[d/(d+y)]/[y/(d+y)]
Odds Ratio a vs A:
[c/(x+y)]/[x/(c+x)]
Odds with allele a
Odds with allele A
How would you interpret an OR of 2?](https://image.slidesharecdn.com/bmi7011212015-151210222642/85/Intro-to-Biomedical-Informatics-701-21-320.jpg)
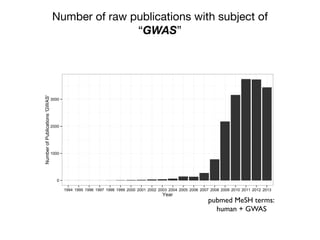
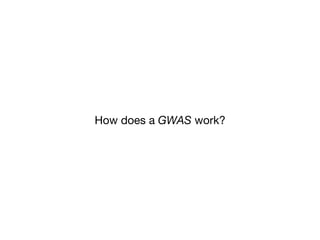
![Human Hap300 chip, showing no T2DM association in stage 1
(P . 0.01) and separated by at least 100 kb. Using the first principal
component as a covariate for ancestry differences between cases and
controls, we tested for association between rs932206 and disease
status. Our result suggests that this apparent association is largely
BMI on the association between marker and disease, as it is asymp-
totically equivalent to the Armitage trend test used to detect asso-
ciation in stages 1 and 2. None of the associations (Supplementary
Table 7) was substantially changed by considering the effects of these
covariates.
5
3
1
5
3
1
5
3
1
5
3
1
5
3
1
15
10
5
5
3
1
5
3
1
5
3
1
5
3
1
5
3
1
5
3
1
5
3
1
5
3
1
5
3
1
5
3
1
5
3
1
5
3
1
5
3
1
5
3
1
5
3
1
5
3
1
5
3
1
1 2 3 4 5
6 7 8 9 10
11 12 13 14 15
16 17 19 20
21 22 X
18
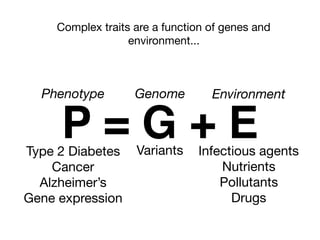
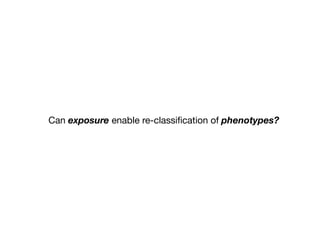
Figure 1 | Graphical summary of stage 1 association results. T2DM
association was determined for SNPs on the Human1 and Hap300 chips. The
x axis represents the chromosome position from pter; the y axis shows
2log10[pMAX], the P-value obtained by the MAX statistic, for each SNP
(Note the different scale on the y axis of the chromosome 10 plot.). SNPs that
passed the cutoff for a fast-tracked second stage are highlighted in red.
882
Nature©2007 Publishing Group Sladek, 2007](https://image.slidesharecdn.com/bmi7011212015-151210222642/85/Intro-to-Biomedical-Informatics-701-44-320.jpg)
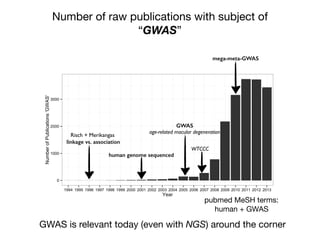
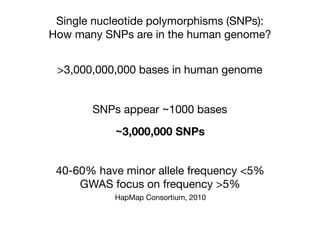
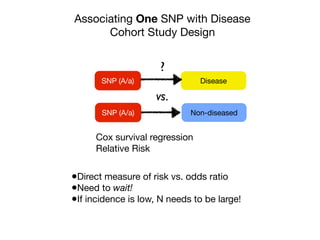
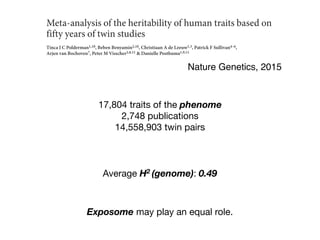
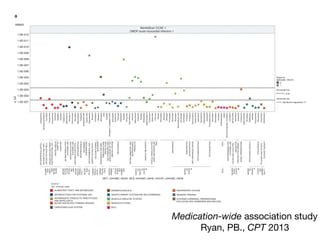
![Identification of four novel T2DM loci
Our fast-track stage 2 genotyping confirmed the reported association
for rs7903146 (TCF7L2) on chromosome 10, and in addition iden-
tified significant associations for seven SNPs representing four new
T2DM loci (Table 1). In all cases, the strongest association for the
MAX statistic (see Methods) was obtained with the additive model.
The most significant of these corresponds to rs13266634, a non-
synonymous SNP (R325W) in SLC30A8, located in a 33-kb linkage
disequilibrium block on chromosome 8, containing only the 39 end
of this gene (Fig. 2a). SLC30A8 encodes a zinc transporter expressed
solely in the secretory vesicles of b-cells and is thus implicated in the
final stages of insulin biosynthesis, which involve co-crystallization
Table 1 | Confirmed association results
SNP Chromosome Position
(nucleotides)
Risk
allele
Major
allele
MAF
(case)
MAF
(ctrl)
Odds ratio
(het)
Odds ratio
(hom)
PAR ls Stage 2
pMAX
Stage 2 pMAX
(perm)
Stage 1
pMAX
Stage 1 pMAX
(perm)
Nearest
gene
rs7903146 10 114,748,339 T C 0.406 0.293 1.65 6 0.19 2.77 6 0.50 0.28 1.0546 1.5 3 10234
,1.0 3 1027
3.2 3 10217
,3.3 3 10210
TCF7L2
rs13266634 8 118,253,964 C C 0.254 0.301 1.18 6 0.25 1.53 6 0.31 0.24 1.0089 6.1 3 1028
5.0 3 1027
2.1 3 1025
1.8 3 1025
SLC30A8
rs1111875 10 94,452,862 G G 0.358 0.402 1.19 6 0.19 1.44 6 0.24 0.19 1.0069 3.0 3 1026
7.4 3 1026
9.1 3 1026
7.3 3 1026
HHEX
rs7923837 10 94,471,897 G G 0.335 0.377 1.22 6 0.21 1.45 6 0.25 0.20 1.0065 7.5 3 1026
2.2 3 1025
3.4 3 1026
2.5 3 1026
HHEX
rs7480010 11 42,203,294 G A 0.336 0.301 1.14 6 0.13 1.40 6 0.25 0.08 1.0041 1.1 3 1024
2.9 3 1024
1.5 3 1025
1.2 3 1025
LOC387761
rs3740878 11 44,214,378 A A 0.240 0.272 1.26 6 0.29 1.46 6 0.33 0.24 1.0046 1.2 3 1024
2.8 3 1024
1.8 3 1025
1.3 3 1025
EXT2
rs11037909 11 44,212,190 T T 0.240 0.271 1.27 6 0.30 1.47 6 0.33 0.25 1.0045 1.8 3 1024
4.5 3 1024
1.8 3 1025
1.3 3 1025
EXT2
rs1113132 11 44,209,979 C C 0.237 0.267 1.15 6 0.27 1.36 6 0.31 0.19 1.0044 3.3 3 1024
8.1 3 1024
3.7 3 1025
2.9 3 1025
EXT2
Significant T2DM associations were confirmed for eight SNPs in five loci. Allele frequencies, odds ratios (with 95% confidence intervals) and PAR were calculated using only the stage 2 data. Allele
frequencies in the controls were very close to those reported for the CEU set (European subjects genotyped in the HapMap project). Induced sibling recurrent risk ratios (ls) were estimated using
stage 2 genotype counts for the control subjects and assuming a T2DM prevalence of 7% in the French population. hom, homozygous; het, heterozygous; major allele, the allele with the higher
frequency in controls; pMAX, P-value of the MAX statistic from the x2
distribution; pMAX (perm), P-value of the MAX statistic from the permutation-derived empirical distribution (pMAX and
pMAX (perm) are adjusted for variance inflation); risk allele, the allele with higher frequency in cases compared with controls.
0
2
4
–log10[P]
–log10[P]
SLC30A8 IDE HHEXKIF11
0
2
4
a b
NATURE|Vol 445|22 February 2007 ARTICLES
Sladek, 2007
5
3
1
5
3
1
15
10
5
1 1 1
5
3
1
5
3
1
5
3
1
5
3
1
5
3
1
5
3
1
5
3
1
3 4 5
8 9 10
13 14 15
19 20
X
18
DM 2log10[pMAX], the P-value obtained by the MAX statistic, for each SNP
How would you interpret the p-
values?
Odds ratios?
Confirmed 8 SNPs with N ~ 1000](https://image.slidesharecdn.com/bmi7011212015-151210222642/85/Intro-to-Biomedical-Informatics-701-45-320.jpg)
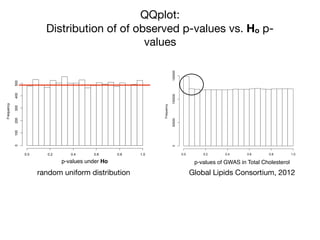
![pporting!Figures!
!
!
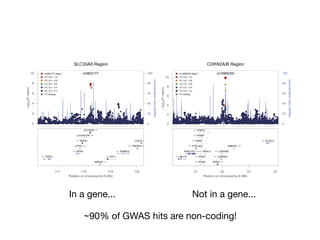
~90% of GWAS hits are non-coding!
Stamatoyannopoulos, Science 2012
Systematic Localization of Common
Disease-Associated Variation in
Regulatory DNA
Matthew T. Maurano,1
* Richard Humbert,1
* Eric Rynes,1
* Robert E. Thurman,1
Eric Haugen,1
Hao Wang,1
Alex P. Reynolds,1
Richard Sandstrom,1
Hongzhu Qu,1,2
Jennifer Brody,3
Anthony Shafer,1
Fidencio Neri,1
Kristen Lee,1
Tanya Kutyavin,1
Sandra Stehling-Sun,1
Audra K. Johnson,1
Theresa K. Canfield,1
Erika Giste,1
Morgan Diegel,1
Daniel Bates,1
R. Scott Hansen,4
Shane Neph,1
Peter J. Sabo,1
Shelly Heimfeld,5
Antony Raubitschek,6
Steven Ziegler,6
Chris Cotsapas,7,8
Nona Sotoodehnia,3,9
Ian Glass,10
Shamil R. Sunyaev,11
Rajinder Kaul,4
John A. Stamatoyannopoulos1,12
†
Genome-wide association studies have identified many noncoding variants associated with common
diseases and traits. We show that these variants are concentrated in regulatory DNA marked by
deoxyribonuclease I (DNase I) hypersensitive sites (DHSs). Eighty-eight percent of such DHSs are active
during fetal development and are enriched in variants associated with gestational exposure–related
phenotypes. We identified distant gene targets for hundreds of variant-containing DHSs that may explain
phenotype associations. Disease-associated variants systematically perturb transcription factor recognition
sequences, frequently alter allelic chromatin states, and form regulatory networks. We also demonstrated
tissue-selective enrichment of more weakly disease-associated variants within DHSs and the de novo
identification of pathogenic cell types for Crohn’s disease, multiple sclerosis, and an electrocardiogram
trait, without prior knowledge of physiological mechanisms. Our results suggest pervasive involvement of
regulatory DNA variation in common human disease and provide pathogenic insights into diverse disorders.
D
isease- and trait-associated genetic variants
are rapidly being identified with genome-
wide association studies (GWAS) and re-
lated strategies (1). To date, hundreds of GWAS
have been conducted, spanning diverse diseases
and quantitative phenotypes (2) (fig. S1A). How-
ever, the majority (~93%) of disease- and trait-
associated variants emerging from these studies
lie within noncoding sequence (fig. S1B), com-
plicating their functional evaluation. Several lines
of evidence suggest the involvement of a propor-
tion of such variants in transcriptional regulatory
mechanisms, including modulation of promoter
and enhancer elements (3–6) and enrichment with-
in expression quantitative trait loci (eQTL) (3, 7, 8).
Human regulatory DNA encompasses a vari-
ety of cis-regulatory elements within which the co-
operative binding of transcription factors creates
focal alterations in chromatin structure. Deoxy-
ribonuclease I (DNase I) hypersensitive sites (DHSs)
are sensitive and precise markers of this actuated
regulatory DNA, and DNase I mapping has been
instrumental in the discovery and census of hu-
man cis-regulatory elements (9). We performed
DNase I mapping genome-wide (10) in 349 cell
and tissue samples, including 85 cell types studied
under the ENCODE Project (10) and 264 sam-
ples studied under the Roadmap Epigenomics
Program (11). These encompass several classes
nome. In total, we identified 3,899,693 distinct
DHS positions along the genome (collectively
spanning 42.2%), each of which was detected in
one or more cell or tissue types (median = 5).
Disease- and trait-associated variants are
concentrated in regulatory DNA. We examined
the distribution of 5654 noncoding genome-wide
significant associations [5134 unique single-
nucleotide polymorphisms (SNPs); fig. S1 and
table S2] for 207 diseases and 447 quantitative
traits (2) with the deep genome-scale maps of
regulatory DNA marked by DHSs. This revealed
a collective 40% enrichment of GWAS SNPs in
DHSs (fig. S1C, P < 10−55
, binomial, compared to
the distribution of HapMap SNPs). Fully 76.6%
of all noncoding GWAS SNPs either lie within a
DHS (57.1%, 2931 SNPs) or are in complete
linkage disequilibrium (LD) with SNPs in a near-
by DHS (19.5%, 999 SNPs) (Fig. 1A) (12). To con-
firm this enrichment, we sampled variants from
the 1000 Genomes Project (13) with the same ge-
nomic feature localization (intronic versus inter-
genic), distance from the nearest transcriptional
start site, and allele frequency in individuals of
European ancestry. We confirmed significant en-
richment both for SNPs within DHSs (P < 10−59
,
simulation) and also including variants in com-
plete LD (r 2
= 1) with SNPs in DHSs (P < 10−37
,
simulation) (fig. S2).
In total, 47.5% of GWAS SNPs fall within
gene bodies (fig. S1B); however, only 10.9% of
intronic GWAS SNPs within DHSs are in strong
LD (r2
≥ 0.8) with a coding SNP, indicating that
the vast majority of noncoding genic variants
are not simply tagging coding sequence. Analo-
gously, only 16.3% of GWAS variants within
coding sequences are in strong LD with variants in
DHSs. SNPs on widely used genotyping arrays
(e.g., Affymetrix) were modestly enriched with-
in DHSs (fig. S2), possibly due to selection of
SNPs with robust experimental performance in
genotyping assays. However, we found no evi-
dence for sequence composition bias (table S3).
To further examine the enrichment of GWAS
SNPs in regulatory DNA, we systematically clas-
sified all noncoding GWAS SNPs by the quality
1
Department of Genome Sciences, University of Washington,
Seattle, WA 98195, USA. 2
Laboratory of Disease Genomics
RESEARCH ARTICLE
onSeptember12,2012www.sciencemag.orgDownloadedfrom](https://image.slidesharecdn.com/bmi7011212015-151210222642/85/Intro-to-Biomedical-Informatics-701-51-320.jpg)
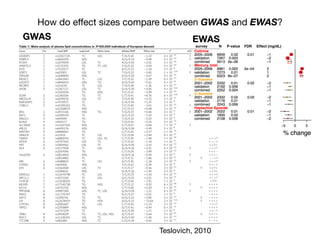
![Common claims discussed in regards to GWAS:
Despite issues, yielded many discoveries vs. cost
to a doubling of the number of associated variants discov-
ered. The proportion of genetic variation explained by
significantly associated SNPs is usually low (typically less
than 10%) for many complex traits, but for diseases such
as CD and multiple sclerosis (MS [MIM 126200]), and for
quantitative traits such as height and lipid traits, between
Figure 1. GWAS Discoveries over Time
Data obtained from the Published GWAS Catalog (see Web
Resources). Only the top SNPs representing loci with association
p values < 5 3 10À8
are included, and so that multiple counting
is avoided, SNPs identified for the same traits with LD r2
> 0.8 esti-
mated from the entire HapMap samples are excluded.
~500,000 SNP chips x ~$500/chip
= $250M
Five years of GWAS Discovery (Visscher, 2012)
$250M / ~2000 loci
= $125K/locus
Candidate genes: >$250M!
100 NIH R01s
Fighter jet
Hadron Collider: $9B](https://image.slidesharecdn.com/bmi7011212015-151210222642/85/Intro-to-Biomedical-Informatics-701-53-320.jpg)

![evol
part
ease
tase
well
biol
T
capt
imp
STR
reve
subs
libri
−log10(P)
0
5
10
15
Chromosome
22
X
21
20
19
18
17
16
15
14
13
12
11
10
9
8
7
6
5
4
3
2
1
80
60
100
teststatistic
a
b
NATURE|Vol 447|7 June 2007
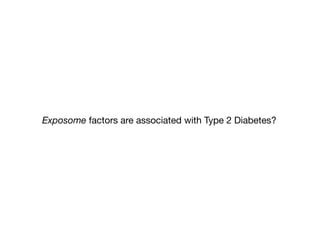
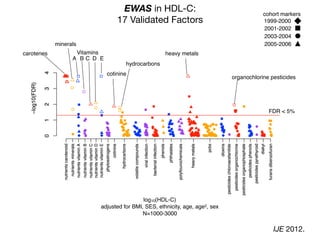
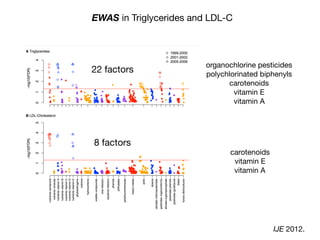
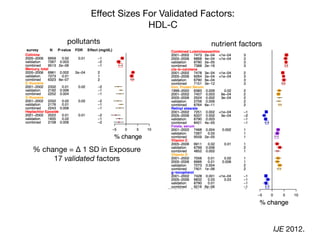
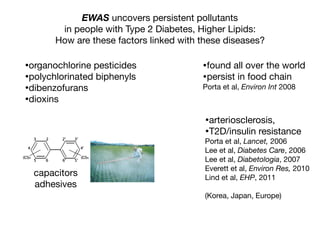
Environment-Wide Association Studies (EWAS):
A GWAS-like study for the environment
What specific environmental “loci” are associated to disease?
Environmental Category
Vitam
ins
β-carotene
M
etals
lead
O
rganophosphate
Pesticides
H
ydrocarbons
2-hydroxyfluorene [factor]
case
control](https://image.slidesharecdn.com/bmi7011212015-151210222642/85/Intro-to-Biomedical-Informatics-701-69-320.jpg)

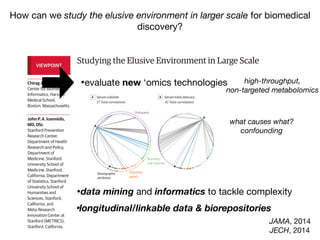
![Longitudinal Study:
“Gold Standard” for Validation
•exposure changing through time
•reverse causality bias
•compute disease risk
time
Disease
?
Exposure
DiseaseRisk
[low]
[high]](https://image.slidesharecdn.com/bmi7011212015-151210222642/85/Intro-to-Biomedical-Informatics-701-93-320.jpg)
![Adjusted Hazard Ratio
-log10(pvalue)
0.4 0.6 0.8 1.0 1.2 1.4 1.6 2.0 2.4 2.8
02468
1
2
3
4
5
67
1 Physical Activity
2 Does anyone smoke in home?
3 Cadmium
4 Cadmium, urine
5 Past smoker
6 Current smoker
7 trans-lycopene
(11) 1
2
3 4
5 6
78
9
10 1112
13 14
1516
1 age (10 year increment)
2 SES_1
3 male
4 SES_0
5 black
6 SES_2
7 SES_3
8 education_hs
9 other_eth
10 mexican
11 occupation_blue_semi
12 education_less_hs
13 occupation_never
14 occupation_blue_high
15 occupation_white_semi
16 other_hispanic
(69)
All-cause mortality:
253 exposure/behavior associations in survival
age, sex, income, education, race/ethnicity, occupation [in red]
FDR < 5%
sociodemographics
replicated factor
IJE, 2013](https://image.slidesharecdn.com/bmi7011212015-151210222642/85/Intro-to-Biomedical-Informatics-701-95-320.jpg)
![Adjusted Hazard Ratio
-log10(pvalue)
0.4 0.6 0.8 1.0 1.2 1.4 1.6 2.0 2.4 2.8
02468
1
2
3
4
5
67
1 Physical Activity
2 Does anyone smoke in home?
3 Cadmium
4 Cadmium, urine
5 Past smoker
6 Current smoker
7 trans-lycopene
(11) 1
2
3 4
5 6
78
9
10 1112
13 14
1516
1 age (10 year increment)
2 SES_1
3 male
4 SES_0
5 black
6 SES_2
7 SES_3
8 education_hs
9 other_eth
10 mexican
11 occupation_blue_semi
12 education_less_hs
13 occupation_never
14 occupation_blue_high
15 occupation_white_semi
16 other_hispanic
(69)
EWAS (re)-identifies factors associated with all-cause mortality:
Volcano plot of 200 associations
age (10 years)
income (quintile 2)
income (quintile 1)
male
black income (quintile 3)
any one smoke in home?
age, sex, income, education, race/ethnicity, occupation [in red]
serum and urine cadmium
[1 SD]
past smoker?
current smoker?serum lycopene
[1SD]
physical activity
[low, moderate, high activity]*
*derived from METs per activity and categorized by Health.gov guidelines
R2 ~ 2%](https://image.slidesharecdn.com/bmi7011212015-151210222642/85/Intro-to-Biomedical-Informatics-701-96-320.jpg)
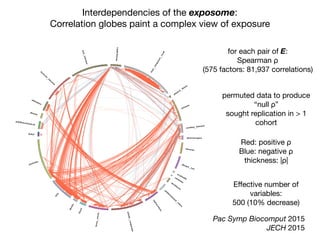
![Correlation Structure of the Exposome?
Analogy: “Linkage Disequilibrium”
Identification of four novel T2DM loci
Our fast-track stage 2 genotyping confirmed the reported association
for rs7903146 (TCF7L2) on chromosome 10, and in addition iden-
tified significant associations for seven SNPs representing four new
T2DM loci (Table 1). In all cases, the strongest association for the
MAX statistic (see Methods) was obtained with the additive model.
The most significant of these corresponds to rs13266634, a non-
synonymous SNP (R325W) in SLC30A8, located in a 33-kb linkage
disequilibrium block on chromosome 8, containing only the 39 end
of this gene (Fig. 2a). SLC30A8 encodes a zinc transporter expressed
solely in the secretory vesicles of b-cells and is thus implicated in the
final stages of insulin biosynthesis, which involve co-crystallization
Table 1 | Confirmed association results
SNP Chromosome Position
(nucleotides)
Risk
allele
Major
allele
MAF
(case)
MAF
(ctrl)
Odds ratio
(het)
Odds ratio
(hom)
PAR ls Stage 2
pMAX
Stage 2 pMAX
(perm)
Stage 1
pMAX
Stage 1 pMAX
(perm)
Nearest
gene
rs7903146 10 114,748,339 T C 0.406 0.293 1.65 6 0.19 2.77 6 0.50 0.28 1.0546 1.5 3 10234
,1.0 3 1027
3.2 3 10217
,3.3 3 10210
TCF7L2
rs13266634 8 118,253,964 C C 0.254 0.301 1.18 6 0.25 1.53 6 0.31 0.24 1.0089 6.1 3 1028
5.0 3 1027
2.1 3 1025
1.8 3 1025
SLC30A8
rs1111875 10 94,452,862 G G 0.358 0.402 1.19 6 0.19 1.44 6 0.24 0.19 1.0069 3.0 3 1026
7.4 3 1026
9.1 3 1026
7.3 3 1026
HHEX
rs7923837 10 94,471,897 G G 0.335 0.377 1.22 6 0.21 1.45 6 0.25 0.20 1.0065 7.5 3 1026
2.2 3 1025
3.4 3 1026
2.5 3 1026
HHEX
rs7480010 11 42,203,294 G A 0.336 0.301 1.14 6 0.13 1.40 6 0.25 0.08 1.0041 1.1 3 1024
2.9 3 1024
1.5 3 1025
1.2 3 1025
LOC387761
rs3740878 11 44,214,378 A A 0.240 0.272 1.26 6 0.29 1.46 6 0.33 0.24 1.0046 1.2 3 1024
2.8 3 1024
1.8 3 1025
1.3 3 1025
EXT2
rs11037909 11 44,212,190 T T 0.240 0.271 1.27 6 0.30 1.47 6 0.33 0.25 1.0045 1.8 3 1024
4.5 3 1024
1.8 3 1025
1.3 3 1025
EXT2
rs1113132 11 44,209,979 C C 0.237 0.267 1.15 6 0.27 1.36 6 0.31 0.19 1.0044 3.3 3 1024
8.1 3 1024
3.7 3 1025
2.9 3 1025
EXT2
Significant T2DM associations were confirmed for eight SNPs in five loci. Allele frequencies, odds ratios (with 95% confidence intervals) and PAR were calculated using only the stage 2 data. Allele
frequencies in the controls were very close to those reported for the CEU set (European subjects genotyped in the HapMap project). Induced sibling recurrent risk ratios (ls) were estimated using
stage 2 genotype counts for the control subjects and assuming a T2DM prevalence of 7% in the French population. hom, homozygous; het, heterozygous; major allele, the allele with the higher
frequency in controls; pMAX, P-value of the MAX statistic from the x2
distribution; pMAX (perm), P-value of the MAX statistic from the permutation-derived empirical distribution (pMAX and
pMAX (perm) are adjusted for variance inflation); risk allele, the allele with higher frequency in cases compared with controls.
*
*
*
0
2
4
–log10[P]
–log10[P]*
4954642sr
2373971sr
3373971sr
445409sr
8012261sr
3349941sr
883429sr
2019462sr
0349941sr
90350501sr
036169sr
0415007sr
2225991sr
6136642sr
8136642sr
1869646sr
8798751sr
04928201sr
3926642sr
5926642sr
43666231sr
9926642sr
2954642sr
01350501sr
5769646sr
4577187sr
4769646sr
41350501sr
5784931sr
2173387sr
39250501sr
5050007sr
7492602sr
1255051sr
156868sr
4373387sr
4784931sr
7501107sr
2697402sr
91518711sr
6461001sr
29250501sr
5889103sr
8669646sr
0889103sr
4688392sr
SLC30A8 IDE HHEXKIF11
**
**
**
0
2
4
* *
5470942sr
7602242sr
28178111sr
1570942sr
2394424sr
8838141sr
76029511sr
37178111sr
2945391sr
2608842sr
64690501sr
1537942sr
2950249sr
0339351sr
1708842sr
195749sr
4037942sr
1137942sr
7383297sr
5781111sr
9275722sr
9537197sr
6342097sr
0383856sr
0990707sr
4184197sr
19028801sr
9125722sr
88028801sr
1974064sr
5374283sr
53465221sr
6283856sr
5058573sr
3679991sr
1118097sr
3491242sr
46078111sr
06078111sr
7912381sr
3148707sr
0283856sr
52078111sr
5227373sr
0491242sr
2369412sr
2297881sr
662155sr
7790197sr
44068701sr
35075221sr
5826807sr
7851092sr
9409522sr
–log10[P]
–log10[P]
EXT2 ALX4
0
2
4
*** * **
0
2
4
LOC387761
a b
c d
NATURE|Vol 445|22 February 2007 ARTICLES
Sladek et al., Nature Genetics (2007)
Correlation between
occurrence of genetic loci
In GWAS, allows one to trace
to the “causal” locus.
Independence of association:
How to untangle “web” of
exposure?
β-carotene hydrocarbons
γ-tocopherol
ρ](https://image.slidesharecdn.com/bmi7011212015-151210222642/85/Intro-to-Biomedical-Informatics-701-97-320.jpg)
![Committee on A Framework for Developing a
New Taxonomy of Disease
Board on Life Sciences
Division on Earth and Life Studies
NRC, National Academy of Sciences 2011
The use of multiple molecular parameters to
characterize disease [P] may lead to a more
accurate and find-grained classification of
disease [P]…
“multiple molecular parameters” must include E!](https://image.slidesharecdn.com/bmi7011212015-151210222642/85/Intro-to-Biomedical-Informatics-701-106-320.jpg)
![Alpha-carotene
Alcohol
VitaminEasalpha-tocopherol
Beta-carotene
Caffeine
Calcium
Carbohydrate
Cholesterol
Copper
Beta-cryptoxanthin
Folicacid
Folate,DFE
Foodfolate
Dietaryfiber
Iron
Energy
Lycopene
Lutein+zeaxanthin
MFA16:1
MFA18:1
MFA20:1
Magnesium
Totalmonounsaturatedfattyacids
Moisture
Niacin
PFA18:2
PFA18:3
PFA20:4
PFA22:5
PFA22:6
Totalpolyunsaturatedfattyacids
Phosphorus
Potassium
Protein
Retinol
SFA4:0
SFA6:0
SFA8:0
SFA10:0
SFA12:0
SFA14:0
SFA16:0
SFA18:0
Selenium
Totalsaturatedfattyacids
Totalsugars
Totalfat
Theobromine
VitaminA,RAE
Thiamin
VitaminB12
Riboflavin
VitaminB6
VitaminC
VitaminK
Zinc
NoSalt
OrdinarySalt
a-Carotene
VitaminB12,serum
trans-b-carotene
cis-b-carotene
b-cryptoxanthin
Folate,serum
g-tocopherol
Iron,FrozenSerum
CombinedLutein/zeaxanthin
trans-lycopene
Folate,RBC
Retinylpalmitate
Retinylstearate
Retinol
VitaminD
a-Tocopherol
Daidzein
o-Desmethylangolensin
Equol
Enterodiol
Enterolactone
Genistein
EstimatedVO2max
PhysicalActivity
Doesanyonesmokeinhome?
Total#ofcigarettessmokedinhome
Cotinine
CurrentCigaretteSmoker?
Agelastsmokedcigarettesregularly
#cigarettessmokedperdaywhenquit
#cigarettessmokedperdaynow
#dayssmokedcigsduringpast30days
Avg#cigarettes/dayduringpast30days
Smokedatleast100cigarettesinlife
Doyounowsmokecigarettes...
numberofdayssincequit
Usedsnuffatleast20timesinlife
drink5inaday
drinkperday
days5drinksinyear
daysdrinkinyear
3-fluorene
2-fluorene
3-phenanthrene
1-phenanthrene
2-phenanthrene
1-pyrene
3-benzo[c]phenanthrene
3-benz[a]anthracene
Mono-n-butylphthalate
Mono-phthalate
Mono-cyclohexylphthalate
Mono-ethylphthalate
Mono-phthalate
Mono--hexylphthalate
Mono-isobutylphthalate
Mono-n-methylphthalate
Mono-phthalate
Mono-benzylphthalate
Cadmium
Lead
Mercury,total
Barium,urine
Cadmium,urine
Cobalt,urine
Cesium,urine
Mercury,urine
Iodine,urine
Molybdenum,urine
Lead,urine
Platinum,urine
Antimony,urine
Thallium,urine
Tungsten,urine
Uranium,urine
BloodBenzene
BloodEthylbenzene
Bloodo-Xylene
BloodStyrene
BloodTrichloroethene
BloodToluene
Bloodm-/p-Xylene
1,2,3,7,8-pncdd
1,2,3,7,8,9-hxcdd
1,2,3,4,6,7,8-hpcdd
1,2,3,4,6,7,8,9-ocdd
2,3,7,8-tcdd
Beta-hexachlorocyclohexane
Gamma-hexachlorocyclohexane
Hexachlorobenzene
HeptachlorEpoxide
Mirex
Oxychlordane
p,p-DDE
Trans-nonachlor
2,5-dichlorophenolresult
2,4,6-trichlorophenolresult
Pentachlorophenol
Dimethylphosphate
Diethylphosphate
Dimethylthiophosphate
PCB66
PCB74
PCB99
PCB105
PCB118
PCB138&158
PCB146
PCB153
PCB156
PCB157
PCB167
PCB170
PCB172
PCB177
PCB178
PCB180
PCB183
PCB187
3,3,4,4,5,5-hxcb
3,3,4,4,5-pncb
3,4,4,5-tcb
Perfluoroheptanoicacid
Perfluorohexanesulfonicacid
Perfluorononanoicacid
Perfluorooctanoicacid
Perfluorooctanesulfonicacid
Perfluorooctanesulfonamide
2,3,7,8-tcdf
1,2,3,7,8-pncdf
2,3,4,7,8-pncdf
1,2,3,4,7,8-hxcdf
1,2,3,6,7,8-hxcdf
1,2,3,7,8,9-hxcdf
2,3,4,6,7,8-hxcdf
1,2,3,4,6,7,8-hpcdf
Measles
Toxoplasma
HepatitisAAntibody
HepatitisBcoreantibody
HepatitisBSurfaceAntibody
HerpesII
Albumin, urine
Uric acid
Phosphorus
Osmolality
Sodium
Potassium
Creatinine
Chloride
Total calcium
Bicarbonate
Blood urea nitrogen
Total protein
Total bilirubin
Lactate dehydrogenase LDH
Gamma glutamyl transferase
Globulin
Alanine aminotransferase ALT
Aspartate aminotransferase AST
Alkaline phosphotase
Albumin
Methylmalonic acid
PSA. total
Prostate specific antigen ratio
TIBC, Frozen Serum
Red cell distribution width
Red blood cell count
Platelet count SI
Segmented neutrophils percent
Mean platelet volume
Mean cell volume
Mean cell hemoglobin
MCHC
Hemoglobin
Hematocrit
Ferritin
Protoporphyrin
Transferrin saturation
White blood cell count
Monocyte percent
Lymphocyte percent
Eosinophils percent
C-reactive protein
Segmented neutrophils number
Monocyte number
Lymphocyte number
Eosinophils number
Basophils number
mean systolic
mean diastolic
60 sec. pulse:
60 sec HR
Total Cholesterol
Triglycerides
Glucose, serum
Insulin
Homocysteine
Glucose, plasma
Glycohemoglobin
C-peptide: SI
LDL-cholesterol
Direct HDL-Cholesterol
Bone alkaline phosphotase
Trunk Fat
Lumber Pelvis BMD
Lumber Spine BMD
Head BMD
Trunk Lean excl BMC
Total Lean excl BMC
Total Fat
Total BMD
Weight
Waist Circumference
Triceps Skinfold
Thigh Circumference
Subscapular Skinfold
Recumbent Length
Upper Leg Length
Standing Height
Head Circumference
Maximal Calf Circumference
Body Mass Index
-0.4 -0.2 0 0.2 0.4
Value
050100150
Color Key
and Histogram
Count
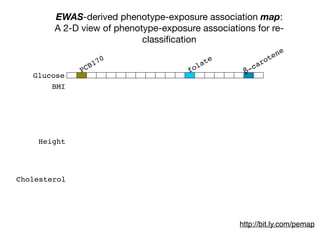
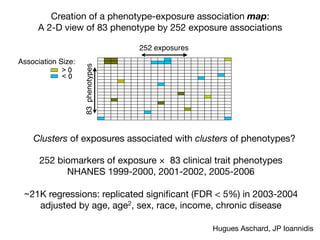
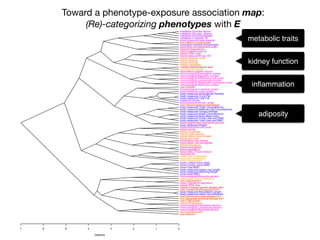
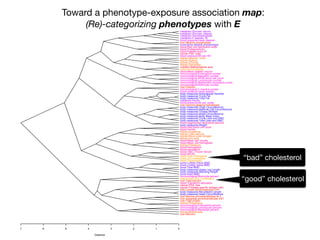
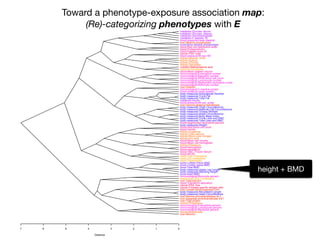
http://bit.ly.com/pemap
phenotypes
exposures
+- EWAS-derived phenotype-exposure association map:
A 2-D view of connections between P and E](https://image.slidesharecdn.com/bmi7011212015-151210222642/85/Intro-to-Biomedical-Informatics-701-112-320.jpg)
![Alpha-carotene
Alcohol
VitaminEasalpha-tocopherol
Beta-carotene
Caffeine
Calcium
Carbohydrate
Cholesterol
Copper
Beta-cryptoxanthin
Folicacid
Folate,DFE
Foodfolate
Dietaryfiber
Iron
Energy
Lycopene
Lutein+zeaxanthin
MFA16:1
MFA18:1
MFA20:1
Magnesium
Totalmonounsaturatedfattyacids
Moisture
Niacin
PFA18:2
PFA18:3
PFA20:4
PFA22:5
PFA22:6
Totalpolyunsaturatedfattyacids
Phosphorus
Potassium
Protein
Retinol
SFA4:0
SFA6:0
SFA8:0
SFA10:0
SFA12:0
SFA14:0
SFA16:0
SFA18:0
Selenium
Totalsaturatedfattyacids
Totalsugars
Totalfat
Theobromine
VitaminA,RAE
Thiamin
VitaminB12
Riboflavin
VitaminB6
VitaminC
VitaminK
Zinc
NoSalt
OrdinarySalt
a-Carotene
VitaminB12,serum
trans-b-carotene
cis-b-carotene
b-cryptoxanthin
Folate,serum
g-tocopherol
Iron,FrozenSerum
CombinedLutein/zeaxanthin
trans-lycopene
Folate,RBC
Retinylpalmitate
Retinylstearate
Retinol
VitaminD
a-Tocopherol
Daidzein
o-Desmethylangolensin
Equol
Enterodiol
Enterolactone
Genistein
EstimatedVO2max
PhysicalActivity
Doesanyonesmokeinhome?
Total#ofcigarettessmokedinhome
Cotinine
CurrentCigaretteSmoker?
Agelastsmokedcigarettesregularly
#cigarettessmokedperdaywhenquit
#cigarettessmokedperdaynow
#dayssmokedcigsduringpast30days
Avg#cigarettes/dayduringpast30days
Smokedatleast100cigarettesinlife
Doyounowsmokecigarettes...
numberofdayssincequit
Usedsnuffatleast20timesinlife
drink5inaday
drinkperday
days5drinksinyear
daysdrinkinyear
3-fluorene
2-fluorene
3-phenanthrene
1-phenanthrene
2-phenanthrene
1-pyrene
3-benzo[c]phenanthrene
3-benz[a]anthracene
Mono-n-butylphthalate
Mono-phthalate
Mono-cyclohexylphthalate
Mono-ethylphthalate
Mono-phthalate
Mono--hexylphthalate
Mono-isobutylphthalate
Mono-n-methylphthalate
Mono-phthalate
Mono-benzylphthalate
Cadmium
Lead
Mercury,total
Barium,urine
Cadmium,urine
Cobalt,urine
Cesium,urine
Mercury,urine
Iodine,urine
Molybdenum,urine
Lead,urine
Platinum,urine
Antimony,urine
Thallium,urine
Tungsten,urine
Uranium,urine
BloodBenzene
BloodEthylbenzene
Bloodo-Xylene
BloodStyrene
BloodTrichloroethene
BloodToluene
Bloodm-/p-Xylene
1,2,3,7,8-pncdd
1,2,3,7,8,9-hxcdd
1,2,3,4,6,7,8-hpcdd
1,2,3,4,6,7,8,9-ocdd
2,3,7,8-tcdd
Beta-hexachlorocyclohexane
Gamma-hexachlorocyclohexane
Hexachlorobenzene
HeptachlorEpoxide
Mirex
Oxychlordane
p,p-DDE
Trans-nonachlor
2,5-dichlorophenolresult
2,4,6-trichlorophenolresult
Pentachlorophenol
Dimethylphosphate
Diethylphosphate
Dimethylthiophosphate
PCB66
PCB74
PCB99
PCB105
PCB118
PCB138&158
PCB146
PCB153
PCB156
PCB157
PCB167
PCB170
PCB172
PCB177
PCB178
PCB180
PCB183
PCB187
3,3,4,4,5,5-hxcb
3,3,4,4,5-pncb
3,4,4,5-tcb
Perfluoroheptanoicacid
Perfluorohexanesulfonicacid
Perfluorononanoicacid
Perfluorooctanoicacid
Perfluorooctanesulfonicacid
Perfluorooctanesulfonamide
2,3,7,8-tcdf
1,2,3,7,8-pncdf
2,3,4,7,8-pncdf
1,2,3,4,7,8-hxcdf
1,2,3,6,7,8-hxcdf
1,2,3,7,8,9-hxcdf
2,3,4,6,7,8-hxcdf
1,2,3,4,6,7,8-hpcdf
Measles
Toxoplasma
HepatitisAAntibody
HepatitisBcoreantibody
HepatitisBSurfaceAntibody
HerpesII
Albumin, urine
Uric acid
Phosphorus
Osmolality
Sodium
Potassium
Creatinine
Chloride
Total calcium
Bicarbonate
Blood urea nitrogen
Total protein
Total bilirubin
Lactate dehydrogenase LDH
Gamma glutamyl transferase
Globulin
Alanine aminotransferase ALT
Aspartate aminotransferase AST
Alkaline phosphotase
Albumin
Methylmalonic acid
PSA. total
Prostate specific antigen ratio
TIBC, Frozen Serum
Red cell distribution width
Red blood cell count
Platelet count SI
Segmented neutrophils percent
Mean platelet volume
Mean cell volume
Mean cell hemoglobin
MCHC
Hemoglobin
Hematocrit
Ferritin
Protoporphyrin
Transferrin saturation
White blood cell count
Monocyte percent
Lymphocyte percent
Eosinophils percent
C-reactive protein
Segmented neutrophils number
Monocyte number
Lymphocyte number
Eosinophils number
Basophils number
mean systolic
mean diastolic
60 sec. pulse:
60 sec HR
Total Cholesterol
Triglycerides
Glucose, serum
Insulin
Homocysteine
Glucose, plasma
Glycohemoglobin
C-peptide: SI
LDL-cholesterol
Direct HDL-Cholesterol
Bone alkaline phosphotase
Trunk Fat
Lumber Pelvis BMD
Lumber Spine BMD
Head BMD
Trunk Lean excl BMC
Total Lean excl BMC
Total Fat
Total BMD
Weight
Waist Circumference
Triceps Skinfold
Thigh Circumference
Subscapular Skinfold
Recumbent Length
Upper Leg Length
Standing Height
Head Circumference
Maximal Calf Circumference
Body Mass Index
-0.4 -0.2 0 0.2 0.4
Value
050100150
Color Key
and Histogram
Count
http://bit.ly.com/pemap
phenotypes
exposures
+-
nutrients
BMI,weight,
BMD
metabolic
renalfunction
pcbs
metabolic
bloodparameters
hydrocarbons
EWAS-derived phenotype-exposure association map:
A 2-D view of connections between P and E](https://image.slidesharecdn.com/bmi7011212015-151210222642/85/Intro-to-Biomedical-Informatics-701-113-320.jpg)
![Per-risk allele OR for rs13266634 (SLC30A8) Stratified by E
Increase or decrease up to 30-40% vs. marginal effect!
Adjusted for race, sex, BMI, age
trans-β-carotene (low(-1SD))
trans-β-carotene (mean)
trans-β-carotene (high(+1SD))
γ-tocopherol (low(-1SD))
γ-tocopherol (mean)
γ-tocopherol (high(+1SD))
rs13266634(SLC30A8)
rs13266634(SLC30A8)
0 0.5 1 1.5 2 2.5
Per risk allele OR
OR (95% CI)
1.8 [1.3,2.6]
1.1 [0.79,1.5]
0.65 [0.4,1.1]
p-value:5e-05
N(cases):1702(164)
0.82 [0.52,1.3]
1.1 [0.87,1.5]
1.6 [1.3,2]
p-value:0.0094
N(cases):2925(274)
marginal OR=1.1
trans-β-carotene (low(-1SD))
trans-β-carotene (mean)
trans-β-carotene (high(+1SD))
γ-tocopherol (low(-1SD))
γ-tocopherol (mean)
γ-tocopherol (high(+1SD))
rs13266634(SLC30A8)
rs13266634(SLC30A8)
0 0.5 1 1.5 2 2.5
Per risk allele OR
OR (95% CI)
1.8 [1.3,2.6]
1.1 [0.79,1.5]
0.65 [0.4,1.1]
p-value:5e-05
N(cases):1702(164)
0.82 [0.52,1.3]
1.1 [0.87,1.5]
1.6 [1.3,2]
p-value:0.0094
N(cases):2925(274)
FDR=2%
FDR=18%
Human Genetics. 2013](https://image.slidesharecdn.com/bmi7011212015-151210222642/85/Intro-to-Biomedical-Informatics-701-126-320.jpg)
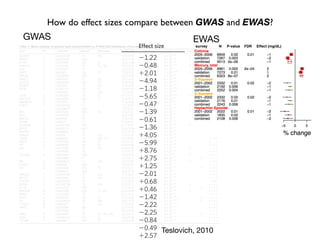
![In conclusion:
on GWAS and EWAS
GWAS has been unparalleled in biological discovery...
... coupled with EWAS, will lead to precise and personal
medicine.
−log10(pvalue)
●
●
●●
●
●
●
●
●
●●
●
●
●
●
●
●
●
●
●●
●
●
●
●
●
●
●
●
●
●
●
●
●
●
●
●
●
●
●
●
●●
●
●
●
●
●
●
●
●
●
●
●
●
●
●
●
●●
●
●
●
●
●
●
●
●
●
●
●
● ●●
●
●
●
●●
●
●
●
●
●
●
●
●
●
●
●
●
●
●
●
●
●
●
●
●
●●
●
●
●
●
●
●
●
●
●
●
●
●
●
●
●
●
●
●
●
●
●
●
●●
●
●
●
●
●
●
●
●
●
●
●
●● ●
●●
●
●
●
● ●
●
●
●
●
●
●
●
●
●
●
●
●
●
●
●
●
●
●
●
●
●
●
●
●
●
●
●
●
●
●●●
●
●●
●
●●
●
●
●
●●
●
●
●
●
●
●
●
●
●
●●
●●
●
●
●
●
●
● ●
acrylamide
allergentest
bacterialinfection
cotinine
diakyl
dioxins
furansdibenzofuran
heavymetals
hydrocarbons
latex
nutrientscarotenoid
nutrientsminerals
nutrientsvitaminA
nutrientsvitaminB
nutrientsvitaminC
nutrientsvitaminD
nutrientsvitaminE
pcbs
perchlorate
pesticidesatrazine
pesticideschlorophenol
pesticidesorganochlorine
pesticidesorganophosphate
pesticidespyrethyroid
phenols
phthalates
phytoestrogens
polybrominatedethers
polyflourochemicals
viralinfection
volatilecompounds
012
to a doubling of the number of associated variants discov-
ered. The proportion of genetic variation explained by
significantly associated SNPs is usually low (typically less
than 10%) for many complex traits, but for diseases such
as CD and multiple sclerosis (MS [MIM 126200]), and for
quantitative traits such as height and lipid traits, between
10% and 20% of genetic variance has been accounted for
(Table 1). In comparison to the pre-GWAS era, the propor-
tion of genetic variation accounted for by newly discov-
ered variants that are segregating in the population is large.
It is clear that for most complex traits that have been
investigated by GWAS, multiple identified loci have
genome-wide statistical significance, and thus it is likely
that there are (many) other loci that have not been identi-
fied because of a lack of statistical significance (false nega-
tives). Recently, researchers have developed and applied
methods to quantify the proportion of phenotypic varia-
Figure 1. GWAS Discoveries over Time
Data obtained from the Published GWAS Catalog (see Web
Resources). Only the top SNPs representing loci with association
p values < 5 3 10À8
are included, and so that multiple counting
is avoided, SNPs identified for the same traits with LD r2
> 0.8 esti-
mated from the entire HapMap samples are excluded.
Figure 2. Increase in Number of Loci Identified as a Function of
Experimental Sample Size
(A) Selected quantitative traits.
(B) Selected diseases.
The coordinates are on the log scale. The complex traits were
selected with the criteria that there were at least three GWAS
papers published on each in journals with a 2010–2011 journal](https://image.slidesharecdn.com/bmi7011212015-151210222642/85/Intro-to-Biomedical-Informatics-701-131-320.jpg)

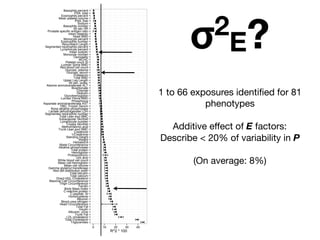
This document provides an introduction to genome-wide association studies (GWAS) and their role in discovering the genetic basis of complex traits and diseases. It explains that GWAS are a hypothesis-free approach to searching the entire human genome for genetic variants associated with a trait using common single nucleotide polymorphisms. Over 2,000 traits and diseases have been studied through GWAS, identifying over 15,000 genetic associations. The document traces the development of GWAS from early human genome sequencing and projects to characterize human genetic variation to the availability of high-throughput genotyping arrays that enabled widespread application of GWAS in disease research.


![ONFH[AVN HIP] -TRIPLE REGIME -A NOVAL SURGICAL CONCEPT .pptx](https://cdn.slidesharecdn.com/ss_thumbnails/onfhavnhip2026koaconcalicutdrgokuldevdrmashraf-260210064517-213ec005-thumbnail.jpg?width=640&height=640&fit=bounds)


