Download to read offline
![Deepa, Ravishankar / International Journal of Engineering Research and Applications
(IJERA) ISSN: 2248-9622 www.ijera.com
Vol. 3, Issue 4, Jul-Aug 2013, pp.1587-1592
1587 | P a g e
Reducing Hot and Cold Utility Requirements for Finishing
Column Section Using Pinch Analysis Techniques
Deepa1
, Ravishankar2
1, 2
Chemical Engineering Department, DSCE, Bangalore-78
ABSTRACT
Pinch Analysis is a methodology for
minimizing energy consumption of chemical plant
by maximizing the utilization of hot and cold
utilities available within the process, thereby
reducing the use of external utilities. It is also
known as process integration, heat integration,
energy integration or Pinch technology. Pinch
technology is applied on various process flow
diagrams from chemical industries using different
strategies or techniques. These techniques include
both graphical procedure (Thermal Pinch
diagram) as well as algebraic procedure
(Temperature interval diagrams) in order to
compare the minimum heating and cooling utility
requirement of a process with the actual
requirement. In the present work, the process flow
diagram of finishing column section is received
from a chemical industry and block diagram is
prepared for simplification. The hot and cold
streams are identified and Pinch analysis
techniques are applied in order to find out the
minimum heating and cooling utility requirement.
With this, the utilities available within the process
can be used better and thus energy can be
conserved to an extent of 25%.
Keywords: Graphical procedure, Heat integration,
Pinch Technology, Revised cascade diagram ,
Temperature interval diagram.
I. INTRODUCTION
Chemical processes should be designed as
part of a sustainable industrial activity that retains the
capacity of ecosystems to support both life and
industrial activity into the future. Sustainable
industrial activity must meet the needs of the present,
without compromising the needs of future
generations. For chemical process design, this means
that processes should use raw materials as efficiently
as is economic and practicable, both to prevent the
production of waste that can be environmentally
harmful and to preserve the reserves of raw materials
as much as possible. Processes should use as little
energy as economic and practicable, both to prevent
the build-up of carbon dioxide in the atmosphere
from burning fossil fuels and to preserve the reserves
of fossil fuels. [5]
In a chemical process, the heating and
cooling duties that cannot be satisfied by heat
recovery, dictate the need for external heating and
cooling utilities (furnace heating, use of steam, steam
generation, cooling water, air-cooling or
refrigeration). Thus, utility selection and design
follows the design of the heat recovery system.
Pinch Analysis is a methodology for
minimizing energy consumption of chemical
processes by calculating thermodynamically feasible
energy targets and achieving them by optimizing heat
recovery system, energy supply methods and process
operating conditions It is also known as process
energy integration, heat integration, energy
integration or Pinch technology.
1.1 Objective
In the present work the process flow
diagram of Finishing column section was obtained
from a chemical industry and Pinch analysis
techniques were applied in order to find the minimum
heating and cooling utility requirement. The main
objective is to find the energy available and saved
from the process.
1.2 Similar works
Studies similar to present work have been
done by several people among which a few are listed
below.
-Dr.Gavin P. Towler worked on “Integrated
process design for improved energy efficiency.” The
concept that the efficiency with which energy and
raw materials are used within the process industries
depends strongly on the way in which resources are
distributed within a manufacturing site were
described. Most sites or processes contain several
sources or sinks of the resource. For example, a
chemical plant will have heat sources (hot streams)
and heat sinks (cold streams). By matching these
sources and sinks in the appropriate manner we can
transfer heat between the streams. Thus developed a
more integrated process design which makes better
use of the resources available internally, and
therefore reduces the amount of external resource that
is required. The techniques for integrated design of
processes can be applied to a range of problems, for
example, recovery of process waste heat, reduction of
water usage (which reduces the consumption of heat
in treating fresh water and waste water), reduction of
chemicals use, etc. In all cases, the overall result is a
considerable saving in energy. [1]](https://image.slidesharecdn.com/ip3415871592-130729002935-phpapp01/85/Ip3415871592-1-320.jpg)
![Deepa, Ravishankar / International Journal of Engineering Research and Applications
(IJERA) ISSN: 2248-9622 www.ijera.com
Vol. 3, Issue 4, Jul-Aug 2013, pp.1587-1592
1588 | P a g e
-R.M. Mathur, B.P. Thapliyal used Pinch
analysis as a tool in pulp and paper industry for
setting energy targets and optimizing the heat
recovery systems. Using this methodology in a
bleached Kraft mill, various successful cost effective
process integration and design approaches have been
adopted to maximize the heat recovery. In a typical
case, all process heating and cooling duties were
reviewed , hot effluents being included as potential
sources of additional heat. Stream data is then
extracted as hot and cold streams according to
analysis procedure to derive composite and Grand
composite curves for a typical pulp mill. [2]
-Uday V.Shenoy worked on process
integration concepts and their application to energy
conservation. Heat integration Strategies such as
construction of composite curves and grand
composite curves for minimum energy targeting were
used. The targeting methodology proposed by
Shenoy etal.(1998) to determine the optimum loads
for multiple utilities is based on the cheapest utility
principle(CUP) ,which simply states that the
temperature driving forces at the utility pinches once
optimized do not change even when the minimum
approach temperature at the process pinch is varied.
In other words, it is optimal to increase the load of
the cheapest utility and maintain the loads of the
relatively expensive utilities constant while
increasing the total utility consumption.[3]
II. MATERIALS AND METHODS
2.1 Heat Integration Strategies
Two techniques are available for the
application of Pinch Technology on process flow
diagrams from chemical industries. These include:
1) Graphical procedure (Thermal Pinch diagram)
2) Algebraic procedure (Temperature interval
diagram)
The above techniques are used to find the minimum
heating and cooling utility requirement of a process.
Steps involved in Graphical Procedure:
• The given hot and streams must be plotted
on temperature-enthalpy axes
• A constant heat capacity over the operating
range is assumed
• Next, both the hot and cold streams are
plotted together in a single temperature
versus enthalpy plot which represents the
Thermal Pinch diagram
• The point where the two composite streams
touch or very close to each other is called
“Thermal Pinch point”.
• The region of overlap between the two
streams determines the amount of heat
recovery possible
•
The part of the cold stream that extends
beyond the start of the hot stream cannot be
heated by recovery and requires steam and it
is the minimum hot utility or energy target
• The part of the hot stream that extends
beyond the start of the cold stream cannot be
cooled by heat recovery and requires cooling
water and it is the minimum cold utility
Steps involved in Algebraic Procedure:
• The first step in algebraic approach is the
construction of the Temperature interval
diagram(TID)
• Next, the TEHLs (Table of exchangeable
heat loads) for the process hot and cold
streams are to be developed
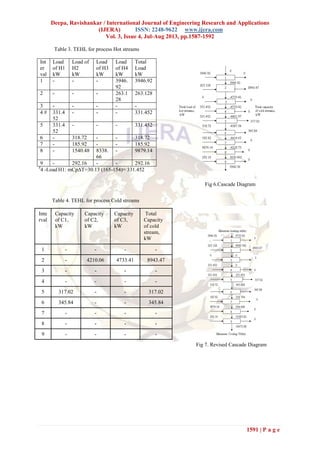
• A cascade diagram is constructed
• A Revised Cascade diagram is constructed
whenever there exists a thermodynamic
infeasibility.
• The results obtained from the revised
cascade diagram will be identical to those
obtained using the graphical pinch approach
The flow pattern of Hot and cold streams for
Finishing column section is as follows. It was
observed that there were four hot streams and three
cold streams with the following data.
Initial cooling utility requirement=14300 kW
Initial heating utility requirement= 6500 kW
Fig.1 Block Diagram of Finishing Column
Overhead
from extract
column
C1,
1210
C
1440
C
H3
1240
C
1660
C
1660
C
H1
1650
C
C3, 1650
C C2, 1650
C
H2, 1430
C
550
C
Paraxylene to
Tankage system Desorbent to
Adsorbent
Chambers
Desorbent from
Surge Drum
H4
1910
C 660
C
To
vent
Water to
oily water
sewer
Crude
Toluene to
Totary
unit
Condenser
Finishing Column
Finishing
Column
Receiver](https://image.slidesharecdn.com/ip3415871592-130729002935-phpapp01/85/Ip3415871592-2-320.jpg)


![Deepa, Ravishankar / International Journal of Engineering Research and Applications
(IJERA) ISSN: 2248-9622 www.ijera.com
Vol. 3, Issue 4, Jul-Aug 2013, pp.1587-1592
1592 | P a g e
Table 5. Comparison of Actual and minimum heating
utility requirement
Actual
heating
utility
requirement,
kW
Min. heating
utility requirement
(Graphical
procedure) kW
Min. heating
utility
requirement
(Algebraic
procedure) kW
6500 5000 4733.42
Table 6. Comparison of Actual and minimum cooling
utility requirement
Actual
Cooling
Utility
Requirement
kW
Min. cooling
utility
requirement
(Graphical
procedure) kW
Min. cooling
utility
requirement
(Algebraic
procedure) kW
14300 11000 10675.98
IV. CONCLUSION
By the application of Pinch analysis on
Finishing column section the minimum heating and
cooling utility requirements were found and
compared with the actual requirements which are
summarized as follows:
The minimum cooling utility requirement for
Finishing column section from graphical and
algebraic procedure were found to be 11,000 kW
and 10,675.98 kW respectively which was
actually 14,300 kW and hence there is a
reduction in minimum cooling utility
requirement by 23%
The minimum heating utility requirement for
Finishing column section from graphical and
algebraic procedure were found to be 5,000kW
and 4,733.42 kW respectively which was
actually 6,500 kW and hence there is a reduction
in minimum cooling utility requirement by 23%
Pinch Analysis technique can be applied to any
section in an industry.
V. ACKNOWLEDGEMENT
We thank Mr.Ravindra, Reliance Company,
Jamnagar, Gujarath for his suggestions.
REFERENCES
[1] Towler .P. “Integrated process design for
improved energy efficiency.” Linnh off B,
DR and Wardle I (1979) Understanding
Heat Exchanger Networks, Comp Chem
Eng, 3:295
[2] Mathur.R.M. “Process Integration through
Pinch Analysis”, User Guide on Process
Integration for the Efficient Use of
Thermal Energy by Linnhoff & others,
Published by “The Institution of Chemical
Engineers, Geo. E. Davis Building, 165 –
171 Railway Terrace, Rugby, Warks,
CV21 3HQ, England”, 1982.
[3] Shenoy, U.V., Sinha, A. and Bandy
opadhyay, S. (1998) "Multiple utilities
targeting for heat exchanger networks",
Trans. IChemE. Chem. Eng. Res. Des., 76,
Part A, March, 259-272
[4] Lee, “Application of exergy and Pinch
analysis on oleochemical fractionation
process.” Linnhoff B, D.W. Townsend,
D. Boland, G.F. Hewitt, B.E.A. Thomas,
A.R.Guy, and R.H. Marsland, 1982, User
Guide on Process Integration for the
Efficient Use of Energy, IChemE, Rugby,
U.K.
[5] Smith, “Chemical Process Design and
Integration”, 8th Edition, 2006, pg 317-
437
[6] Mahmoud, “Process Integration”, Elsivier,
2006, pg 231-252](https://image.slidesharecdn.com/ip3415871592-130729002935-phpapp01/85/Ip3415871592-6-320.jpg)

The document discusses the application of pinch analysis techniques to minimize energy consumption in a chemical process, specifically focusing on the heating and cooling utility requirements of a finishing column section. Through the application of both graphical and algebraic procedures, the study identifies potential energy savings of up to 25% compared to actual utility requirements. The results indicate substantial reductions in both heating and cooling utilities, demonstrating the effectiveness of pinch analysis in improving energy efficiency in industrial processes.


