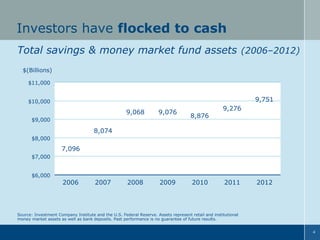
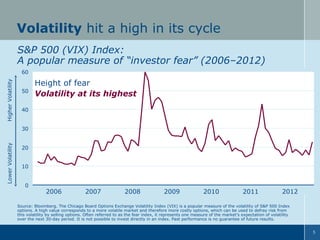
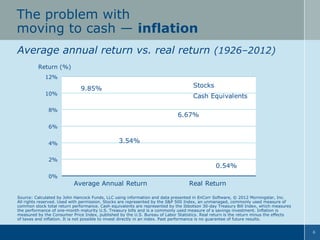
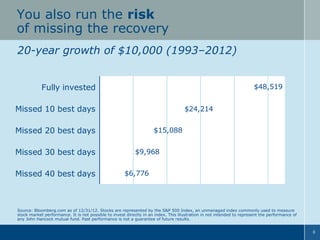
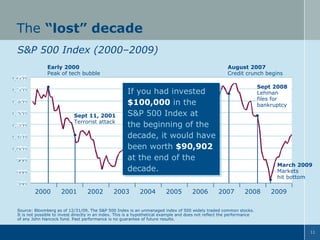
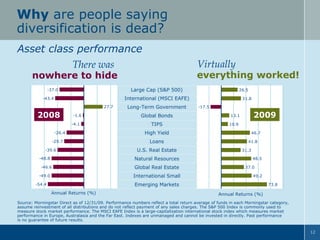
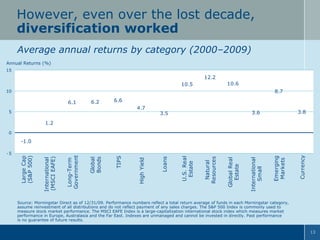
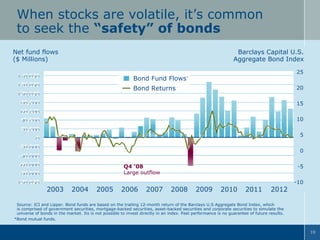
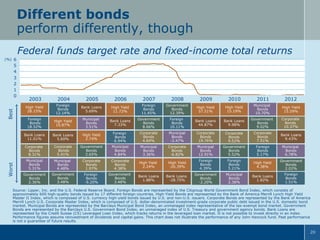
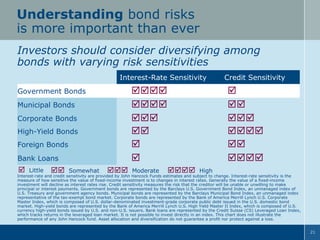
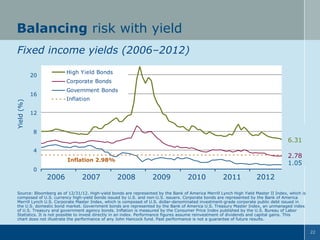
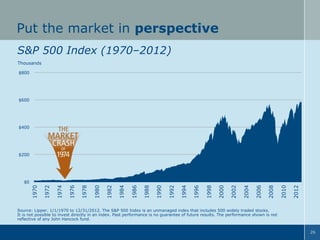
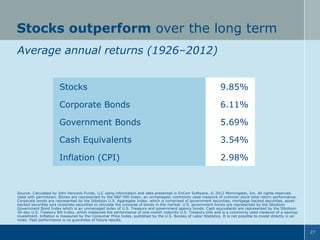
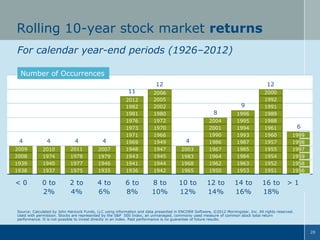
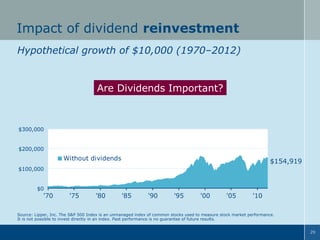
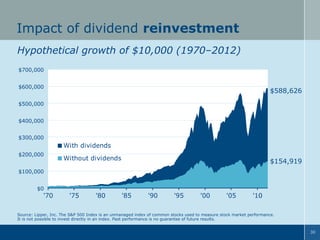
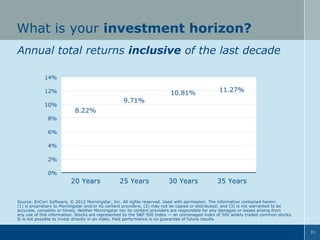
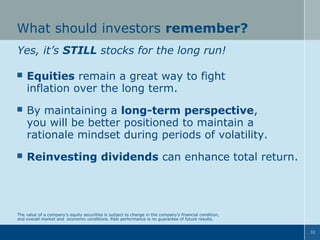
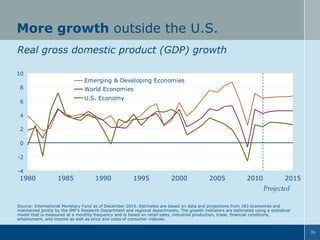
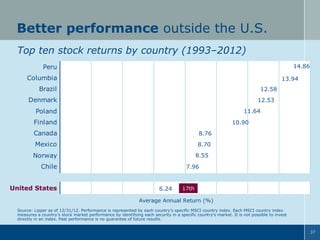
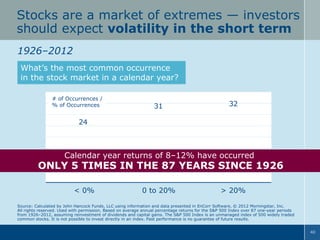
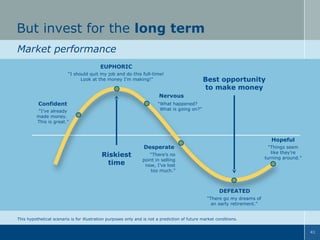
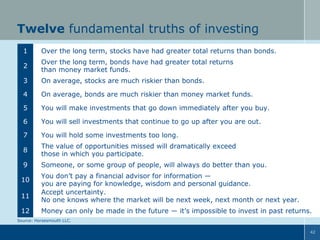
The document provides 5 investing principles based on a presentation about lessons learned. Principle 1 discusses that every investment has risks, even cash, as investors flocked to cash during volatile periods but it provided little return over the long run after accounting for inflation. Principle 2 notes that while most asset classes declined in 2008, a diversified portfolio still worked over the full market cycle from 2000-2009. Principle 3 explains that not all bonds or bond funds perform the same way. Principle 4 asserts that stocks have generally outperformed over the long run. Principle 5 advocates for including international stocks rather than avoiding foreign markets.
VIP Call Girls LB Nagar ( Hyderabad ) Phone 8250192130 | ₹5k To 25k With Room...
5 Investing Principles for Today and Beyond
1. Lessons Learned
5 investing principles
for today and beyond
Presenter’s Name
Presenter’s Title
The performance data contained in this presentation represents past performance, which does not guarantee future results.
Performance, especially for short time periods, should not be the sole factor in making your investment decisions.
NOT FDIC INSURED. MAY LOSE VALUE. NO BANK GUARANTEE. NOT INSURED BY ANY GOVERNMENT AGENCY.
2. Agenda
1.
Every investment has risks, even cash
2.
Diversification is not dead,
it’s just misunderstood
3.
Not all bonds — or bond funds
— are created equal
4.
Yes, it’s STILL stocks for the long run
5.
Investing abroad shouldn’t be
a foreign experience
2
4. Investors have flocked to cash
Total savings & money market fund assets (2006–2012)
$(Billions)
$11,000
9,751
$10,000
9,068
9,076
2008
2009
$9,000
8,876
9,276
8,074
$8,000
7,096
$7,000
$6,000
2006
2007
2010
2011
2012
Source: Investment Company Institute and the U.S. Federal Reserve. Assets represent retail and institutional
money market assets as well as bank deposits. Past performance is no guarantee of future results.
4
5. Volatility hit a high in its cycle
S&P 500 (VIX) Index:
A popular measure of “investor fear” (2006–2012)
Higher Volatility
60
50
Height of fear
Volatility at its highest
40
Lower Volatility
30
20
10
0
2006
2007
2008
2009
2010
2011
2012
Source: Bloomberg. The Chicago Board Options Exchange Volatility Index (VIX) is a popular measure of the volatility of S&P 500 Index
options. A high value corresponds to a more volatile market and therefore more costly options, which can be used to defray risk from
this volatility by selling options. Often referred to as the fear index, it represents one measure of the market’s expectation of volatility
over the next 30-day period. It is not possible to invest directly in an index. Past performance is no guarantee of future results.
5
8. You also run the risk
of missing the recovery
20-year growth of $10,000 (1993–2012)
Fully invested
$48,519
Missed 10 best days
$24,214
Missed 20 best days
Missed 30 best days
Missed 40 best days
$15,088
$9,968
$6,776
Source: Bloomberg.com as of 12/31/12. Stocks are represented by the S&P 500 Index, an unmanaged index commonly used to measure
stock market performance. It is not possible to invest directly in an index. This illustration in not intended to represent the performance of
any John Hancock mutual fund. Past performance is not a guarantee of future results.
8
9. What should investors remember?
Every investment has risks, even cash
When volatility is high, it’s hard to resist
the temptation to get out of the markets.
Although cash and short-term investments
seem safer, they may not keep pace
with inflation in the long term.
Unless you can time it perfectly, you may also
miss the gains when the market recovers.
The key is to be prepared for the
“certainty of uncertainty”!
Although a money market fund may seeks to preserve the value of your investment at $1.00 per share, it is possible to lose money by
investing in the fund. The value of a company’s equity securities is subject to change in the company’s financial condition, and overall
market and economic conditions.
9
11. The “lost” decade
S&P 500 Index (2000–2009)
Early 2000
Peak of tech bubble
August 2007
Credit crunch begins
Sept 11, 2001
Terrorist attack
2000
2001
2002
Sept 2008
Lehman
files for
bankruptcy
If you had invested
If you had invested
$100,000 in the
$100,000 in the
S&P 500 Index at
S&P 500 Index at
the beginning of the
decade, it would have
been worth $90,902
been worth $90,902
at the end of the
at the end of the
decade.
decade.
2003
2004
2005
2006
March 2009
Markets
hit bottom
2007
2008
2009
Source: Bloomberg as of 12/31/09. The S&P 500 Index is an unmanaged index of 500 widely traded common stocks.
It is not possible to invest directly in an index. This is a hypothetical example and does not reflect the performance
of any John Hancock fund. Past performance is no guarantee of future results.
11
12. Why are people saying
diversification is dead?
Asset class performance
Virtually
There was
everything worked!
nowhere to hide
(S&P 500)
MSCI EAFE)
erm Govt.
obal Bonds
27.7
2008
-26.4
Loans
Resources
Real Estate
ional Small
ng Markets
-1.6
-4.1
High Yield
26.5
International (MSCI EAFE)
Intl (MSCI EAFE)
-43.4
TIPS
Real Estate
Large Cap Cap (S&P 500)
Lg (S&P 500)
-37.0
-29.7
-39.6
Long-Term Government
Long-Term Govt. -17.5
Global Bonds Bonds
Global
TIPS
TIPS
-46.6
Loans
Loans
U.S. Real Estate Estate
U.S. Real
GlobalGlobal Real Estate
Real Estate
International Small Small
International
-49.0
2009
13.1
10.9
High Yield High Yield
Natural Resources
Natural Resources
-48.8
31.8
46.7
41.8
31.3
48.5
37.0
49.2
Emerging Markets
Emerging Markets
-54.4
Annual Returns (%)
73.8
Annual Returns (%)
Source: Morningstar Direct as of 12/31/09. Performance numbers reflect a total return average of funds in each Morningstar category,
assume reinvestment of all distributions and do not reflect payment of any sales charges. The S&P 500 Index is commonly used to
measure stock market performance. The MSCI EAFE Index is a large-capitalization international stock index which measures market
performance in Europe, Australasia and the Far East. Indexes are unmanaged and cannot be invested in directly. Past performance
is no guarantee of future results.
12
13. However, even over the lost decade,
diversification worked
Average annual returns by category (2000–2009)
Annual Returns (%)
15
12.2
10.6
10.5
8.7
10
6.1
6.2
6.6
4.7
5
3.8
3.6
3.5
1.2
0
Currency
Emerging
Markets
International
Small
Global Real
Estate
Natural
Resources
U.S. Real
Estate
Loans
High Yield
TIPS
Global
Bonds
Long-Term
Government
International
(MSCI EAFE)
-5
Large Cap
(S&P 500)
-1.0
Source: Morningstar Direct as of 12/31/09. Performance numbers reflect a total return average of funds in each Morningstar category,
assume reinvestment of all distributions and do not reflect payment of any sales charges. The S&P 500 Index is commonly used to
measure stock market performance. The MSCI EAFE Index is a large-capitalization international stock index which measures market
performance in Europe, Australasia and the Far East. Indexes are unmanaged and cannot be invested in directly. Past performance
is no guarantee of future results.
13
14. Understand investment cycles
― a tale of three funds
Which of these funds would you invest in?
Morningstar Peer Group Rankings and Average Annual Returns, as of 12/31/12
Fund Name
1-Year
Large-Cap Growth Fund 1
% Rank
(Average Annual Return with 5% sales charge)
Large-Cap Growth Fund 2*
% Rank
(Average Annual Return with 5% sales charge)
Large-Cap Growth Fund 3
% Rank
(Average Annual Return with 5% sales charge)
Top Quartile
2nd Quartile
3-Year
5-Year
10-Year
8
77
53
8
14.19%
5.86%
0.05%
9.18%
43
58
83
37
9.87%
6.98%
-1.99%
6.91%
12
14
4
71
13.36%
9.71%
4.44%
5.62%
3rd Quartile
4th Quartile
Source: Morningstar Direct and John Hancock Funds. Large-Cap Growth Fund 1 (John Hancock Large Cap Equity Fund) was ranked 131 of 1,681, 1,158 of 1,503, 691 of
1,301 and 67 of 863 against large growth funds for the 1-, 3-, 5- and 10-year time periods, respectively. Large-Cap Growth Fund 2 (John Hancock Rainier Growth Fund)
was ranked 730 of 1,681, 873 of 1,503, 1,084 of 1,301 and 322 of 863 against large growth funds for the 1-, 3-, 5- and 10-year time periods respectively. Large-Cap
Growth Fund 3 (John Hancock U.S. Global Leaders Growth Fund) was ranked 199 of 1,681, 201 of 1,503, 46 of 1,301 and 617 of 863 against large growth funds for the
1-, 3- 5- and 10-year time periods, respectively. Performance is for Class A shares as of 12/31/12. Rankings are based on total return and do not include sales charges.
John Hancock Large Cap Equity Fund’s total annual operating expense ratio as of the current prospectus is 1.12%. John Hancock Rainier Grwoth Fund’s net annual
operating expense ratio as of the current prospectus is 1.25%. John Hancock U.S. Global Leaders Growth Fund’s net annual operating expense ratio as of the current
prospectus is 1.26%. Expenses for other share classes will vary, which will affect returns. Performance figures assume that all distributions are reinvested.
For performance data current to the most recent month end, contact your financial professional or call John Hancock Funds at 1-800-225-5291. The performance data
contained within this material represents past performance, which does not guarantee future results. The return and principal value of an investment will fluctuate, so that
shares, when redeemed, may be worth more or less than the original cost. The Fund’s current performance may be higher or lower and is subject to substantial changes.
*On 4/28/08 John Hancock Rainier Growth Fund acquired all of the assets of the Rainier Large Cap Growth Equity Portfolio, the Fund’s predecessor, pursuant to
reorganization. Performance prior to 4/28/08 reflects the performance of the Fund’s predecessor and does not include sales charges.
14
15. Same category,
very different performance
Full market cycle coverage (2003–2012)
Large Growth Category
Fund 1
Fund 2
Fund 3
% Rank
81
Total Ret
23.29%
% Rank
16
Total Ret
33.88%
% Rank
96
Total Ret
4.14%
% Rank
18
Total Ret
11.60%
% Rank
94
Total Ret
19.24%
% Rank
44
Total Ret
8.51%
2003
2004
Top Quartile
% Rank
% Rank
% Rank
1
3
2
Total Ret Total Ret Total Ret
33.77%
16.26%
20.22%
% Rank
% Rank
% Rank
16
49
17
Total Ret Total Ret Total Ret
20.57%
11.61%
7.24%
% Rank
% Rank
59
92
Total Ret Total Ret
14.20%
-9.03%
% Rank
8
Total Ret
14.19%
% Rank
% Rank
% Rank
% Rank
77
66
38
69
Total Ret Total Ret Total Ret Total Ret
(43.89%)
31.68%
16.59%
-4.45%
% Rank
43
Total Ret
9.87%
% Rank
19
Total Ret
(36.82%)
% Rank
54
Total Ret
33.73%
% Rank
% Rank
% Rank % Rank
% Rank
86
90
91
10
14
Total Ret Total Ret Total Ret Total Ret Total Ret
3.67%
(34.77%)
44.32%
2.16%
1.44%
2005
2006
2007
2nd Quartile
2008
2009
% Rank
78
Total Ret
12.16%
2010
3rd Quartile
% Rank % Rank
12
5
Total Ret Total Ret
13.36%
3.85%
2011
2012
4th Quartile
Source: Morningstar Direct and Bloomberg. Rankings for each Fund within the Morningstar large growth fund category are based on total
return and do not include sales charges. Past performance is no guarantee of future results.
15
16. Overcoming the emotion of investing
Annual returns of asset classes (2003–2012)
2005
2006
Small/Mid
Value
21.58%
International
14.02%
International
26.86%
Small/Mid
Value
44.93%
International
20.70%
Small/Mid
Growth
8.17%
International
39.17%
Large Cap
Value
16.49%
Diversified
Portfolio
32.38%
2008
2009
2010
2011
2012
Large Cap
Growth
11.81%
Bond
5.24%
Small/Mid
Growth
41.66%
Small/Mid
Growth
28.86%
Bond
7.84%
Small/Mid
Value
19.21%
Large Cap
Value
22.25%
International
11.63%
Cash
1.40%
Large Cap
Growth
37.21%
Small/Mid
Value
24.82%
Large Cap
Growth
2.64%
International
17.90%
Small/Mid
Value
7.74%
Small/Mid
Value
20.18%
Small/Mid
Growth
9.69%
Diversified
Portfolio
-31.10%
International
32.46%
Diversified
Portfolio
16.78%
Large Cap
Value
0.39%
Large Cap
Value
17.51%
Small/Mid
Growth
14.59%
Diversified
Portfolio
7.45%
Diversified
Portfolio
15.83%
Bond
6.97%
Small/Mid
Value
-31.99%
Small/Mid
Value
27.68%
Large Cap
Growth
16.71%
Cash
0.05%
Small/Mid
Growth
16.13%
Large Cap
Value
30.03%
Diversified
Portfolio
14.00%
Large Cap
Value
7.05%
Small/Mid
Growth
12.26%
Diversified
Portfolio
5.44%
Large Cap
Value
-36.85%
Diversified
Portfolio
27.44%
Large Cap
Value
15.51%
Diversified
-0.97%
Large Cap
Growth
15.26%
Large Cap
Growth
29.75%
Large Cap
Growth
6.30%
Large Cap
Growth
5.26%
Large Cap
Growth
9.07%
Cash
4.48%
Large Cap
Growth
-38.44%
Large Cap
Value
19.69%
International
8.21%
Small/Mid
Growth
-1.57%
Diversified
Portfolio
15.04%
Bond
4.10%
Bond
4.34%
Cash
3.22%
Cash
4.85%
Large Cap
Value
-0.17%
Small/Mid
Growth
-41.50%
Bond
5.93%
Bond
6.54%
Small/Mid
Value
-3.36%
Bond
4.21%
Cash
1.03%
Worst
2004
Small/Mid
Growth
46.31%
Best
2003
2007
Cash
1.40%
Bond
2.43%
Bond
4.33%
Small/Mid
Value
-7.27%
International
-43.06%
Cash
0.15%
Cash
0.14%
International
-11.73%
Cash
0.09%
Source: Lipper, Inc. as of 12/31/12. Annual returns are based on calendar years. Indexes are unmanaged and do not take transaction costs or fees into consideration.
Performance figures assume reinvestment of dividends and capital gains. This chart is for illustrative purposes only and does not represent the performance of any John
Hancock fund. Large Growth is represented by the Russell 1000 Growth Index, a market capitalization weighted index of securities in the Russell 1000 Index with higher
price-to-book ratios and higher forecasted growth values. Large Value is represented by the Russell 1000 Value Index, a market capitalization-weighted index of
securities in the Russell 1000 Index with lower price-to-book ratios and lower forecasted growth values. Small/Mid growth is represented by the Russell 2500 Growth
Index, which measures the performance of those Russell 2500 companies with higher price-to-book ratios and higher forecasted growth values. Small/Mid Value is
represented by the Russell 2500 Value Index, which measures the performance of those Russell 2500 companies with lower price-to-book ratios and lower forecasted
growth values. International is measured by the MSCI EAFE Index, a market value-weighted, arithmetic average of the performance of more than 900 securities listed in
several developed world markets, excluding the United States. Bond is measured by the Barclays U.S. Aggregate Bond Index, which includes U.S. government,
corporate, and mortgage-backed securities with maturities up to 30 years. Cash represents the performance of the 3-month T-bill, published by the Federal Reserve.
Diversified Portfolio is represented by the average return of the six indexes above, excluding cash. It does not represent any specific index. It is not possible to invest
directly in an index. Diversification does not guarantee against a loss. Past performance is no guarantee of future results.
16
17. What should investors remember?
Asset allocation is not dead, but it is misunderstood
Judging the entire market by the performance
of the S&P 500 Index is not diversifying.
Asset allocation and diversification are long-term
strategies — they may appear not to work over
short periods, but they do work long term.
Go deeper with diversification and include
more asset classes, styles and managers.
Asset allocation and diversification do not guarantee a profit nor protect against a loss. The value of a company’s equity securities is
subject to change in the company’s financial condition, and overall market and economic conditions. Fixed-income investments are
subject to interest-rate and credit risk; their value will normally decline as interest rates rise or if the creditor is unable or unwilling to
make principal or interest payments. Foreign investing, especially in emerging markets, has additional risks such as currency and market
volatility and political and social instability.
17
19. When stocks are volatile, it’s common
to seek the “safety” of bonds
Net fund flows
($ Millions)
Barclays Capital U.S.
Aggregate Bond Index
Bond Fund Flows
25
*
Bond Returns
20
15
10
5
0
Q4 ’08
Large outflow
2003
2004
2005
2006
2007
-5
2008
2009
2010
2011
2012
-10
Source: ICI and Lipper. Bond funds are based on the trailing 12-month return of the Barclays U.S Aggregate Bond Index, which
is comprised of government securities, mortgage-backed securities, asset-backed securities and corporate securities to simulate the
universe of bonds in the market. Its is not possible to invest directly in an index. Past performance is no guarantee of future results.
*Bond mutual funds.
19
20. Different bonds
perform differently, though
Federal funds target rate and fixed-income total returns
6
5
4
3
2
1
0
(%)
2004
High Yield
28.15%
Foreign
Bonds
12.14%
Foreign
Bonds
18.52%
2005
2008
Bank Loans
5.69%
High Yield
11.72%
Government
Bonds
12.39%
High Yield
10.87%
Municipal
Bonds
3.51%
Bank Loans
7.33%
Government
Bonds
8.66%
Bank Loans
5.60%
High Yield
2.74%
Foreign
Bonds
6.94%
Corporate
Bonds
5.41%
Government
Bonds
2.65%
Municipal
Bonds
5.31%
Municipal
Bonds
4.48%
Government
Bonds
2.36%
Government
Bonds
3.48%
2009
2010
2011
2012
High Yield
57.51%
High Yield
15.19%
Municipal
Bonds
10.70%
High Yield
15.59%
Foreign
Bonds
10.11%
Bank Loans
44.87%
Bank Loans
9.98%
Government
Bonds
9.02%
Corporate
Bonds
10.37%
Corporate
Bonds
4.64%
Municipal
Bonds
-2.47%
Corporate
Bonds
19.76%
Corporate
Bonds
9.52%
Corporate
Bonds
7.51%
Bank Loans
9.43%
Municipal
Bonds
4.84%
Municipal
Bonds
3.36%
Corporate
Bonds
-6.82%
Municipal
Bonds
12.91%
Government
Bonds
5.52%
Foreign
Bonds
5.17%
Municipal
Bonds
6.78%
Corporate
Bonds
1.97%
Corporate
Bonds
4.38%
High Yield
2.24%
High Yield
-26.39%
Foreign
Bonds
4.39%
Foreign
Bonds
5.21%
High Yield
4.38%
Government
Bonds
2.02%
Foreign
Bonds
-9.20%
Government
Bonds
3.48%
Bank Loans
1.88%
Bank Loans
-28.75%
Government
Bonds
-2.20%
Municipal
Bonds
2.38%
Bank Loans
1.82%
Foreign
Bonds
1.51%
1/2/200
2
2/1/200
2
3/1/200
2
4/1/200
2
5/1/200
2
6/3/200
2
7/1/200
2
8/1/200
2
9/3/200
2
10/1/20
02
11/1/20
02
12/2/20
02
1/2/200
3
2/3/200
3
3/3/200
3
4/1/200
3
5/1/200
3
6/2/200
3
7/1/200
3
8/1/200
3
9/2/200
3
10/1/20
03
11/3/20
03
12/1/20
03
1/2/200
4
2/2/200
4
3/1/200
4
4/1/200
4
5/3/200
4
6/1/200
4
7/1/200
4
8/2/200
4
9/1/200
4
10/1/20
04
11/1/20
04
12/1/20
04
1/3/200
5
2/1/200
5
3/1/200
5
4/1/200
5
5/2/200
5
6/1/200
5
7/1/200
5
8/1/200
5
9/1/200
5
10/3/20
05
11/1/20
05
12/1/20
05
1/3/200
6
2/1/200
6
3/1/200
6
4/3/200
6
5/1/200
6
6/1/200
6
7/3/200
6
8/1/200
6
9/1/200
6
10/2/20
06
11/1/20
06
12/1/20
06
1/3/200
7
2/1/200
7
3/1/200
7
4/2/200
7
5/1/200
7
6/1/200
7
7/2/200
7
8/1/200
7
9/4/200
7
10/1/20
07
11/1/20
07
12/3/20
07
1/2/200
8
2/1/200
8
3/3/200
8
4/1/200
8
5/1/200
8
6/2/200
8
7/1/200
8
8/1/200
8
9/2/200
8
10/1/20
08
11/3/20
08
12/1/20
08
1/2/200
9
2/2/200
9
3/2/200
9
4/1/200
9
5/1/200
9
6/1/200
9
7/1/200
9
8/3/200
9
9/1/200
9
10/1/20
09
11/2/20
09
12/1/20
09
1/1/201
0
2/1/201
0
3/1/201
0
4/1/201
0
5/1/201
0
6/1/201
0
7/1/201
0
8/1/201
0
9/1/201
0
10/1/20
10
11/1/20
10
12/1/20
10
201
1-01
201
1-02
201
1-03
201
1-04
201
1-05
201
1-06
201
1-07
201
1-08
201
1-09
201
1-10
201
1-11
201
1-12
201
2-01
201
2-02
201
2-03
201
2-04
201
2-05
201
2-06
201
2-07
201
2-08
201
2-09
201
2-10
201
2-11
201
2-12
2007
Foreign
Bonds
11.45%
Corporate
Bonds
8.31%
Best
2006
Bank Loans
11.01%
Worst
2003
Source: Lipper, Inc. and the U.S. Federal Reserve Board. Foreign Bonds are represented by the Citigroup World Government Bond Index, which consists of
approximately 600 high-quality bonds issued by 17 different foreign countries. High-Yield Bonds are represented by the Bank of America Merrill Lynch High Yield
Master II Index, which is composed of U.S. currency high-yield bonds issued by U.S. and non-U.S. issuers. Corporate Bonds are represented by the Bank of America
Merrill Lynch U.S. Corporate Master Index, which is composed of U.S. dollar-denominated investment-grade corporate public debt issued in the U.S. domestic bond
market. Municipal Bonds are represented by the Barclays Municipal Bond Index, an unmanaged index representative of the tax-exempt bond market. Government
Bonds are represented by the Barclays U.S. Government Bond Index, an unmanaged index of U.S. Treasury and government agency bonds. Bank Loans are
represented by the Credit Suisse (CS) Leveraged Loan Index, which tracks returns in the leveraged loan market. It is not possible to invest directly in an index.
Performance figures assume reinvestment of dividends and capital gains. This chart does not illustrate the performance of any John Hancock fund. Past performance
is not a guarantee of future results.
20
21. Understanding bond risks
is more important than ever
Investors should consider diversifying among
bonds with varying risk sensitivities
Interest-Rate Sensitivity
Government Bonds
Municipal Bonds
Corporate Bonds
High-Yield Bonds
Foreign Bonds
Bank Loans
Little
Somewhat
Moderate
Credit Sensitivity
High
Interest-rate and credit sensitivity are provided by John Hancock Funds estimates and subject to change. Interest-rate sensitivity is the
measure of how sensitive the value of fixed-income investment is to changes in interest rates. Generally the value of a fixed-income
investment will decline as interest rates rise. Credit sensitivity measures the risk that the creditor will be unable or unwilling to make
principal or interest payments. Government bonds are represented by the Barclays U.S. Government Bond Index, an unmanaged index of
U.S. Treasury and government agency bonds. Municipal bonds are represented by the Barclays Municipal Bond Index, an unmanaged index
representative of the tax-exempt bond market. Corporate bonds are represented by the Bank of America Merrill Lynch U.S. Corporate
Master Index, which is composed of U.S. dollar-denominated investment-grade corporate public debt issued in the U.S. domestic bond
market. High-yield bonds are represented by the Bank of America Merrill Lynch U.S. High Yield Master II Index, which is composed of U.S.
currency high-yield bonds issued by U.S. and non-U.S. issuers. Bank loans are represented by the Credit Suisse (CS) Leveraged Loan Index,
which tracks returns in the leveraged loan market. It is not possible to invest directly in an index. This chart does not illustrate the
performance of any John Hancock fund. Asset allocation and diversification do not guarantee a profit nor protect against a loss.
21
22. Balancing risk with yield
Fixed income yields (2006–2012)
20
Yield (%)
16
High Yield Bonds
Corporate Bonds
Government Bonds
Inflation
12
8
6.31
4
Inflation 2.98%
0
2.78
1.05
2012
2006 2007
2007 2008
2008 2009
2009 20102010 201120112012
2006
Source: Bloomberg as of 12/31/12. High-yield bonds are represented by the Bank of America Merrill Lynch High Yield Master II Index, which is
composed of U.S. currency high-yield bonds issued by U.S. and non-U.S. issuers. Corporate bonds are represented by the Bank of America
Merrill Lynch U.S. Corporate Master Index, which is composed of U.S. dollar-denominated investment-grade corporate public debt issued in
the U.S. domestic bond market. Government bonds are represented by the Bank of America U.S. Treasury Master Index, an unmanaged index
of U.S. Treasury and government agency bonds. Inflation is measured by the Consumer Price Index published by the U.S. Bureau of Labor
Statistics. It is not possible to invest directly in an index. Performance figures assume reinvestment of dividends and capital gains. This
chart does not illustrate the performance of any John Hancock fund. Past performance is not a guarantee of future results.
22
23. What should investors remember?
Not all bonds — or bond funds — are created equal
Holding bonds in your portfolio may provide the
income you need with less volatility than stocks.
Different types of bonds perform well in
different economic environments.
Bond funds should be diversified too.
Fixed-income investments are subject to interest rate and credit risk; their value will normally decline as interest rates rise or if the
creditor is unable or unwilling to make principal or interest payments. Investments in higher-yielding, lower-rated securities involve
additional risks as these securities include a higher risk of default and loss of principal. Asset allocation and diversification do not
guarantee a profit nor protect against a loss.
23
25. Tough decade for stocks
S&P 500 Index
12/31/1972
– 6/30/1975
$14,000
$12,000
$10,000
$8,000
’73
’74
’75
Source: Lipper. 12/31/1972 to 6/30/1975. The S&P 500 Index is an unmanaged index that includes 500 widely traded stocks.
It is not possible to invest directly in an index. Past performance is no guarantee of future results. The performance shown is not
reflective of any John Hancock fund.
25
26. Put the market in perspective
S&P 500 Index (1970–2012)
Thousands
$800
$600
$400
$200
2012
2010
2008
2006
2004
2002
2000
1998
1996
1994
1992
1990
1988
1986
1984
1982
1980
1978
1976
1974
1972
1970
$0
Source: Lipper. 1/1/1970 to 12/31/2012. The S&P 500 Index is an unmanaged index that includes 500 widely traded stocks.
It is not possible to invest directly in an index. Past performance is no guarantee of future results. The performance shown is not
reflective of any John Hancock fund.
26
29. Impact of dividend reinvestment
Hypothetical growth of $10,000 (1970–2012)
$600,000
Are Dividends Important?
$500,000
$400,000
$300,000
$200,000
Without dividends
$154,919
$100,000
$0
'70
'75
'80
'85
'90
'95
'00
'05
'10
Source: Lipper, Inc. The S&P 500 Index is an unmanaged index of common stocks used to measure stock market performance.
It is not possible to invest directly in an index. Past performance is no guarantee of future results.
29
30. Impact of dividend reinvestment
Hypothetical growth of $10,000 (1970–2012)
$700,000
$600,000
$588,626
$500,000
$400,000
$300,000
With dividends
$200,000
Without dividends
$154,919
$100,000
$0
'70
'75
'80
'85
'90
'95
'00
'05
'10
Source: Lipper, Inc. The S&P 500 Index is an unmanaged index of common stocks used to measure stock market performance.
It is not possible to invest directly in an index. Past performance is no guarantee of future results.
30
32. What should investors remember?
Yes, it’s STILL stocks for the long run!
Equities remain a great way to fight
inflation over the long term.
By maintaining a long-term perspective,
you will be better positioned to maintain a
rationale mindset during periods of volatility.
Reinvesting dividends can enhance total return.
The value of a company’s equity securities is subject to change in the company’s financial condition,
and overall market and economic conditions. Past performance is no guarantee of future results.
32
34. Well known U.S. brands?
Are the following companies U.S. or foreign based?
Dow Jones
Gerber
Australia
Australia
Switzerland
Switzerland
Budweiser
adidas
7-Eleven
Belgium
Belgium
Germany
Germany
Japan
Japan
This not a recommendation to buy or sell any security.
For current holdings of any John Hancock fund visit our Web site at www.jhfunds.com.
34
35. Opportunities outside the
U.S. continue to increase
The shift in the U.S. market’s
size versus the rest of the world
34%
66%
45%
55%
1970
1970
32%
68%
2011
2011
2030
2030
Projected
Source: Standard and Poor’s (2011). Estimates are based on the rate of growth of non-U.S. markets vs. U.S. markets since 1970.
35
36. More growth outside the U.S.
Real gross domestic product (GDP) growth
10
Emerging & Developing Economies
8
World Economies
U.S. Economy
6
4
2
0
-2
-4
1980
1985
1990
1995
2000
2005
2010
2015
Projected
Source: International Monetary Fund as of December 2010. Estimates are based on data and projections from 183 economies and
maintained jointly by the IMF’s Research Department and regional departments. The growth indicators are estimated using a statistical
model that is measured at a monthly frequency and is based on retail sales, industrial production, trade, financial conditions,
employment, and income as well as price and costs of consumer indexes.
36
37. Better performance outside the U.S.
Top ten stock returns by country (1993–2012)
14.86
Peru
Columbia
13.94
Brazil
12.58
Denmark
12.53
Poland
11.64
Finland
10.90
Canada
8.76
Mexico
8.70
Norway
8.55
Chile
United States
United States
7.96
6.24
17th
Average Annual Return (%)
Source: Lipper as of 12/31/12. Performance is represented by each country’s specific MSCI country index. Each MSCI country index
measures a country’s stock market performance by identifying each security in a specific country’s market. It is not possible to invest
directly in an index. Past performance is no guarantee of future results.
37
38. What should investors remember?
Investing abroad shouldn’t be a foreign experience
Foreign companies offer some of the
best opportunities for growth.
Diversifying with foreign companies
may actually improve returns while
also reducing overall portfolio volatility.
Foreign investing, especially in emerging markets, has additional risks such
as currency and market volatility and political and social instability.
38
41. But invest for the long term
Market performance
Positive
EUPHORIC
“I should quit my job and do this full-time!
Look at the money I’m making!”
Best opportunity
to make money
Nervous
Confident
“What happened?
What is going on?”
“I’ve already
made money.
This is great.”
Hopeful
Desperate
Riskiest
time
“Things seem
like they’re
turning around.”
“There’s no
point in selling
now, I’ve lost
too much.”
DEFEATED
Negative
“There go my dreams of
an early retirement.”
This hypothetical scenario is for illustration purposes only and is not a prediction of future market conditions.
41
42. Twelve fundamental truths of investing
1
Over the long term, stocks have had greater total returns than bonds.
2
Over the long term, bonds have had greater total returns
than money market funds.
3
On average, stocks are much riskier than bonds.
4
On average, bonds are much riskier than money market funds.
5
You will make investments that go down immediately after you buy.
6
You will sell investments that continue to go up after you are out.
7
You will hold some investments too long.
8
The value of opportunities missed will dramatically exceed
those in which you participate.
9
Someone, or some group of people, will always do better than you.
10
11
12
You don’t pay a financial advisor for information ―
you are paying for knowledge, wisdom and personal guidance.
Accept uncertainty.
No one knows where the market will be next week, next month or next year.
Money can only be made in the future ― it’s impossible to invest in past returns.
Source: Horsesmouth LLC.
42
43. A word about risk
The performance data contained in this presentation represents
past performance, which does not guarantee future results.
Performance, especially for short time periods, should not
be the sole factor in making your investment decisions.
A fund’s investment objectives, risks, charges and expenses should be considered before
investing. The prospectus contains this and other important information about the fund.
To obtain a prospectus, call your financial professional or John Hancock Funds at
1-800-225-5291 or visit our Web site at www.jhfunds.com. Please read the
prospectus carefully before investing or sending money.
John Hancock Funds, LLC •
MEMBER FINRA/SIPC
• 601 Congress Street, Boston, MA 02210-2805 • www.jhfunds.com
NOT FDIC INSURED. MAY LOSE VALUE. NO BANK GUARANTEE. NOT INSURED BY ANY GOVERNMENT AGENCY.
LLCP 2/13
43
Editor's Notes
Welcome to Lessons Learned 2013. I am delighted to be here to share five proven principles for today’s investors. My name is ___ and I’m a ___ at ___.
We’ll share the 5 “lessons” by examining both short and long-term market history.
Now, some of you may be wondering, “How can looking back help me decide how I invest in the future?”
A quote from over 100 years ago by Mark Twain best captures the reason why future-focused investors should also study the past: “History doesn’t repeat itself, but it rhymes.”
What Mark Twain’s quote means to me is that by studying the past, we’re not looking for an exact duplication of events, but rather the “rhymes.” This can help us gain insight into the market’s behavior, which is influenced by people’s behavior.
I believe there are “rhymes” that can not only help investors pursuing their goals but that are core principles. These principles form our Agenda for today’s presentation and I would like to present them to you.
Every investment has risks, even cash.
Diversification is not dead, it’s just misunderstood.
Not all bonds — or bond funds — are created equal.
Yes, it’s STILL stocks for the long run.
Investing abroad shouldn’t be a foreign experience.
Our first principle is: Every investment has risks – even cash.
It is no surprise that over the last several years, many investors have flocked to cash and left their stock and bond investments behind. Take a look at this chart and you can see the surge in savings and money market instruments from 2006 through 2012.
Why did investors put so much of their assets in cash? This chart further explains why cash has been so popular for many investors. It follows the S&P 500 (VIX) Index, which measures “investor fear” and focuses on 2005 through 2012. This index represents the market's expectation of volatility over the upcoming 30-day period.
As you can see, volatility reached its peak in 2008. Are you surprised to see that “investor fear” also peaked at that point?
When market volatility and fear are at their highest, it’s understandable that many investors want to get out of stocks and bonds and into cash, which is less volatile.
Although cash is viewed by many investors as a safe haven, there is a problem with moving all of one’s money to cash. This is the threat of inflation.
Take a look at the chart. It represents the average annual returns of stocks and cash equivalents, and then it compares them to the real returns. Real return is the average annual return minus the effects of taxes and inflation. You can see the difference between the two is striking. Since 1926, your real return for cash equivalents was just 0.54%!
This leads to an important fact. Although cash and short-term investments are typically safer in the short term, they have not kept pace with inflation in the long term.
Does anyone know the Rule of 72?
(Take a minute for responses.)
The Rule of 72 is a simple calculation to determine how long it takes to double your money. Here’s a compelling example. We learned that if you calculate the return you got in a savings account, and factor inflation, your real return was just 0.54% over the past 87 years. By using the Rule of 72, it would take 133 years to double your money!
There is another problem with moving all of your investments to cash — it’s the risk of missing out on the recovery.
This chart shows that between 1993 and 2012, investors who missed just the 10 best days in the market had significantly lower returns. The more good days they missed being in the market, the worse their returns got.
However, if investors stayed fully invested in the market from 1993 through 2012, their returns would have been considerable.
So what should investors remember about cash?
When volatility is high, it’s hard to resist the temptation to get out of the markets and into cash, but strive to keep your emotions in check.
Although cash and short-term investments are typically safer in the short-term, they may not keep pace with inflation in the long term.
By being out of the market, you are likely to miss the gains when the market recovers — and these recoveries are typically sudden and often dramatic.
The key is to be prepared for the “certainty of uncertainty”!
The next principle is: Diversification is not dead, it’s just misunderstood.
Let’s start by looking at the last decade, which has been referred to as the “lost” decade. Why?
As you can see in the chart, in the beginning of the 2000s, the tech boom was peaking, but it soon became a bust. Then came September 11, 2001, and the Afghanistan and Iraq wars. The market recovered by mid-decade. Then the credit crisis emerged, which sent markets around the world tumbling. This prompted fears of a second Great Depression and created the Great Recession. The low point came when the S&P 500 Index closed down 37% in 2008. As the decade ended, the market was down.
Consider this sobering fact: If you invested $100,000 in the S&P 500 Index in 2000, you would have ended up with only $90,902 at the close of the decade.
The 2000s were the worst calendar decade for stocks going all the way back to the 1930s! Even the 1970s, when the bear market was coupled with inflation, weren’t as bad as the most recent decade. During the 1970’s, the S&P 500 Index still managed to gain 5.87%. This was not the case in the 2000s.
Take a look at the chart on the left and you can see that in 2008, there was nowhere to hide. Nearly all asset classes were down.
However, the situation was reversed by the end of 2009. Look at the chart on the right and you can see that virtually all asset classes were up in 2009.
When everything moves in the same direction, it’s not surprising that some people felt that diversification was no longer relevant. Some people even felt that diversification was dead. But was diversification really dead?
My position is that diversification still matters, and it worked even in the “lost” decade. What happened is that many investors just misunderstood the meaning of diversification.
For example, it was common for people to believe that owning an S&P 500 Index fund was being diversified. In reality, the S&P 500 Index only represents one part of the market. There were many other asset classes that had positive returns this past decade.
Now, with their financial advisors’ guidance, investors are being encouraged to view diversification as part of a long-term investing approach. This includes maintaining an asset allocation strategy and staying invested in the market during volatile periods.
Of course, asset allocation and diversification may not seem to be relevant over a short time period, such as 2008, but they do work over the long term — and they even worked during the Great Recession.
The lesson here is that investors need to go deeper with diversification – using more asset classes and investment styles.
Let’s explore the concept of deeper diversification a bit more and, in the process, understand how investment cycles may impact your portfolio. I would like to present a “tale of three funds.”
Please take a look at the three funds listed here. All three funds are large growth funds but, as you can see, their performance varies over different time periods. This is illustrated by their percentile rankings in the Morningstar large growth fund category.
If you had to choose just one of these funds to include in your portfolio, which one would it be?
The chart above makes a key point: diversification can be important even within an asset class. Let’s look at these three funds in the same category, over a full market cycle, they can have very different performance.
As you can see, leadership, or top quartile performance, within the large growth fund category, as represented by the green boxes, changed from year to year. All three funds experienced top performance at different times in the market cycle.
This illustrates how important it is to have more than one fund within a particular category, which has the potential to smooth out overall portfolio performance over time.
Along with diversifying among asset classes, it is essential to consider diversifying within asset classes too.
The point is that diversification still matters in overcoming the emotions of investing.
Maintaining a diversified portfolio may help minimize losses and help moderate market ups and downs because investors are likely to stay in the market during volatile times and participate in a rebound when it occurs.
Look at the chart and you’ll see two important principles in action:
First, it’s impossible to predict which sector or style will be the best performer in any given year. In the past 10 years alone, five different types of investments have been at the top for at least one calendar year.
Second, allocating one’s assets among different types of asset classes cushions a portfolio in difficult markets without sacrificing growth potential.
I’d like to recap this section by reminding you that asset allocation is not dead, it’s just misunderstood.
Judging the entire market by the performance of the S&P 500 Index is not diversifying.
Asset allocation and diversification are long-term strategies — they may appear not to work over short time periods, but they do work in the long term.
Go deeper with diversification and include more asset classes, styles and managers.
The next principle is: Not all bonds — or bond funds — are created equal.
Let’s start with this reality. When stocks are volatile, it’s common for some investors to seek the “safety” of bonds.
This chart demonstrates the point. The line shows the return of the Barclays U.S. Aggregate Bond Index. The bars represent the amount of money flowing into or out of bond mutual funds. Clearly, investors’ emotions were a major factor in their investment decisions, which, as you can see, did not always work in their favor.
As we discussed in the first section, many investors flock to less volatile investments when the market tumbles, but they often miss out on the gains when the market recovers — and recoveries are frequently sudden and unexpected. The chart also shows that investors sought the “safety” of bonds at the beginning and the end of the 2000s.
But it’s important for investors to recognize that different bonds perform differently.
The top chart shows the impact of the Federal fund’s target rate on fixed- income total returns. The Federal fund’s target rate is one of the Federal Reserve’s principal tools for implementing monetary policy. When the rate changes, or is even expected to change, it can affect the performance of fixed-income investments.
However, not all fixed-income investments react, or perform, alike, as you can see from the bottom chart, which represents the returns of different bond sectors from 2003 to 2012. Since it’s difficult to predict which fixed-income sector will outperform in any period, it’s smart to consider diversifying your bond investments just as you would your equities.
Over the past few years, understanding the risks of bonds is more important than ever. Investors should consider diversifying among bonds with varying risk sensitivities.
Let me explain this a bit more.
This chart offers a quick comparison of the risks of different types of bond investments. You can see that holding any one bond would leave an investor open to a certain type of risk. However, by owning different bonds, with different types of risk, investors can help protect their portfolios against interest rate changes and credit risk, smooth out the overall volatility of their bond investments and increase their potential return.
This brings us to the next point: balancing risk with yield.
This graph shows yield spreads from 2006 to 2012. As you can see, bond yields rose in 2008 and 2009, as investors left the stock market. More recently, however, yields returned to their historical norms.
You can also see that government bonds have not always kept pace with inflation. However, a number of investors went to government bonds during this period because they did not have the volatility of stocks. Of course the downside was their low yields.
I’d like to recap this section by asking you to remember that not all bonds — or bond funds — are created equal.
Holding bonds in your portfolio may provide the income you need with less volatility than stocks.
Different types of bonds perform well in different economic environments, so bonds with varying risk sensitivities can help stabilize the performance of a portfolio.
Bond funds should be diversified, too. Holding multiple bond funds in a portfolio can help balance risk with yield.
One final point: As you know, bonds play an important role in most investors’ portfolios, and the same care and attention should be given to diversifying a bond portfolio as is given a stock portfolio.
The next principle is: Yes, it’s STILL stocks for the long run.
The last decade was certainly tough for stocks — especially considering the credit crisis in 2008. If you look at this dip in the S&P 500 Index, it appears massive. It’s no wonder many fearful investors considered taking money out of stocks and moving to the sidelines. (click)
Interestingly, this visual is not the recent collapse, it is the S&P 500 Index from 1972 to 1975, and the severe dip is the market crash of 1974.
Now, let’s put this event in perspective …
As you can see, over the long term, the market crash of 1974 is barely noticeable. And in 20 or 30 years, the recent bear market may look the same.
In the future, during periods of market volatility, remember the importance of a long-term perspective. Keep in mind that by looking at the big picture, you may be able to maintain a rational mindset.
The point is that over the long-term, stocks have outperformed all other asset classes, as shown in this slide, which presents average annual returns from 1926 to 2012.
Let’s briefly look at how different types of investments performed and compare this to the inflation rate, as measured by the Consumer Price Index (CPI).
Stocks9.85%
Corporate Bonds6.11%
Long-Term Government Bonds5.69%
Cash Equivalents 3.54%
Inflation, as measured by the CPI 2.98%
It’s evident that stocks far surpassed other asset classes, however the key is to remember these are long-term returns. Also remember that equities remain a great way to fight inflation over the long term.
Another way to evaluate current conditions is to look at stock market returns over a longer time frame. This chart shows rolling 10-year stock market returns.
What’s significant is that since 1926, 10-year stock market returns experienced such a wide range of returns — from double-digit gains to losses. However, delve a little deeper and you’ll see that the number of losses over a 10-year period is very rare. Investors were much more likely to get a return of 8% to 10% or even 16% to 18% if they remained invested for the long term.
Another important factor is the impact of dividend reinvestment. To understand this, take a look at the chart. If you invested $10,000 in 1970 it would be worth $154,919 if you did not reinvest dividends.
Now look at an investment’s return with dividends reinvested. If you invested $10,000 in 1970, it would be worth $588,626 if you reinvested dividends.
Dividends can definitely have an impact on an investment. Add the power of compounding over time, and dividends can drive an investment’s total returns. Clearly, reinvesting dividends is a time-tested way to enhance total return.
The important thing to ask yourself when considering equities is “what is my investment horizon?” As I mentioned earlier, stocks still remain essential in the long run — and investment returns bear this out. The chart showing annual total returns, including the last decade (also known as the “lost” decade), demonstrates the power of staying invested in stocks. Keep in mind, we are looking at 20-, 25-, 30- and 35-year time periods.
This message will likely appeal to investors in their 20s and 30s who are saving for retirement but also have many years to go. It can also resonate with investors in their 40s, 50s and even 60s, who have at least a 20-year time horizon for their investments.
I’d like to recap this section by asking you to remember that yes, it’s still stocks for the long run.
Equities remain a great way to fight inflation over the long term.
By maintaining a long-term perspective when it comes to equities, you may be better positioned to maintain a rationale mindset during periods of great volatility.
Reinvesting dividends can enhance total return.
The next principle is: Investing abroad shouldn’t be a foreign experience.
Let me start by asking you a simple question: are the following brands U.S. or foreign based?
(Take time for responses.)
Opportunities outside the U.S. continue to increase. Consider what’s happened since 1970 in terms of foreign companies’ market capitalization compared to U.S. companies.
In 1970, U.S.-based stocks represented 66% of the total market cap and foreign stocks represented 34%. By 2011, U.S.-based stocks represented 45% of the market cap and foreign stocks represented 55%. It’s anticipated that by 2030, the percentages will almost be reversed from their positions in 1970 with U.S.-based stocks representing 32% of total market cap and foreign companies representing a sizeable 68%!
To elaborate a bit more, this chart shows the current and expected growth of economies outside of the U.S. It compares the gross domestic product of the U.S. to emerging and developing economies and world economies.
It’s clear that dynamic investing opportunities currently exist beyond our borders and are likely to continue in the future.
Finally, consider this chart, which presents the top ten stock returns by country from 1993 through 2012.
You can see there was strong performance outside of the U.S. We ranked 17th, which means that sixteen other countries experienced faster growth!
What’s more, diversifying with stock or bond funds that invest in foreign securities has the potential to reduce overall volatility in your portfolio.
Just like diversifying bonds and stocks makes for a stronger portfolio, diversifying investments throughout the world helps smooth out the risk of investing in individual countries.
I’d like to recap this section by asking you to remember that investing abroad shouldn’t be a foreign experience.
Foreign companies offer some of the best opportunities for growth.
Diversifying with foreign companies may actually improve returns while reducing overall portfolio volatility.
Just as you appreciate different countries’ foods, music, movies and literature, consider funds that invest in foreign stocks and bonds.
In this presentation, we looked at five investing principles that can help you understand how the past may affect the future. Remember the Mark Twain quote: “History doesn’t repeat itself, but it rhymes.”
So, where do we go from here?
In thinking about future returns, I encourage you to remember that the stock market is a market of extremes. Let me explain this a bit more by turning to the chart:
If we divide the calendar year returns from 1926 through 2012 into three broad buckets, the years that the market declined are on the left.
The years that the market experienced returns between 0% to 20% are in the middle.
The years that the market’s total return exceeded 20% are on the far right.
Which of these three buckets do you think contains the largest number of calendar years?
For many people, the logical assumption is that the middle bucket, with returns between 0% to 20% holds the greatest number of occurrences. Let’s take a look.
Down years for the market occurred 24 times in the past.
The market posted returns of 0% to 20% only 31 years or 36% of the time.
The most common occurrences have been years when the market was up more than 20%. This has occurred 32 times or 37% of the time. If you expect an average annual return of 8% to 12%, it has only happened five times since 1926! What you should expect is what the market has always been – a market of extremes.
In thinking about where we go from here, remember that investing for the long term makes sense.
Often, investors’ emotions have a direct impact on investors’ actions, and emotions can drive investing success as much as the market’s performance.
The emotional rollercoaster illustrated in the slide can take a toll on an investor’s psyche as well as an investor’s finances.
This emotional rollercoaster is why I encourage you to develop a long-term plan that reflects your unique financial goals, time frame and comfort with investment risk, among other key factors … and then stick to it! Planning and a long-term focus are key.
In the end, there are some fundamental truths that every investor should keep in mind. Remember these truths and you are likely to have a different, more realistic view of the markets.
1.Over the long term, stocks have had greater total returns than bonds.
2.Over the long term, bonds have had greater total returns than money market funds.
3.On average, stocks are much riskier than bonds.
4.On average, bonds are much riskier than money market funds.
5.You will make investments that go down immediately after you buy.
6.You will sell investments that continue to go up after you are out.
7.You will hold some investments too long.
8.The value of opportunities missed will dramatically exceed those in which you participate.
9.Someone, or some group of people, will always do better than you.
10.You don’t pay a financial advisor for information ― you are paying for knowledge, wisdom and personal guidance.
11.Accept uncertainty. No one knows where the market will be next week, next month or next year.
12.Money can only be made in the future ― it’s impossible to invest in past returns.
Before we wrap up, I would like to talk briefly about investment risk. Please remember that the performance data contained in this presentation represents past performance, which does not guarantee future results. Performance, especially for short time periods, should not be the sole factor in making your investment decisions.
You have been a great audience. Thank you for your interest, involvement and insight … and I would like to open this up to your questions.