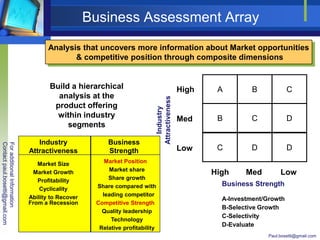
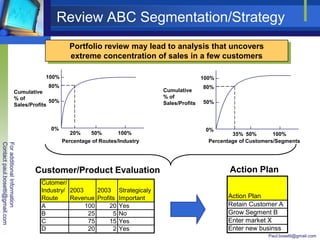
The document provides a framework for product portfolio analysis with the goal of achieving growth while managing risk. It includes steps to build the current state through business and competitive analysis, define the future state to ensure long-term profits, and execute detailed implementation plans. Various matrices and analyses are presented to evaluate industry attractiveness, business strength, market share, and segmentation to guide strategic portfolio decisions.
Effective Sales Lead Generation (Forte Consultancy Group)Berkin Ozmen
The document discusses strategies for boosting sales through lead generation. It identifies five key external sources: existing customers, independent agents, channel partners, business partners, and lists. It provides examples of partner programs and emphasizes creating win-win scenarios to motivate referrals. Effective reward mechanisms, warm referral programs, and partnerships with complementary companies that serve priority segments are presented as ways to rapidly expand the accessible customer base.
The document discusses building a social-ready enterprise and the role of Chief Marketing Officers (CXOs). It addresses the challenges of competing in a social economy through branding and lead generation. It emphasizes the need for a social-ready organization with an integrated strategy, appropriate technology, and supporting processes. The document provides examples of social media applications and considerations for a social media strategy, technology infrastructure, operational processes, engagement of stakeholders, and platform access policies. It stresses assessing an organization's social-readiness across these three competency areas of strategy, technology, and processes.
The document outlines a strategy for shifting from company-driven communications to customer-centric engagement using multi-channel approaches. It proposes segmenting and profiling customers to customize solutions, messages, timing of communications, and channels based on customers' usage, needs, and behaviors. Sample messaging guidelines, solution plans, and a communication stream map are provided as examples of how to synchronize personalized engagements across multiple touchpoints over time. The goal is to build ongoing relationships through relevant, targeted interactions on the most effective channels.
Ge mc kinsey matrix powerpoint presentation slides ppt templatesSlideTeam.net
The GE-McKinsey Matrix is a tool that evaluates business units based on their market attractiveness and competitive strength. It divides businesses into nine categories: stars, question marks, cash cows, and dogs. Stars have high market attractiveness and strength and should receive investment. Question marks have high market attractiveness but low strength and require focus strategies. Cash cows have low attractiveness but high strength and generate cash flow. Dogs have low attractiveness and strength and should be divested from or exited.
This document contains a presentation by Best Buy Co., Inc. to the William Blair Growth Stock Conference on June 18, 2008. The presentation discusses Best Buy's history of revenue and earnings growth, fiscal year 2009 guidance, opportunities for international growth through new ventures and categories, and strategies for expanding in markets like Canada, China, and Europe through a new joint venture with Carphone Warehouse. The presentation outlines Best Buy's vision of achieving significant market share globally in the consumer electronics retail industry.
This document discusses important topics in B2B marketing. It begins by asking what really matters in B2B marketing and provides an agenda that covers why the reader should tune in, what B2B marketing is, and what matters most in B2B. It then delves into various aspects of B2B marketing such as the differences between marketing and sales, key elements of an effective marketing engine, metrics and analytics, and how marketing will continue evolving.
The document provides an overview of the out-of-home (OOH) advertising industry in India. It estimates the current size of the OOH advertising market to be approximately Rs. 14 billion as of 2011. The document outlines the industry segments, competitive landscape, trends and key strategies. It analyzes the value chain and identifies different types of players involved at each stage of OOH advertising. The future of the industry is focused on the growth of digital OOH advertising.
Ge mc kinsey matrix powerpoint presentation templatesSlideTeam.net
The GE-McKinsey Matrix is a chart that evaluates business units based on their market attractiveness and business strength. It divides opportunities into four categories: stars, which have high market attractiveness and strength; question marks, which have high attractiveness but low strength; cash cows, which have low attractiveness but high strength; and dogs, which have low attractiveness and strength. The matrix is used to assess where to allocate resources and determine whether business units should be invested in, maintained, or divested.
Find our how to make your advertising accountable. David Beaton, Senior Partner & CEO of Custometrics leads this instructive session that addresses what measurement sources are available to advertisers in the digital space. Share an analysts’ perspective on the future of measurement and revenues from TV advertising? How can ad networks e-mail engines and campaign management systems connect? Can data be used to drive a dynamic participatory storytelling process!
1) The document discusses various approaches to managing a company's product line and portfolio, including viewing products independently versus interdependently and making judgments based on financial criteria alone versus both financial and market criteria.
2) It describes balancing a product portfolio across dimensions like new versus old products, cash generation versus usage, growth versus profits, and short-term versus long-term. Financial analysis approaches like ROI, payback period, IRR, and NPV are also covered.
3) Issues with over-reliance on financial analysis are that it does not consider uncertainty, politics, or strategic issues, and could lead to misallocation of resources not considering marketing factors. A general portfolio analysis approach assesses market attractiveness
The document provides a sample market segmentation analysis for a fictional company that sells helpdesk software. It segments the market based on company size and geography. It then ranks each segment based on various factors and calculates an overall segment score. The segment with the highest score is Australia Corporate, followed by North America Corporate and Small Business. This high-level summary outlines the key aspects and results of the sample market segmentation analysis.
The document discusses using customer data and loyalty programs to increase retail footfalls and sales. It outlines how collecting customer data through loyalty signups and transactions allows retailers to better segment, target, and personalize marketing. This helps strengthen customer relationships and drives higher acquisition, activation, engagement, and retention. Loyalty programs combined with data analytics form the foundation for relevant rewards, recognition, and experiences that change customer behavior and convert footfalls into financial gains for retailers.
Pricing cannot follow a one-size-fits-all model and should be customized to the business and products. It requires understanding cost structure and customer value, not just setting prices. There are pitfalls like targeting the wrong groups, strategies, or failing to sustain differential value. Organizations should ask questions about economic impact, price structure, unnecessary discounting, strategy alignment, and controlling negotiations. Determining the right pricing involves comprehending what drives customer value and targeting behaviors across segments.
The document provides an overview of pricing models and considerations for B2B and B2C SaaS companies. It discusses three main factors that influence pricing: profit pools, cost structure, and industry stage of development. It also covers internal pricing factors like customer base, costs, and cost of capital. The document provides guidance on pricing to capture value, elasticity, pricing strategies, two-sided markets, and pioneer customer pricing.
This document discusses integrated marketing communications (IMC) and the customer relationship management (CRM) process. It provides an overview of key aspects of developing an IMC strategy including segmenting customers, designing communications and pricing strategies, implementing the strategies, and evaluating results. The document outlines the continuous IMC planning process and tools that can be used, such as advertising, direct marketing, public relations, and personal selling. It also discusses how to allocate marketing communication budgets.
Ge mc kinsey matrix powerpoint ppt templates.SlideTeam.net
The GE-McKinsey Matrix is a chart that evaluates business units based on their market attractiveness and competitive strength. It divides units into nine categories: high market/high strength are "stars"; high market/low strength are "question marks"; low market/high strength are "cash cows"; and low market/low strength are "dogs". The matrix is used to determine where to allocate resources and identify growth opportunities or areas needing improvement.
Ge mc kinsey matrix powerpoint presentation slides.SlideTeam.net
The GE-McKinsey Matrix is a chart that evaluates business units based on their market attractiveness and competitive strength. It divides units into nine categories: high market/high strength are "stars"; high market/low strength are "question marks"; low market/high strength are "cash cows"; and low market/low strength are "dogs". The matrix is used to determine where to allocate resources and identify growth opportunities or areas needing improvement.
Ge mc kinsey matrix powerpoint ppt slides.SlideTeam.net
The GE-McKinsey Matrix is a chart that evaluates business units based on their market attractiveness and competitive strength. It divides units into nine categories: high market/high strength are "stars"; high market/medium strength are "question marks"; medium market/medium strength are "average businesses"; etc. The matrix is used to determine where to allocate resources and identify growth opportunities or risks for each business unit.
This document discusses customer retention and maximization. It begins by defining different levels of customer relationships from always-a-share to lost-for-good customers. It then discusses the benefits of long-term customer relationships for sellers, including additional business opportunities, premium prices, and reduced costs. The document also covers sources of competitive advantage to build customer loyalty, factors that tie customers to relationships, and tools for customer retention like satisfaction surveys.
Learning More About Saa S Strategy TuneupAccenture
The document describes Montclair Advisors' SaaS Strategy Tune-up service. The tune-up provides an analysis of a company's SaaS business model and strategy, comparing it to competitors. It identifies challenges and opportunities to improve profitability, market share, and avoid mistakes. The process involves interviews, market analysis, and delivering actionable recommendations to help companies optimize their SaaS strategy.
Accenture: Pixels, performance and profits (performance-management-in-broadca...Brian Crotty
The complexity of the TV industry is increasing and the competitive landscape
changing rapidly. Models for traditional performance management in broadcasting
are no longer suitable to fight the ongoing erosion of margins in an evolving multiplatform world. While businesses are shaping new strategies and customer value propositions to stay relevant, remain competitive, profitable and attractive to investors, CFOs are being asked to
identify the new value levers. Their role has never been more challenging.
Arrow Electronics Investor Day Presentationfinance16
The document summarizes Arrow's 2008 Investor Day presentation. It includes an agenda for the day-long event covering Arrow's strategic overview, transformation, global business segments, and financial review. The document discusses Arrow's strategy to diversify its product portfolio and geographic presence in enterprise computing solutions and components. It also reviews Arrow's operational improvements, financial targets, and priorities to pursue organic and acquisition growth opportunities globally.
Chap008 developing and managing offerings what do customers wantHee Young Shin
Thank you for the insightful questions. Discussing product management strategies and frameworks can help improve decision making for new product development.
The Strategy accelerator - Business models with sustainable competitive advan...Alfred Griffioen
Innovate your business model to gain higher ROI. Determine your sustainable competitive advantage (market relevancy or a unique product) and choose your strategy: ally, combine, excel or consolidate. This presentation in English is based on the Dutch book 'De strategieversnelling'. See www.strategy-accelerator.com
As a supporter of open innovation in SM we present our thoughts on what is involved
in advancing Supply Management as a core competence and invite interested parties to share their views to develop this theme.
Charlas N: Experiencias de ciudades en transformación - HP in Colombia - Bria...Ruta N Medellín
Conferencia "Experiencias de ciudades en transformación"de Brian Humphries de Hewlett Packard , charla que se ofreció en el marco de la Semana de la Innovación 2011.
Segmentation is a key challenge for marketers that can increase commercial effectiveness and efficiency. While many companies primarily use basic segmentation methods like firmographics, segmentation aims to identify and quantify customer segments with similar profiles, needs, behaviors and expectations to develop tailored value propositions and go-to-market strategies. There are four main segmentation methods - firmographic, needs-based, usage-based, and value-based - that can be used together based on specific business objectives like sales, marketing, finance, and organization. Benefits of segmentation include higher efficiency and effectiveness of initiatives, enhanced marketing focus and optimal budget allocation.
T4Mailer is a cloud-based email marketing solution that allows users to easily create and send marketing campaigns, newsletters, and other content to targeted audience segments. It integrates with a site manager to pull in content, offers personalization and sign-up functionality, and provides detailed analytics on campaign performance.
TERMINALFOUR t44u 2011- Did you know - Bulk manipulation of contentTerminalfour
This document discusses bulk manipulation features introduced in Site Manager 7.1.0002 that allow users to mirror, duplicate, move, or delete multiple items of content within a section at once rather than one at a time. These bulk operations streamline content management by making it faster and less tedious to rearrange large amounts of content within sections. The document also indicates there will be a demonstration of these bulk manipulation features and invites any questions or feedback from readers.
TERMINALFOUR t44u 2011 - Did you know - Navigation objectsTerminalfour
Traditional navigation objects were used to organize related content on pages, while more advanced objects like keywords search and pagination allow websites to dynamically scale content. Keywords search originated from client needs for efficient content reuse, and was first implemented for UNAIDS. Pagination also began as a client requirement for effective content ordering and was first used for UNAIDS. Both keywords search and pagination have since been adopted by other clients.
TERMINALFOUR t44u 2011 - Going mobile, a INTO Case StudyTerminalfour
The Irish National Teachers' Organisation (INTO) represents over 38,000 primary school teachers in Ireland. INTO is exploring going mobile to better serve its younger membership and engage participants more effectively. It plans to develop a conference mobile app and mobile-optimized website. The app will provide up-to-date information for conference delegates and allow communication before and during conferences. The mobile website will allow easy access to INTO resources from smartphones. Both will integrate with INTO's existing content management system for easy updating and be low-cost, user-friendly solutions to connect with members on-the-go.
Each year over 500,000 women die during childbirth, mostly in developing countries, due to severe bleeding which can kill within two hours if unattended and contributes to 44% of maternal deaths in Africa. Access to safe blood transfusions could prevent up to 25% of maternal deaths, yet in low-income countries 65% of blood is given to children under five, highlighting the need for more blood donations to save mothers' lives during childbirth.
TERMINALFOUR t44u 2008 - The University Of Manchester Case StudyTerminalfour
Site Manager 7.0 aims to improve the University of Manchester's content management system by enhancing document management, hiding complexity from end users, and improving the user interface. The updates seek to build on strengths like interoperability while addressing weaknesses such as usability for non-experts. By making the system easier to use and manage documents, it hopes to more successfully devolve content control while reducing the input needed from web teams.
JTD Nightclub is a jazz-themed club located at 1414 East 58th Street that offers food, drinks, and live music in a party atmosphere where everyone feels like a VIP. The club promotes itself as a place to eat, drink, party, and rock out to master sound while taking advantage of the jazzy, trendy, and delicious atmosphere and experience.
TERMINALFOUR t44u 2009 - Permanent TSB & iQ Content Case StudyTerminalfour
The document discusses a case study of PTSB.ie, an Irish bank's website. It describes challenges with the previous website, including poor customer experience, low sales, and complex applications. A new solution was developed using the Site Manager content management system. This improved the user experience and simplified applications. It also facilitated multichannel banking and helped build the bank's online brand. Site Manager was chosen for its security, ease of use, templates, and supportive services.
TERMINALFOUR t44u 2010 - WCMS Case Studies - Do more with the same resourcesTerminalfour
The document outlines the agenda for a conference session on rollout strategies for a content management system. It describes the sure start process for new implementations, which involves 11 phases over 4-5 months. The presentation will cover the current rollout capabilities of the system including content duplication and import tools, as well as future plans to enable cross-site content migration and HTML importing. Speakers from three universities will then discuss their experiences deploying the system.
The document summarizes ways to integrate and publish content from a content management system like TerminalFour Site Manager to portals and content platforms. It discusses major portal technologies, standards they support for integrating content, and provides an example process for publishing Site Manager content to Microsoft SharePoint. The summary discusses pulling content into portals using web parts or portlets, and standards for integrating documents from a document management system into Site Manager, like WebDAV, JSR 170, and Content Management Interoperability Services (CMIS).
This document discusses using Site Manager functionality and data from within other applications through web services. It explains that web services allow Site Manager data and widgets to be accessed and managed from desktop gadgets, mobile apps, and other applications. The document also provides examples of how to make requests to the Site Manager web services using WSDL and XSD files to parse the response and display the required information, such as through a JavaScript web service call.
Approaches to higher education course search: TERMINALFOUR t44u 2013Terminalfour
TERMINALFOUR's Mark Baldwin discusses TERMINALFOUR's approaches to higher education course search by examining a number of case studies including; University of Portsmouth, University of St Mark & St John, University of Derby and University of East London.
TERMINALFOUR t44u 2012 - What is Responsive Design?Terminalfour
Responsive Design: Does one size fit all? This session took a holistic look at responsive design from benefits, practical tips, TERMINALFOUR’s approach to implementing responsive design sites and client examples.
TERMINALFOUR t44u 2010 - Professional Services AssistanceTerminalfour
This document discusses tools and utilities for helping with content migration and rollout in Site Manager. It describes importing content from other CMS systems like Serena Collage, migrating content between Site Manager instances using export/import bundles, and migrating assets from external HTML sites by converting them to bundles. Other utilities mentioned include copying content and assets, link migration, and importing site structure from spreadsheets. The presenter asks for any other suggestions from attendees.
Bishnupriya (Manipuri) Speakers in Bangladesh: A Sociolinguistic Surveyrajkumarrishi1
This report presents the findings of a survey conducted in the Bishnupriya community of
Bangladesh in March 2003. Data gathered through word lists, sociolinguistic questionnaires, and
SRTs are presented and analyzed to determine the current sociolinguistic situation. In brief, it
was concluded that the Bishnupriya are highly bilingual in Bangla, the national language, but
also speak their mother tongue enough to keep its vitality high and have a positive attitude
toward their mother tongue. Still, an increased use of mother tongue literacy would strengthen its
usefulness and vitality even more.
TERMINALFOUR t44u 2011 - Extending your reach - Gedling Borough Council Case ...Terminalfour
The document outlines Gedling Borough Council's efforts to improve its website and online services. It formed a partnership to redevelop the site using user feedback. The new site has clearer navigation, content, and language. The goal is to move more services online to reduce costs and improve access. It also discusses growing social media presence and ensuring the site works for all devices and abilities. The council is working across departments to enhance online transactions and services.
It is a fact that a person who does not continue to learn will double their income about every 22 years. It is also fact that the person who continues to develop themselves will double their income about every 3 years. Now this is a no brainer, do you want to wait 19 years longer than necessary to double your income? I know I want the 3 year plan. So check out ilearningglobal to see how you can become a part of the future of online personal and business development.
The BCG Matrix is a portfolio analysis tool developed by the Boston Consulting Group in the 1970s to help corporations analyze their business units, or Strategic Business Units (SBUs). It uses a 2x2 matrix, with relative market share on the x-axis and market growth rate on the y-axis, to categorize SBUs into four groups: Stars, Cash Cows, Question Marks, and Dogs. The document provides details on the emergence, components, applications, advantages, and limitations of the BCG Matrix model for analyzing corporate portfolios.
Best Practices in Implementing Strategic and Competitive IntelligenceACRASIO
The document discusses best practices for implementing strategic and competitive intelligence, including defining key intelligence topics and questions, collecting information from various secondary and primary sources, and conducting analyses like competitor profiling, SWOT analysis, and benchmarking to reduce costs, increase revenues, enable better strategic decisions, and minimize risks. An example is given of a large automotive supplier that achieved substantial cost savings through product benchmarking.
The document discusses a gap in delivering analytics through business intelligence (BI) tools, known as the "last mile of BI". It introduces Dunegrass as a solution to close this gap by enabling collaborative analysis, interactive charts/tables, and a unified data model across sources. The startup is seeking $1.5 million investment to expand their team of developers, sales, and marketing staff to scale the software business for rapid growth.
The BCG Matrix is a portfolio analysis tool developed by the Boston Consulting Group in the 1970s to help corporations analyze their business units and allocate resources. It divides business units into four categories based on their market growth rate and relative market share: stars, cash cows, question marks, and dogs. Stars are high growth, high share units that require investment; cash cows are low growth, high share units that generate cash; question marks are high growth, low share units that require investment to achieve their potential; and dogs are low growth, low share units that should be divested. The BCG Matrix provides a simple framework to assess business units and allocate capital but has limitations as it only considers two factors and does not account for synerg
This document discusses how only a small percentage of companies achieve fast growth, breaking through barriers to the next stage of development. It identifies that ambitious growth targets, product and service innovation, strong international outlook, and partnerships are characteristics of fast growing companies. The primary condition for breakthrough is excellence in attitude, market insights, and managing the growth process through clear goals and an iterative feedback loop. Growth must be carefully managed through four steps, with a focus on execution to deliver results and outperform competitors. Different growth stages require focusing on different aspects such as validating the business concept, building management capabilities, or expanding production and sales.
The document discusses the BCG matrix, a tool used to evaluate a company's portfolio of business units. It describes the emergence of portfolio matrices in the 1970s and the key components of the BCG matrix: market growth rate and relative market share. Business units are classified into four categories - Stars, Cash Cows, Question Marks, and Dogs - based on their placement in the matrix. The summary applies the BCG matrix to analyze ITC's revenues across different business segments.
This document outlines a strategic restructuring plan for GSG to return to double digit growth. It identifies focusing on small and mid-sized business customers and solutions-oriented products as the key strategies. The plan involves prioritizing industries like business services, manufacturing, and financial services for sales efforts. The goal is to increase revenue growth, market share, employee and customer satisfaction through organizational changes and entering low competition, high growth markets.
GSG is implementing a strategic restructuring to return to double digit revenue growth. Key elements of the new strategy include focusing on high growth small business segments with low competition, prioritizing industries like business services and manufacturing. GSG will also emphasize solutions selling through partners and developing industry specific solutions. The organization will be restructured into three new divisions focusing on partners, industry solutions, and customer service to support this strategy.
The document discusses strategic approaches for businesses to take advantage of opportunities presented by the American Recovery and Reinvestment Act of 2009 (ARRA). It outlines that traditional responses to increased government spending have often yielded suboptimal results. It recommends a rigorous three-part process: 1) Developing an external market view of ARRA opportunities through in-depth analysis; 2) Conducting an internal capabilities assessment; 3) Creating a coordinated action plan. The document emphasizes the unprecedented scale, complexity, pace and transparency of the ARRA require a systematic strategic approach rather than typical reactive responses.
The document discusses strategic approaches for businesses to take advantage of opportunities presented by the American Recovery and Reinvestment Act of 2009 (ARRA). It outlines that traditional responses to increased government spending have often yielded suboptimal results. It recommends a rigorous three step process: 1) Developing an external market view of ARRA opportunities through in-depth analysis, 2) Conducting an internal capabilities assessment, and 3) Creating a coordinated action plan. The unprecedented scale, complexity, pace, and transparency of the ARRA require a systematic strategic approach focused on analysis, innovation, coordination and execution rather than typical short-term tactical responses.
James M. Kelly is an executive with experience in various industries including telecommunications, internet, software, healthcare, and transportation. He has a proven track record as a CFO and has delivered results beyond expectations through vision, leadership, execution, and communication. His experience includes turnarounds, mergers and acquisitions, and bringing companies from startups to large organizations.
The document provides a situation analysis and recommendations for Cirque du Soleil to expand its resident show business. It identifies the key issues of lack of a clear market expansion strategy, need for a new partnership model, and developing effective market penetration strategies. The recommendations include: 1) Pinpointing London, New York, and Sydney as priority markets; 2) Developing partnerships with entertainment complexes to replicate the successful MGM Mirage model; and 3) Developing culturally relevant content and marketing strategies to gain a strong foothold in the new markets. The strategies aim to expand into new markets in a controlled manner while maintaining Cirque's creative control and brand value.
1) IBM's Global Business Services division aims to grow revenue faster than the market through business analytics, smarter solutions, cloud computing, and growth markets.
2) GBS will expand margins through shifting to higher value services and solutions, leveraging operational transformation initiatives, and improving delivery model efficiency.
3) From 2009 to 2015, GBS forecasts compound annual growth rates of 8-10% in operating pre-tax income and revenue, reaching $4 billion and continued profit expansion through these strategies.
1. The document discusses how the internet impacts corporate strategy and industry structure. It examines essential questions around how economic benefits will be distributed and how the internet will impact profitability and competitive advantage.
2. Three levels of e-business strategy are described from experimentation to integration to transformation. The stages of an e-business strategy process are also outlined.
3. Stage two of the process involves diagnosing the industry environment through analyzing competitors and benchmarking technology, as well as diagnosing the company through assessing customers, suppliers, technologies, and identifying SWOTs.
This document discusses Coca-Cola's geographic portfolio strategy for growth. It divides markets into emerging, developing, and developed, and outlines strategies for each. For emerging markets, Coca-Cola plans to invest ahead of demand to build brands and infrastructure as these markets experience high population and expenditure growth. In developing markets, Coca-Cola will segment markets and expand portfolio to capture value as personal expenditures increase. For developed markets, Coca-Cola will drive profitable growth through innovation and productivity. The overall strategy aims to expand consumption globally by tailoring investments and initiatives to the state of development in each market.
The document discusses the Boston Consulting Group (BCG) Matrix, which classifies business units into four categories based on their relative market share and market growth rate: Question Marks, Stars, Cash Cows, and Dogs. Question Marks have high growth but low market share, requiring high investment. Stars have high growth and market share but also require heavy investment. Cash Cows have low growth but high market share, generating cash with little investment. Dogs have low growth and market share and are cash traps. The BCG Matrix helps assess a product portfolio, cash demands, development cycles, and resource allocation.
The document discusses the Boston Consulting Group (BCG) Matrix, which classifies business units into four categories based on their relative market share and market growth rate: Question Marks, Stars, Cash Cows, and Dogs. Question Marks have high growth but low market share, requiring high investment. Stars have high growth and market share but also require heavy investment. Cash Cows have low growth but high market share, generating cash with little investment. Dogs have low growth and market share and are cash traps. The BCG Matrix helps assess a product portfolio, cash demands, resource allocation, and divestment decisions.
Enterprise Planning for the Retail IndustryAlithya
In the new economic reality, retailers need to plan for the short and long-term. However, most organizations fall short of comprehensive Enterprise Planning due to a combination of inadequate tools and siloed processes. Learn how Hyperion Strategic Finance can be deployed to seed operational plans with strategic targets as well as receive the latest forecasts from Planning and Essbase. In addition to integrating the short and long-range planning processes, we will also discuss how true Enterprise Planning should utilize the same reporting toolset to integrate and enhance analytical and reporting capabilities in the planning process.
1. Portfolio - a collection of products, services,
or brands that are offered for sale to a
customer in order to achieve diversification
and balance.
Framework I use for Product
Portfolio analysis
For additional Information
Contact paul.bosetti@gmail.com
2. Framing the Portfolio Strategy
Build on the current strategy and dig deeper
“Desire for growth while managing Risk”
Build Current State
• Detailed business analysis & Competitive landscape analysis
Define Future State To Ensure Long Range Profits & Cash Flow
• Correct product mix to match company strategy
• Possible growth platforms to launch new offerings. Determine how the
financial and corporate strategy will link in with the Portfolio Strategy
Contact paul.bosetti@gmail.com
For additional Information
Execute
• Develop detailed plans and implement
Paul.bosetti@gmail.com
3. Current State Review
Current State, possible analysis steps in defining Portfolio Strategy*
• Map revenues, customers, and gross margin to market segments
• Conduct detailed ABC analysis of revenue generation activities
• Determine cost to serve models “prune” unprofitable customers or
move them into a different line segment
• Interview key customers and management personnel
• Assessment of Industry attractiveness
Contact paul.bosetti@gmail.com
For additional Information
• Economic analysis
• Barriers to entry
• Competitors
*Portfolio models are narrow in nature. They may obscure the most
essential strategic issue in building a portfolio…what are the drivers for
creating and enhancing interrelationships?
Paul.bosetti@gmail.com
4. BCG Growth Share Matrix
BCG matrix is good for picturing aggregate composition.
Plot current market share within target segments.
This is a simple
matrix which is
High
useful in laying Star
out the current Question
Industry
Growth
state, but a more Mark
robust analysis
will aid in
Contact paul.bosetti@gmail.com
For additional Information
developing a Low
strategic portfolio Dog
Cash
plan Cow
Bubble denotes
High Low
current market %
of portfolio Relative Mkt.
Share
Paul.bosetti@gmail.com
5. Business Assessment Array
Analysis that uncovers more information about Market opportunities
& competitive position through composite dimensions
Build a hierarchical High A B C
analysis at the
Attractiveness
product offering
Industry
within industry B C D
Med
segments
Industry Business
Contact paul.bosetti@gmail.com
For additional Information
C D D
Low
Attractiveness Strength
Market Position
Market Size
Market share
High Med Low
Market Growth
Share growth
Profitability
Business Strength
Share compared with
Cyclicality
leading competitor
Ability to Recover A-Investment/Growth
From a Recession Competitive Strength
B-Selective Growth
Quality leadership
C-Selectivity
Technology
D-Evaluate
Relative profitability
Paul.bosetti@gmail.com
6. Review ABC Segmentation/Strategy
Portfolio review may lead to analysis that uncovers
extreme concentration of sales in a few customers
100% 100%
80% 80%
Cumulative
Cumulative
% of
% of 50% 50%
Sales/Profits
Sales/Profits
0% 0%
20% 50% 100% 35% 50% 100%
Percentage of Routes/Industry Percentage of Customers/Segments
Contact paul.bosetti@gmail.com
For additional Information
Action Plan
Customer/Product Evaluation
Cutomer/
Industry/ 2003 2003 Strategicaly
Action Plan
Route Revenue Profits Important
Retain Customer A
A 100 20 Yes
Grow Segment B
B 25 5 No
Enter market X
C 75 15 Yes
Enter new businss
D 20 2 Yes
Paul.bosetti@gmail.com
7. Future State
Future State: Once the industry trends, competitive pressure,
competitive advantages, and risk tolerance is defined
then we can answer:
• Should we be in these business segments*?
• Should we add a new product?
• How can we win and hold a substantial share of the market?
• How should we grow our presence in other segments to
minimize risk and maximize our profits?
Contact paul.bosetti@gmail.com
For additional Information
*Segmentation should be limited to grouping those buyers who share
strategically relevant situational or behavioral characteristics. This will
lead to effective cost to serve models.
Paul.bosetti@gmail.com
8. Defining the value of new ventures
Need to follow a systematic approach in defining how to build
the business case and leap into new business horizons
from our core competencies
Develop Cost
Sales
($) Dollars
Key Performance Measures
Cum. EBITA
Gross Margin %
NPV @ Disc Rate $
# years break even #
Contact paul.bosetti@gmail.com
For additional Information
Prob. Of success %
Strategic direction (text)
Project Horizon
Financial Projections 2004 2005
Sales $ $
Cost $ $
Cash Flow $ $
Paul.bosetti@gmail.com
9. Additional thoughts
To “predict” future growth we may also want to measure
and follow actual and estimated GDP and IPI
Real Gross Domestic Product (GDP)
• Measures the value of goods and services produced in US
excluding inflation
Industrial Production Index (IPI)
• Measures the physical units & inputs into the US production
process
Other correlation possibilities
• Durable good orders (indicate possibly inventory restocking)
Contact paul.bosetti@gmail.com
For additional Information
• Corp Profits
• Consumer confidence (Increase income, Increase job mkt.)
2003nd
1st Half 2 Half
2003 Results 2.4% 6.1%
GDP
IPI (1.1%) 5.1%
Paul.bosetti@gmail.com