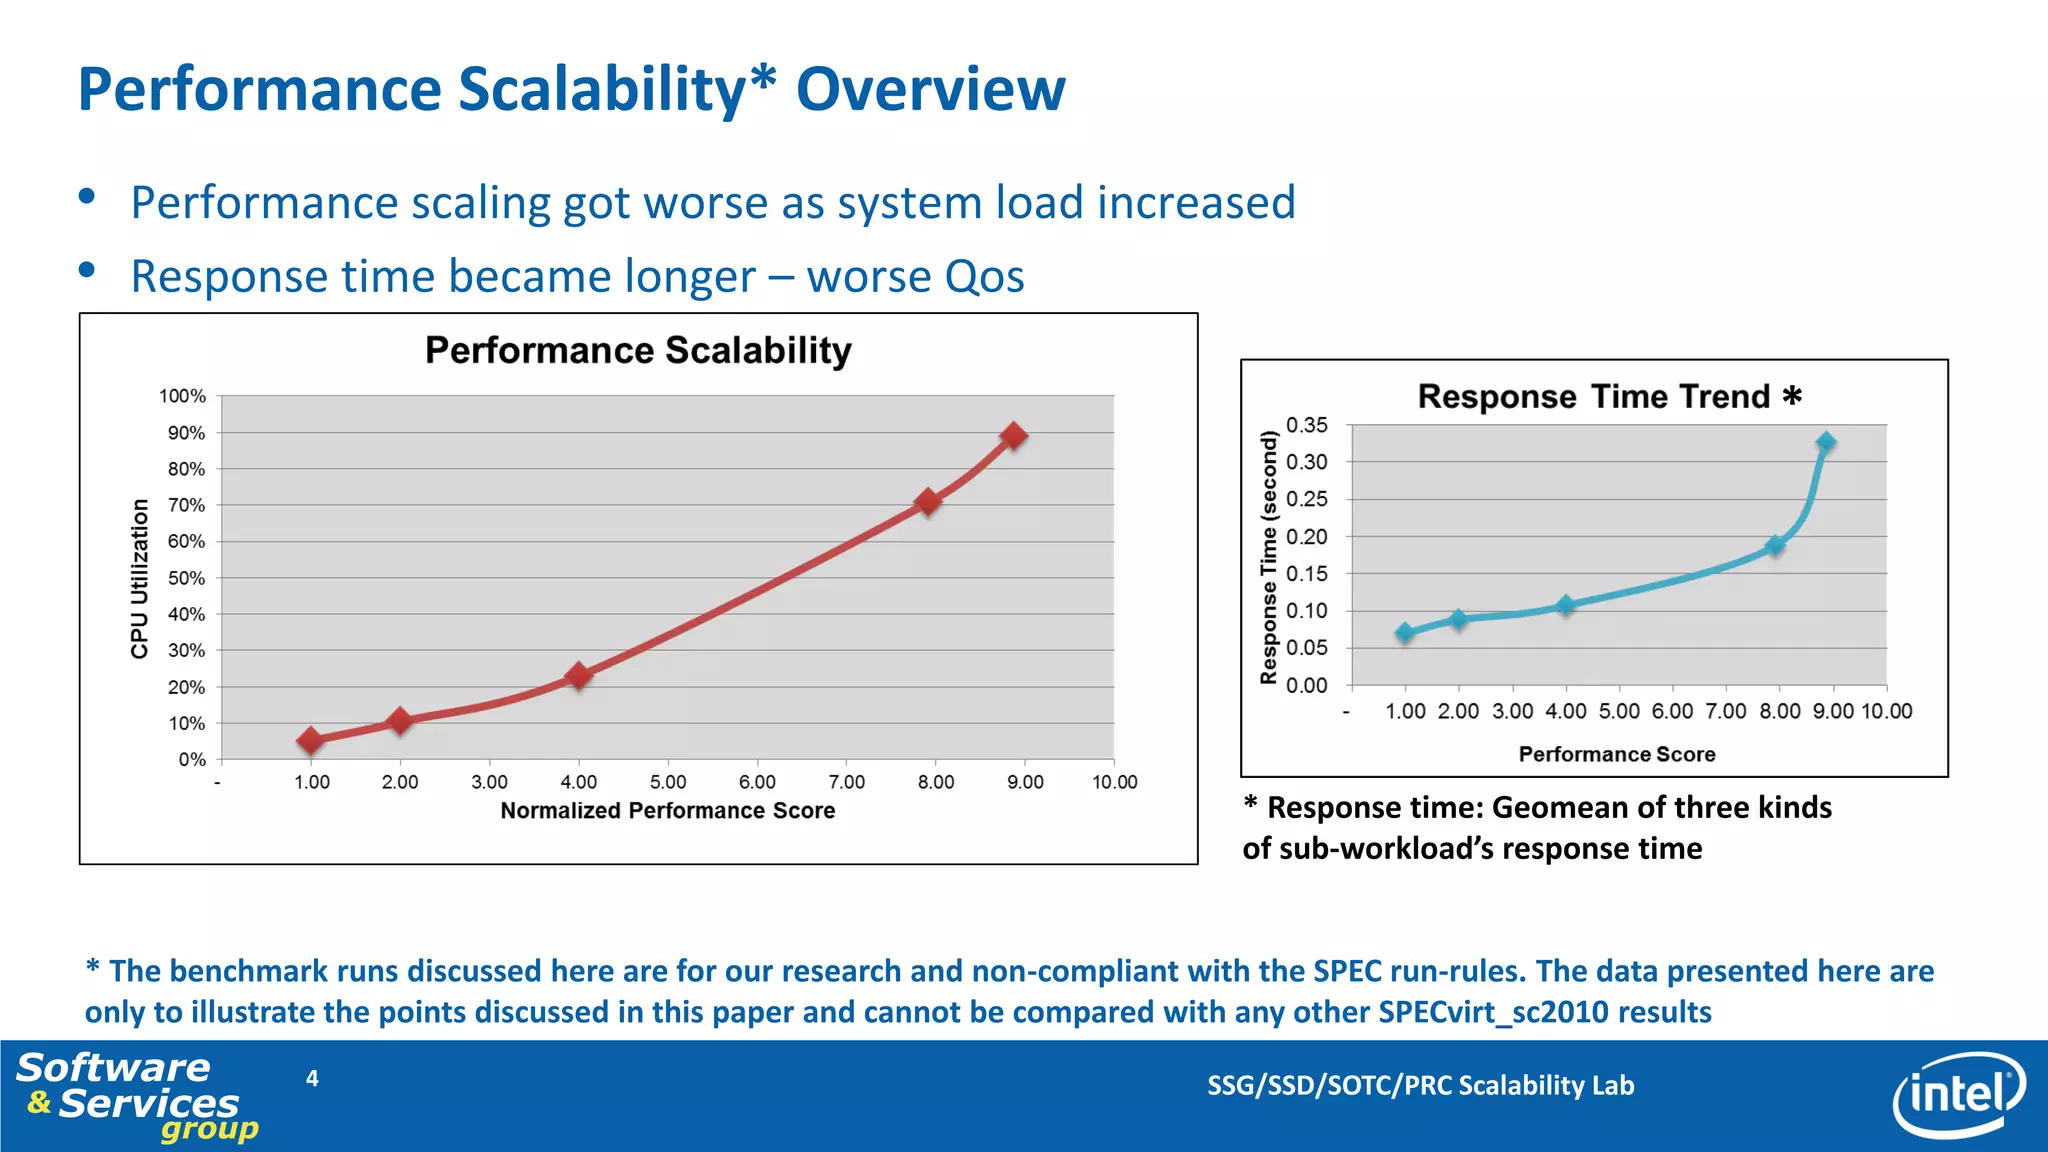
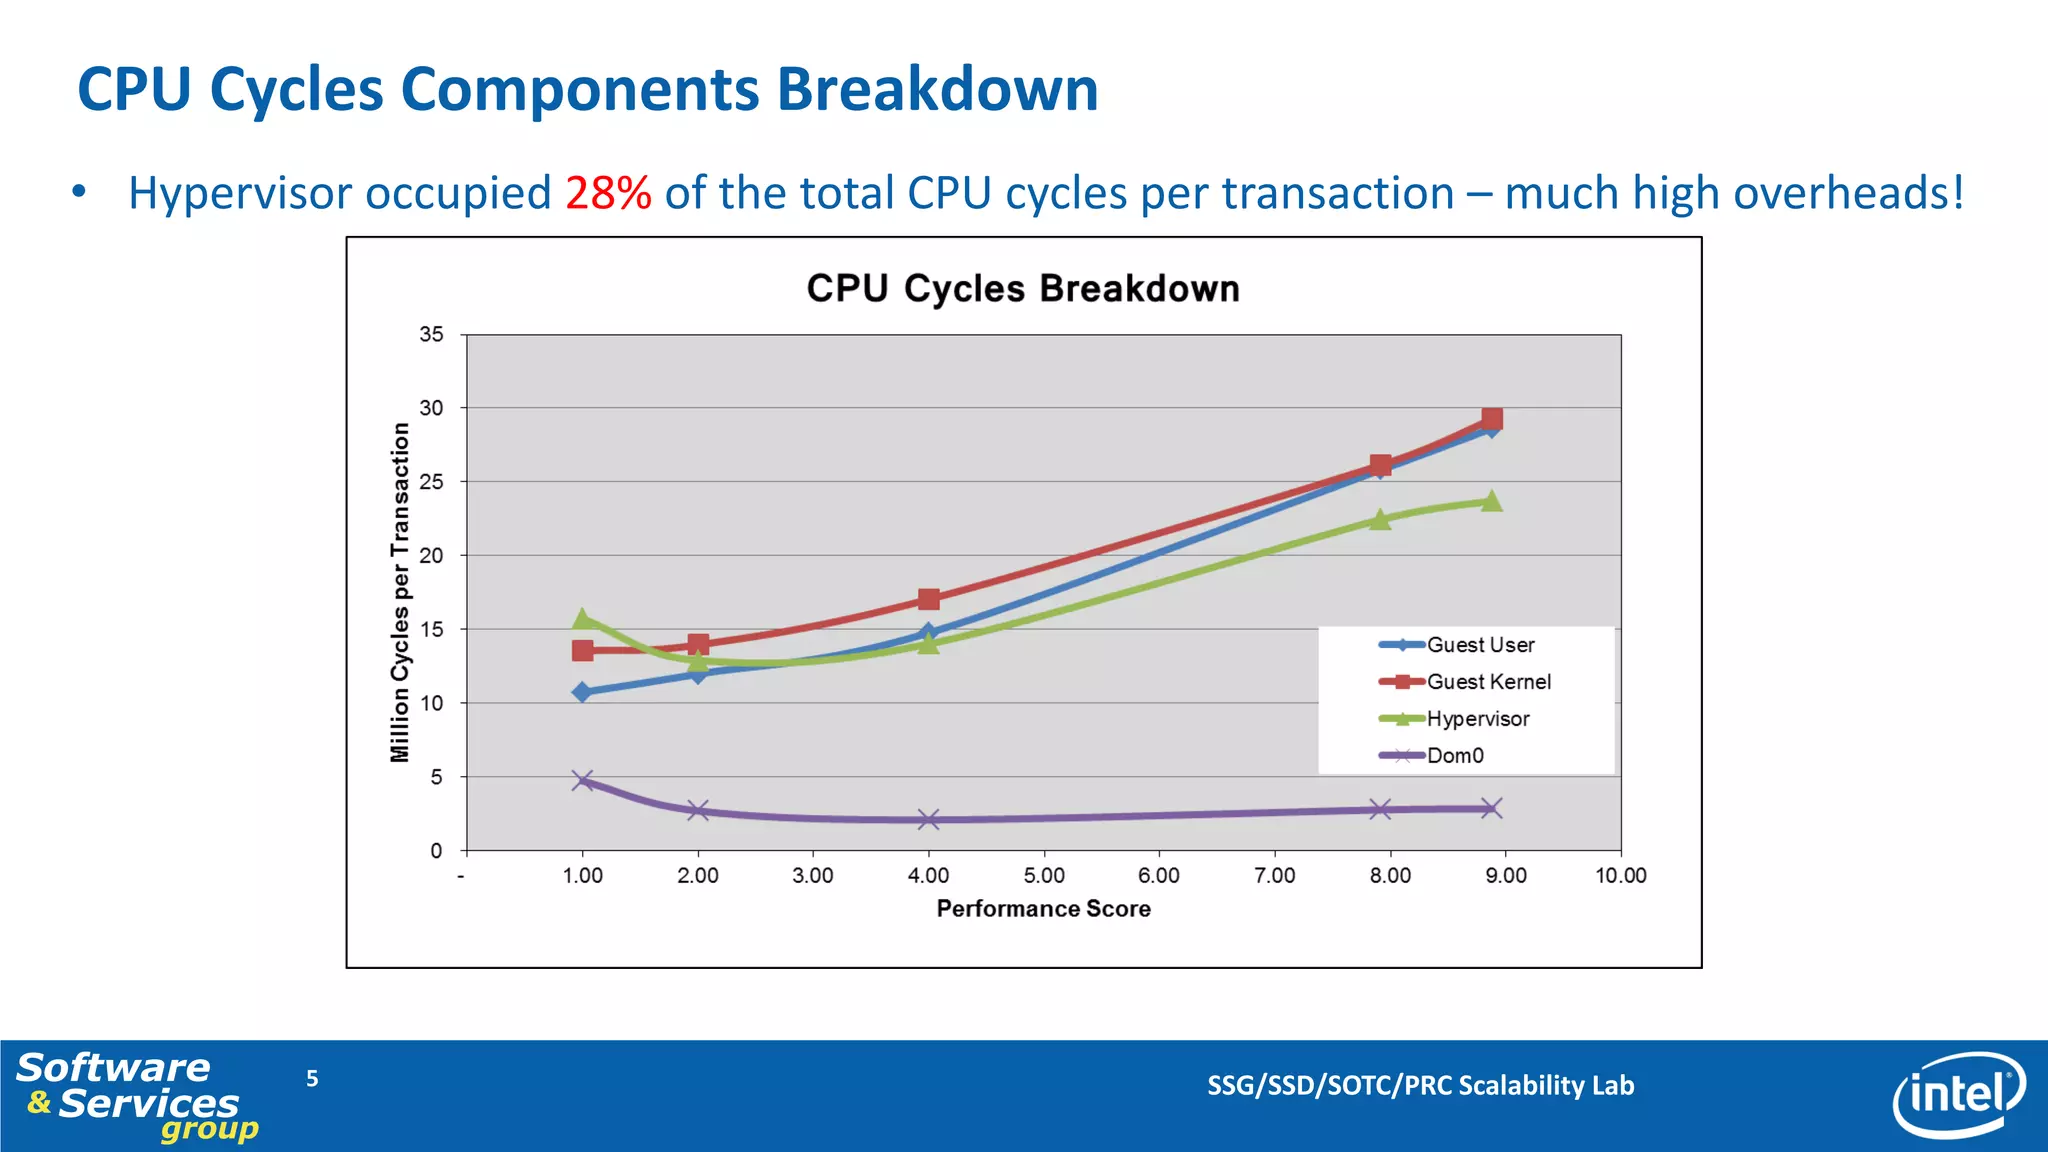
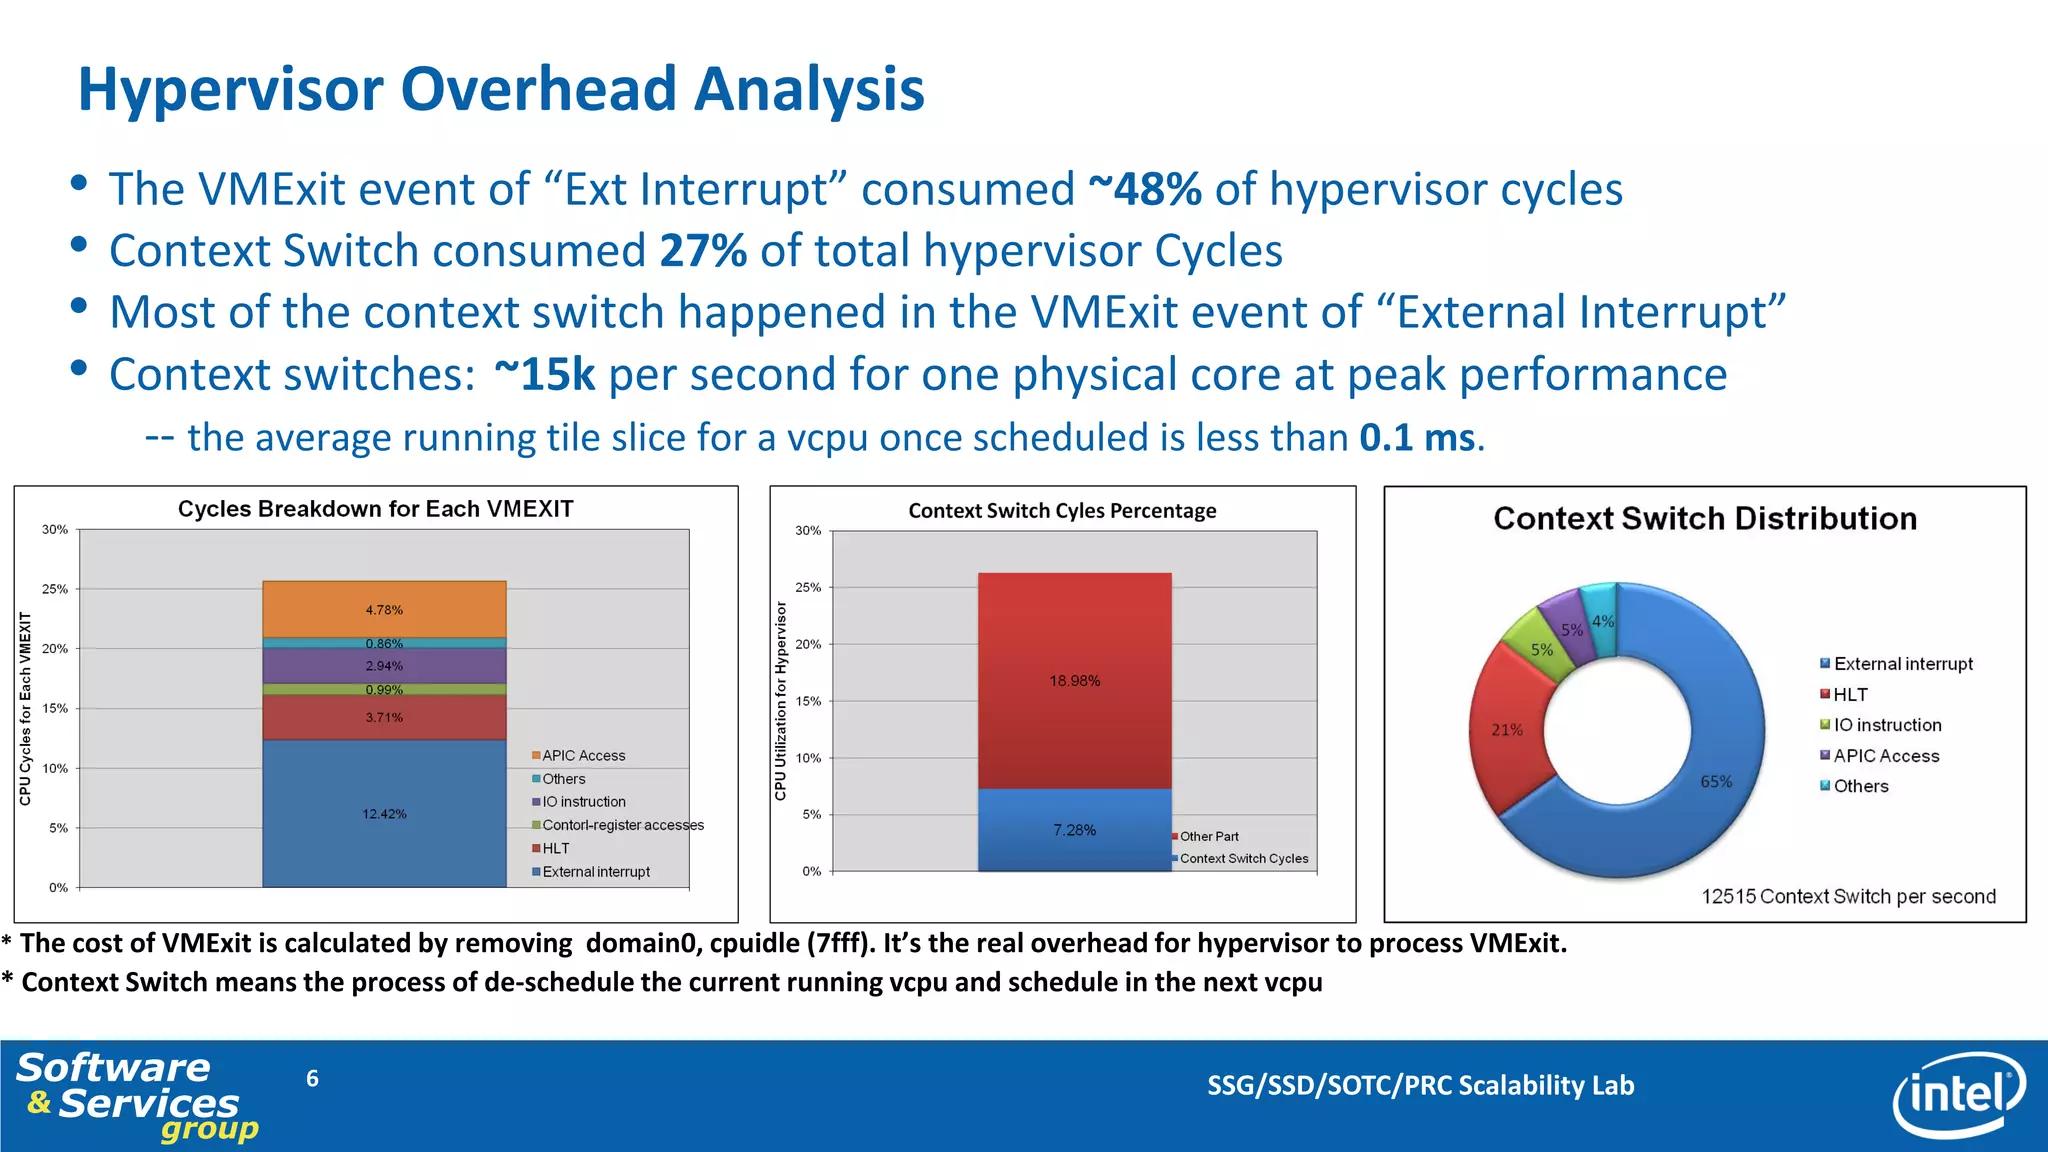
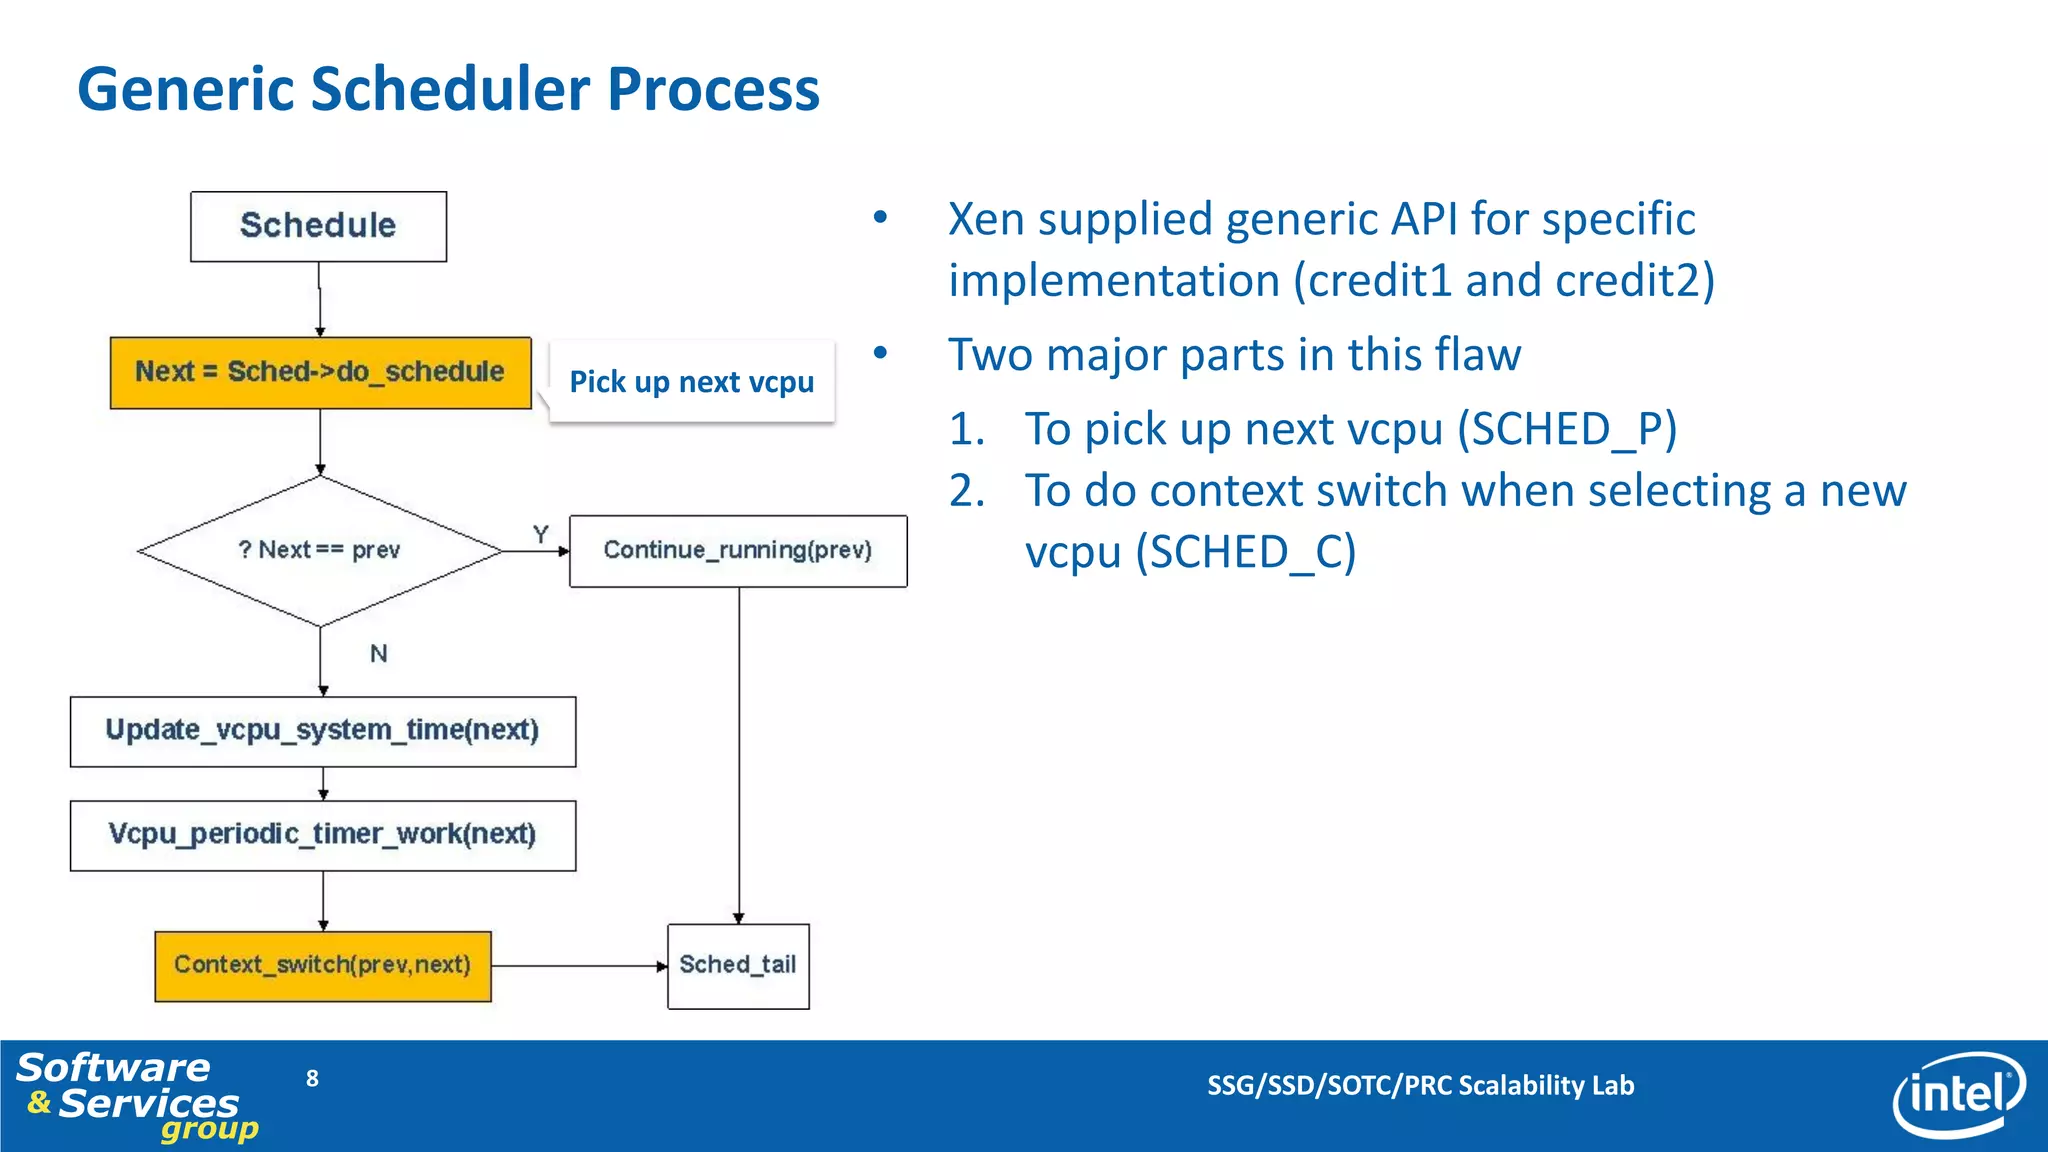
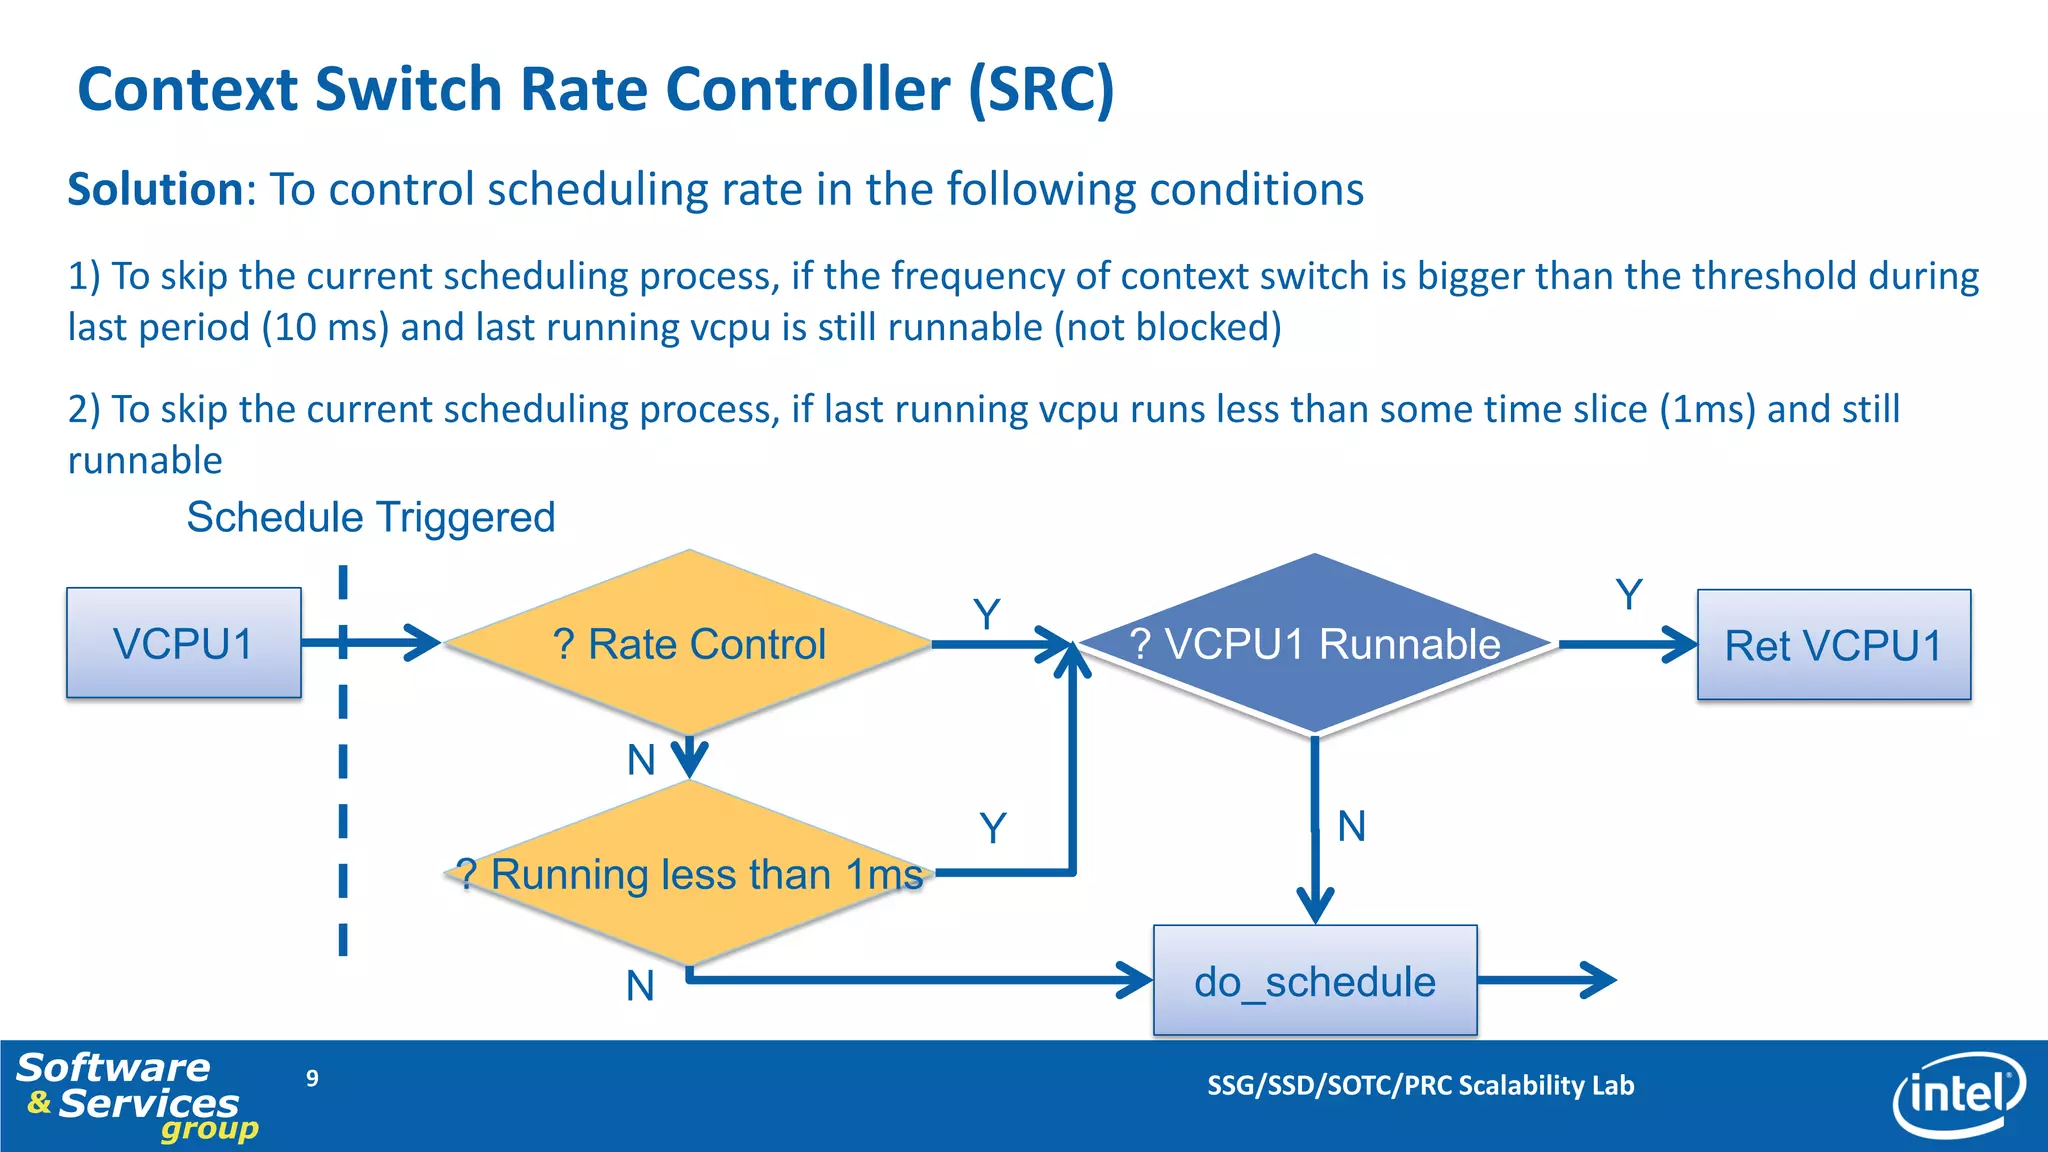
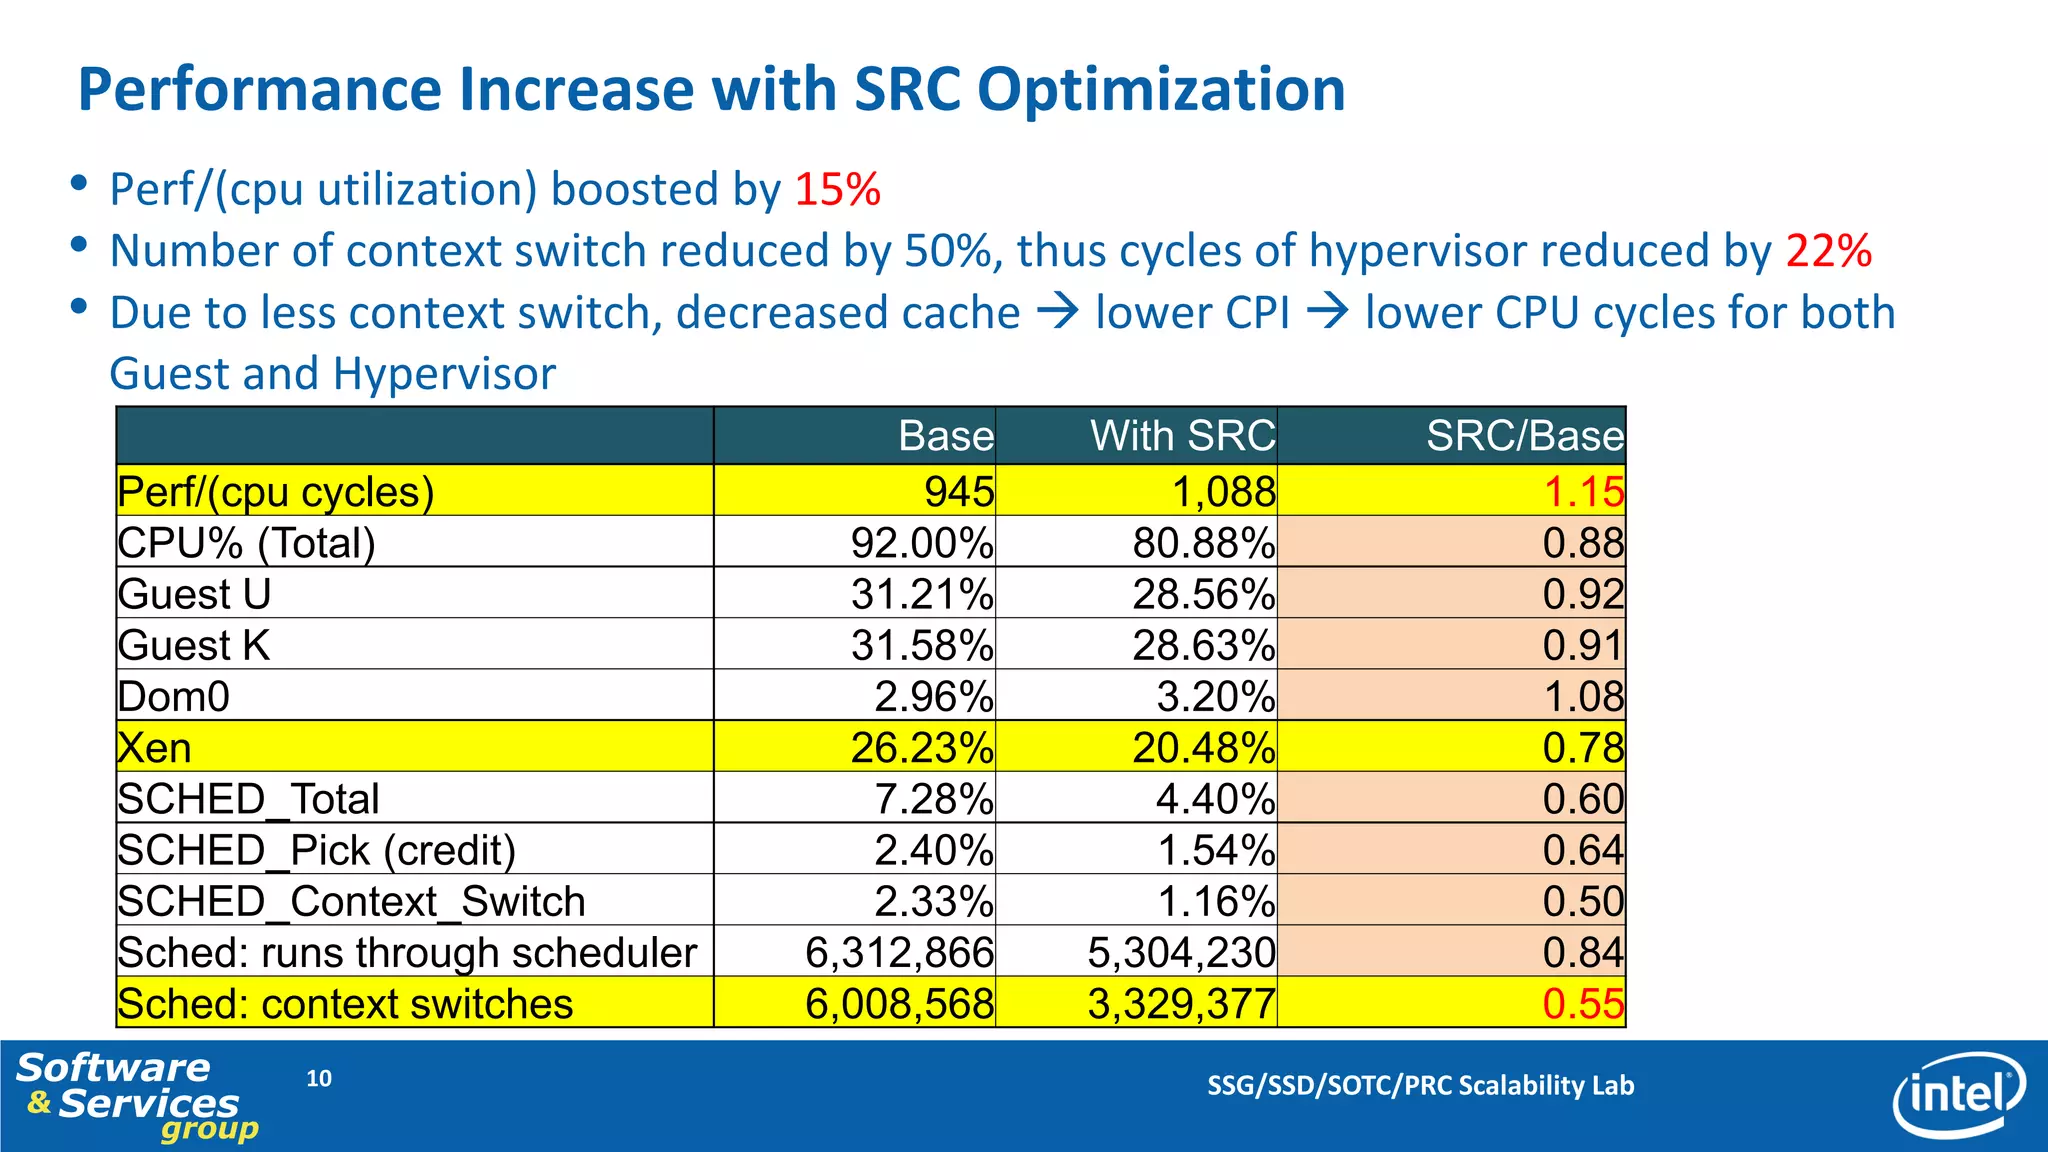
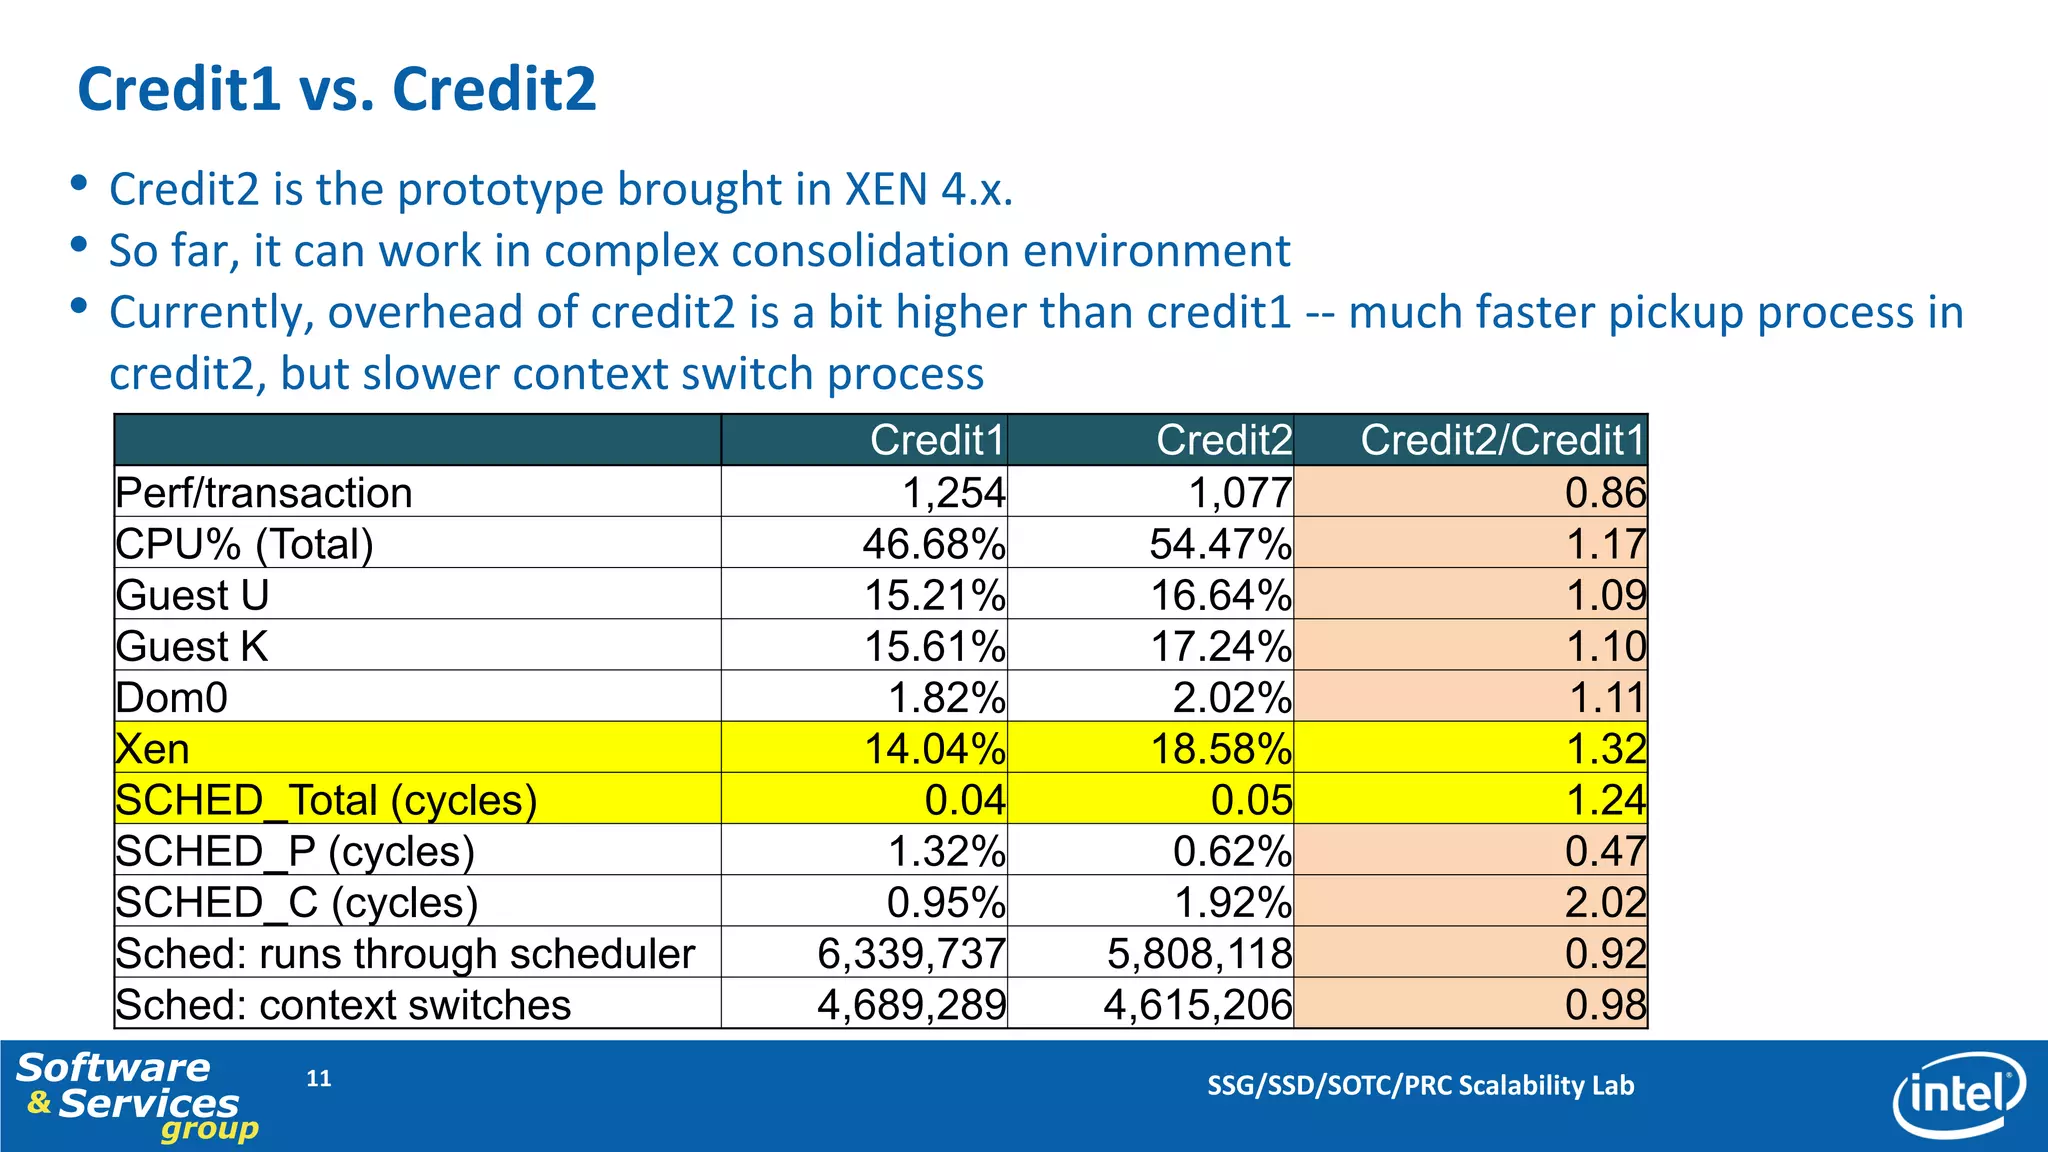
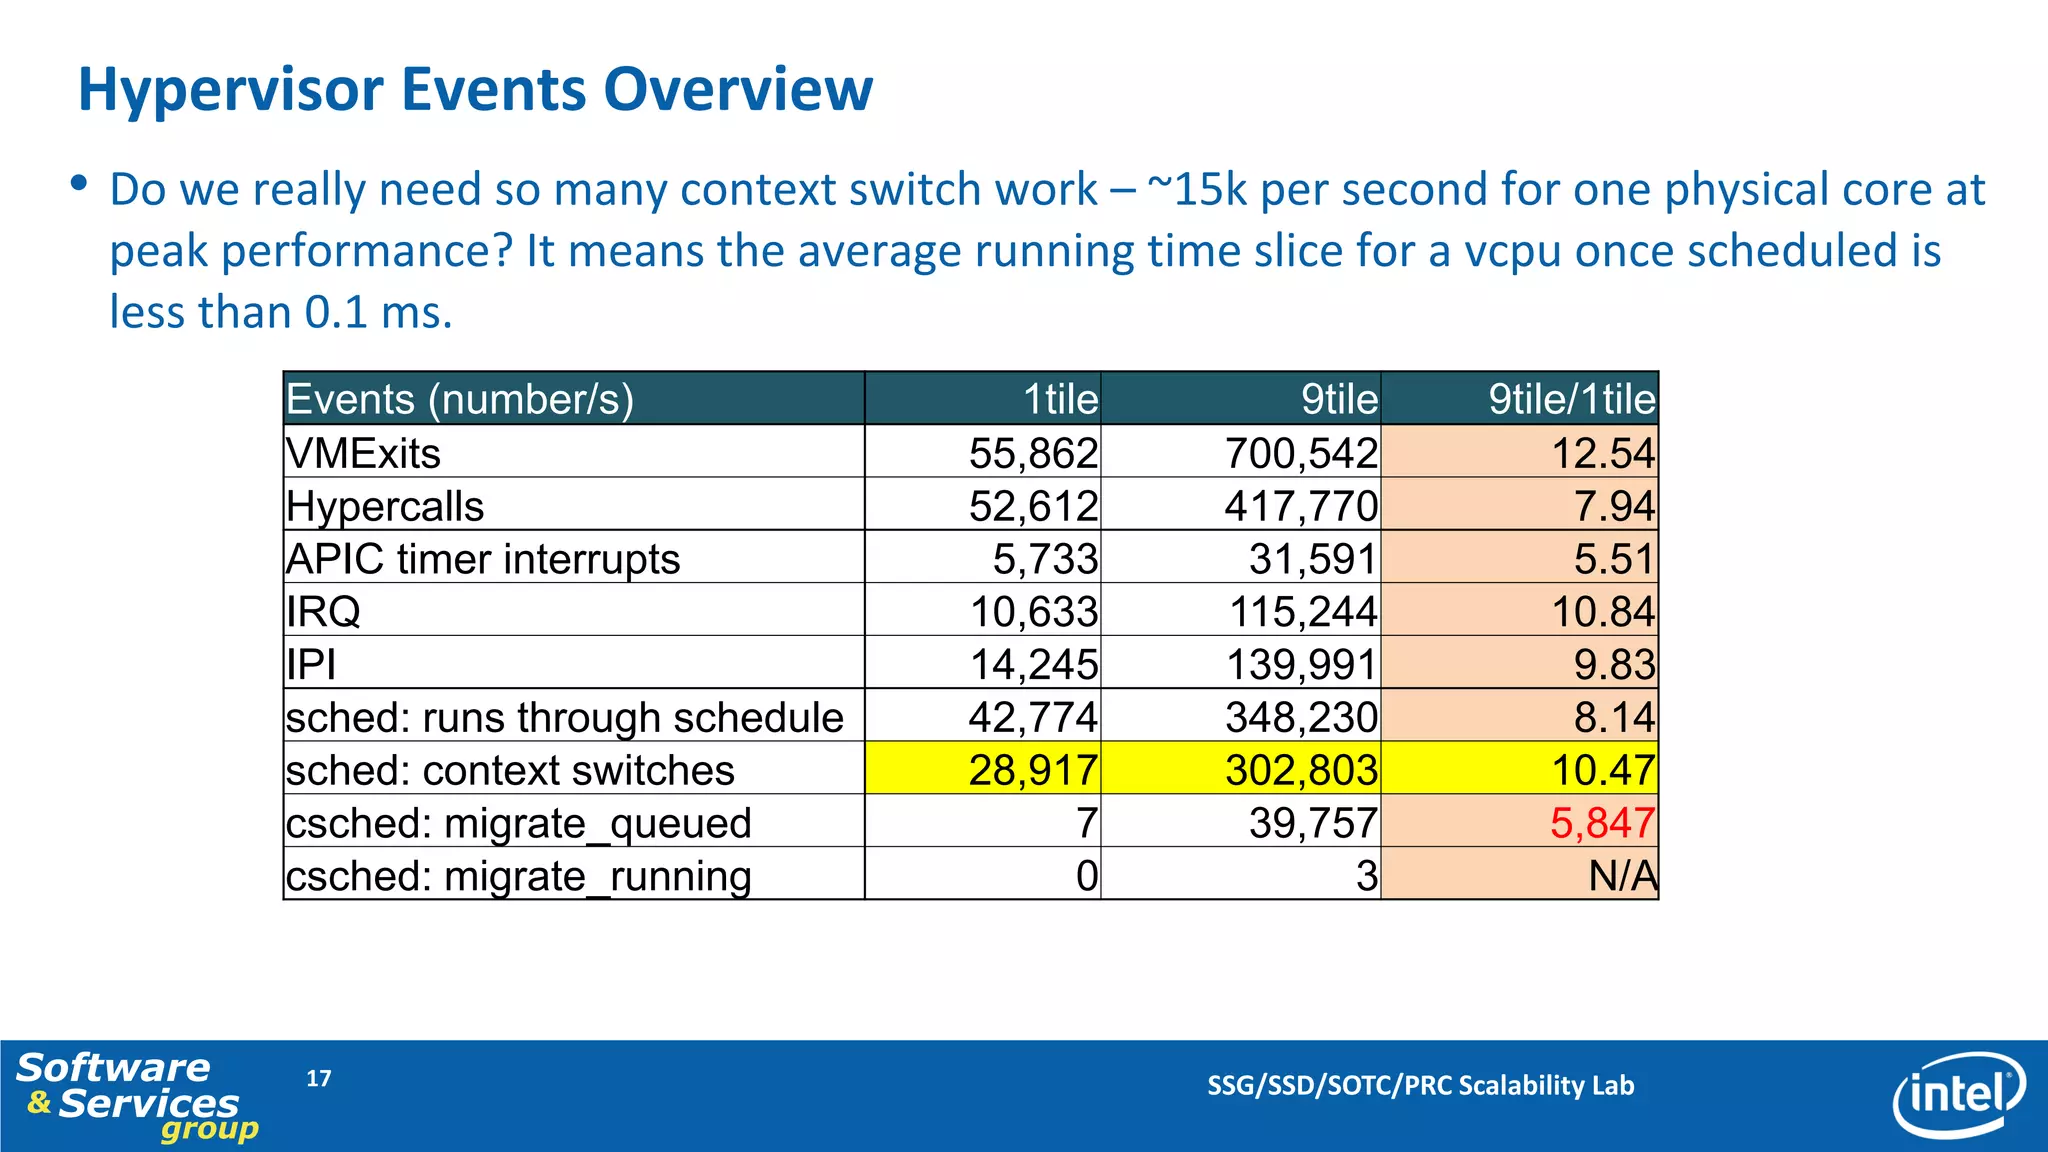
Tackling the Management Challenges of Server
                  Consolidation on Multi-core System


                                                    Hui Lv (hui.lv@intel.com)
                                      Intel SSG/SSD/SOTC/PRC Scalability Lab
                                                                   June. 2011


Software      1                 SSG/SSD/SOTC/PRC Scalability Lab
& Services
      group
Agenda

   • SPECvirt_sc2010* Introduction
   • SPECvirt_sc2010* Workload Scalability Analysis
   • Hypervisor Overhead Analysis
   • Credit Scheduler Optimizations
   • Conclusions


 * The benchmark runs discussed here are for our research and non-compliant with the SPEC run-rules. The data presented here are only
 to illustrate the points discussed in this paper and cannot be compared with any other SPECvirt_sc2010 results
Software           2                                                             SSG/SSD/SOTC/PRC Scalability Lab
& Services
         group
SPECvirt_sc2010* Workload Introduction
  • Three sub-workloads: SPECjAppServer*, SPECimap*, SPECweb*
  • Six VMs comprise a Tile – to run as many as possible tiles
  • Score: calculate arithmetic mean of the 3 normalized values per tile and sum the
   scores for all Tiles

       Infrastructure     Webserver       IMAP Server       App Server        Database          Idle Server
             VM             VM               VM                VM               VM                  VM      Tile 1


                                    Virtualization Layer (XEN) and Hardware


              SPECweb2005* Driver            SPECimap2007* Driver          SPECjAppServer2004* Driver


Software        3                                                        SSG/SSD/SOTC/PRC Scalability Lab
& Services
      group
Performance Scalability* Overview
  • Performance scaling got worse as system load increased
  • Response time became longer – worse Qos

                                                                                                                       *


                                                                                  * Response time: Geomean of three kinds
                                                                                  of sub-workload’s response time


   * The benchmark runs discussed here are for our research and non-compliant with the SPEC run-rules. The data presented here are
   only to illustrate the points discussed in this paper and cannot be compared with any other SPECvirt_sc2010 results
Software          4                                                             SSG/SSD/SOTC/PRC Scalability Lab
& Services
        group
CPU Cycles Components Breakdown
  • Hypervisor occupied 28% of the total CPU cycles per transaction – much high overheads!


Software      5                                       SSG/SSD/SOTC/PRC Scalability Lab
& Services
      group
Hypervisor Overhead Analysis
     • The VMExit event of “Ext Interrupt” consumed ~48% of hypervisor cycles
     • Context Switch consumed 27% of total hypervisor Cycles
     • Most of the context switch happened in the VMExit event of “External Interrupt”
     • Context switches: ~15k per second for one physical core at peak performance
           -- the average running tile slice for a vcpu once scheduled is less than 0.1 ms.


* The cost of VMExit is calculated by removing domain0, cpuidle (7fff). It’s the real overhead for hypervisor to process VMExit.
* Context Switch means the process of de-schedule the current running vcpu and schedule in the next vcpu

 Software               6                                                                         SSG/SSD/SOTC/PRC Scalability Lab
 & Services
             group
Optimizations for Scheduler

  • The process of scheduling consumed a big part in hypervisor. Meanwhile, high frequent
  context switch will also make cache cold thus increase the cycles per instructiion
  • We worked out one way to optimize the scheduling process, so as to reduce overhead
  and improve performance


Software      7                                          SSG/SSD/SOTC/PRC Scalability Lab
& Services
      group
Generic Scheduler Process
                                      •   Xen supplied generic API for specific
                                          implementation (credit1 and credit2)
                  Pick up next vcpu
                                      •   Two major parts in this flaw
                                          1. To pick up next vcpu (SCHED_P)
                                          2. To do context switch when selecting a new
                                             vcpu (SCHED_C)


Software      8                                      SSG/SSD/SOTC/PRC Scalability Lab
& Services
      group
Context Switch Rate Controller (SRC)
  Solution: To control scheduling rate in the following conditions
  1) To skip the current scheduling process, if the frequency of context switch is bigger than the threshold during
  last period (10 ms) and last running vcpu is still runnable (not blocked)
  2) To skip the current scheduling process, if last running vcpu runs less than some time slice (1ms) and still
  runnable
         Schedule Triggered

                                                        Y                                           Y
    VCPU1                      ? Rate Control                    ? VCPU1 Runnable                        Ret VCPU1

                                   N
                                                        Y                      N
                         ? Running less than 1ms

                                   N                                 do_schedule
Software        9                                                     SSG/SSD/SOTC/PRC Scalability Lab
& Services
       group
Performance Increase with SRC Optimization
  • Perf/(cpu utilization) boosted by 15%
  • Number of context switch reduced by 50%, thus cycles of hypervisor reduced by 22%
  • Due to less context switch, decreased cache  lower CPI  lower CPU cycles for both
    Guest and Hypervisor
                                        Base     With SRC             SRC/Base
    Perf/(cpu cycles)                     945        1,088                 1.15
    CPU% (Total)                      92.00%       80.88%                  0.88
    Guest U                           31.21%       28.56%                  0.92
    Guest K                           31.58%       28.63%                  0.91
    Dom0                               2.96%        3.20%                  1.08
    Xen                               26.23%       20.48%                  0.78
    SCHED_Total                        7.28%        4.40%                  0.60
    SCHED_Pick (credit)                2.40%        1.54%                  0.64
    SCHED_Context_Switch               2.33%        1.16%                  0.50
    Sched: runs through scheduler   6,312,866    5,304,230                 0.84
    Sched: context switches         6,008,568    3,329,377                 0.55
Software      10                                      SSG/SSD/SOTC/PRC Scalability Lab
& Services
      group
Credit1 vs. Credit2
  • Credit2 is the prototype brought in XEN 4.x.
  • So far, it can work in complex consolidation environment
  • Currently, overhead of credit2 is a bit higher than credit1 -- much faster pickup process in
    credit2, but slower context switch process
                                          Credit1       Credit2      Credit2/Credit1
    Perf/transaction                        1,254         1,077                0.86
    CPU% (Total)                         46.68%        54.47%                  1.17
    Guest U                              15.21%        16.64%                  1.09
    Guest K                              15.61%        17.24%                  1.10
    Dom0                                   1.82%         2.02%                  1.11
    Xen                                  14.04%        18.58%                  1.32
    SCHED_Total (cycles)                     0.04          0.05                1.24
    SCHED_P (cycles)                       1.32%         0.62%                 0.47
    SCHED_C (cycles)                       0.95%         1.92%                 2.02
    Sched: runs through scheduler      6,339,737     5,808,118                 0.92
    Sched: context switches            4,689,289     4,615,206                 0.98
Software      11                                          SSG/SSD/SOTC/PRC Scalability Lab
& Services
      group
Conclusion

  • Performance scalability got worse as system load increased in consolidation environment.
  • Hypervisor composed a big part of the total system cycles, ~28%
  • Too frequent context switch resulted in high overhead
  • Some kind of rate controller for Credit scheduler benefit performance improvement
  • Call people attention to continue developing a more powerful scheduler for Xen, in
   complex consolidation environment


    ® Intel and Xeon are trademarks of Intel Corporation in the United States and other countries
    * Other names and brands may be claimed as the property of others.
Software       12                                                       SSG/SSD/SOTC/PRC Scalability Lab
& Services
      group
Backup


Software      13            SSG/SSD/SOTC/PRC Scalability Lab
& Services
      group
Hardware Layout
                     SUT X5680 @ 3.33GHz
                                                                         Switch


                                           SR-IOV VFs


                                                                   Clients        Clients
                            iSCSI Direct
                                Link
                                                    iSCSI Target
                                                                             Storage Bay


                                                                                      HBA Card
                   Intel 82599 10Gbit Ethnet Adapter


Software      14                                                         SSG/SSD/SOTC/PRC Scalability Lab
& Services
      group
Server Under Test Configurations
                   Processor              Intel Xeon 5680 ®
                   Sokets/Cores/Threads   2/12/24
                   Frequency              3.33GHz
                   LLC                    12MB
                   BIOS                   HT ON, Turbo OFF, Power OFF, NUMA ON
                   Memory                 12 x 8GB DDR3
                   Platform               S5520UR
                   Controller             LSI 3801 HBA
                   Storage                ISCSI for data disk, QEMU disk for OS disk
                   Network                82599 10G NIC
                   Hypervisor             Xen upstream c/s 22940
                   VM configs             HVM Guests


Software      15                                                   SSG/SSD/SOTC/PRC Scalability Lab
& Services
      group
Which Caused the Worse Scalability
  • Cycles/transaction increase was caused by both CPI and Path Length increase
     -- Increase of CPI was partially due to increasing cache miss rate
     -- Increase of PL indicated some software bottlenecks existing


Software      16                                         SSG/SSD/SOTC/PRC Scalability Lab
& Services
      group
Hypervisor Events Overview
  • Do we really need so many context switch work – ~15k per second for one physical core at
    peak performance? It means the average running time slice for a vcpu once scheduled is
    less than 0.1 ms.
              Events (number/s)                1tile       9tile            9tile/1tile
              VMExits                        55,862     700,542                 12.54
              Hypercalls                     52,612     417,770                   7.94
              APIC timer interrupts           5,733      31,591                   5.51
              IRQ                            10,633     115,244                 10.84
              IPI                            14,245     139,991                   9.83
              sched: runs through schedule   42,774     348,230                   8.14
              sched: context switches        28,917     302,803                 10.47
              csched: migrate_queued               7     39,757                 5,847
              csched: migrate_running              0           3                   N/A


Software       17                                      SSG/SSD/SOTC/PRC Scalability Lab
& Services
      group
VMExit Events Distribution
  • At peak performance, top three VMExit events were ‘APIC Access’, ‘External Interrupt’ and
      ‘CR Access’
  •   However, larger number does not mean higher overhead – it depends on the cost of related
      VMExit event


Software        18                                      SSG/SSD/SOTC/PRC Scalability Lab
& Services
        group

Tackling the Management Challenges of Server Consolidation on Multi-core Systems

  • 1.
    Tackling the ManagementChallenges of Server Consolidation on Multi-core System Hui Lv (hui.lv@intel.com) Intel SSG/SSD/SOTC/PRC Scalability Lab June. 2011 Software 1 SSG/SSD/SOTC/PRC Scalability Lab & Services group
  • 2.
    Agenda • SPECvirt_sc2010* Introduction • SPECvirt_sc2010* Workload Scalability Analysis • Hypervisor Overhead Analysis • Credit Scheduler Optimizations • Conclusions * The benchmark runs discussed here are for our research and non-compliant with the SPEC run-rules. The data presented here are only to illustrate the points discussed in this paper and cannot be compared with any other SPECvirt_sc2010 results Software 2 SSG/SSD/SOTC/PRC Scalability Lab & Services group
  • 3.
    SPECvirt_sc2010* Workload Introduction • Three sub-workloads: SPECjAppServer*, SPECimap*, SPECweb* • Six VMs comprise a Tile – to run as many as possible tiles • Score: calculate arithmetic mean of the 3 normalized values per tile and sum the scores for all Tiles Infrastructure Webserver IMAP Server App Server Database Idle Server VM VM VM VM VM VM Tile 1 Virtualization Layer (XEN) and Hardware SPECweb2005* Driver SPECimap2007* Driver SPECjAppServer2004* Driver Software 3 SSG/SSD/SOTC/PRC Scalability Lab & Services group
  • 4.
    Performance Scalability* Overview • Performance scaling got worse as system load increased • Response time became longer – worse Qos * * Response time: Geomean of three kinds of sub-workload’s response time * The benchmark runs discussed here are for our research and non-compliant with the SPEC run-rules. The data presented here are only to illustrate the points discussed in this paper and cannot be compared with any other SPECvirt_sc2010 results Software 4 SSG/SSD/SOTC/PRC Scalability Lab & Services group
  • 5.
    CPU Cycles ComponentsBreakdown • Hypervisor occupied 28% of the total CPU cycles per transaction – much high overheads! Software 5 SSG/SSD/SOTC/PRC Scalability Lab & Services group
  • 6.
    Hypervisor Overhead Analysis • The VMExit event of “Ext Interrupt” consumed ~48% of hypervisor cycles • Context Switch consumed 27% of total hypervisor Cycles • Most of the context switch happened in the VMExit event of “External Interrupt” • Context switches: ~15k per second for one physical core at peak performance -- the average running tile slice for a vcpu once scheduled is less than 0.1 ms. * The cost of VMExit is calculated by removing domain0, cpuidle (7fff). It’s the real overhead for hypervisor to process VMExit. * Context Switch means the process of de-schedule the current running vcpu and schedule in the next vcpu Software 6 SSG/SSD/SOTC/PRC Scalability Lab & Services group
  • 7.
    Optimizations for Scheduler • The process of scheduling consumed a big part in hypervisor. Meanwhile, high frequent context switch will also make cache cold thus increase the cycles per instructiion • We worked out one way to optimize the scheduling process, so as to reduce overhead and improve performance Software 7 SSG/SSD/SOTC/PRC Scalability Lab & Services group
  • 8.
    Generic Scheduler Process • Xen supplied generic API for specific implementation (credit1 and credit2) Pick up next vcpu • Two major parts in this flaw 1. To pick up next vcpu (SCHED_P) 2. To do context switch when selecting a new vcpu (SCHED_C) Software 8 SSG/SSD/SOTC/PRC Scalability Lab & Services group
  • 9.
    Context Switch RateController (SRC) Solution: To control scheduling rate in the following conditions 1) To skip the current scheduling process, if the frequency of context switch is bigger than the threshold during last period (10 ms) and last running vcpu is still runnable (not blocked) 2) To skip the current scheduling process, if last running vcpu runs less than some time slice (1ms) and still runnable Schedule Triggered Y Y VCPU1 ? Rate Control ? VCPU1 Runnable Ret VCPU1 N Y N ? Running less than 1ms N do_schedule Software 9 SSG/SSD/SOTC/PRC Scalability Lab & Services group
  • 10.
    Performance Increase withSRC Optimization • Perf/(cpu utilization) boosted by 15% • Number of context switch reduced by 50%, thus cycles of hypervisor reduced by 22% • Due to less context switch, decreased cache  lower CPI  lower CPU cycles for both Guest and Hypervisor Base With SRC SRC/Base Perf/(cpu cycles) 945 1,088 1.15 CPU% (Total) 92.00% 80.88% 0.88 Guest U 31.21% 28.56% 0.92 Guest K 31.58% 28.63% 0.91 Dom0 2.96% 3.20% 1.08 Xen 26.23% 20.48% 0.78 SCHED_Total 7.28% 4.40% 0.60 SCHED_Pick (credit) 2.40% 1.54% 0.64 SCHED_Context_Switch 2.33% 1.16% 0.50 Sched: runs through scheduler 6,312,866 5,304,230 0.84 Sched: context switches 6,008,568 3,329,377 0.55 Software 10 SSG/SSD/SOTC/PRC Scalability Lab & Services group
  • 11.
    Credit1 vs. Credit2 • Credit2 is the prototype brought in XEN 4.x. • So far, it can work in complex consolidation environment • Currently, overhead of credit2 is a bit higher than credit1 -- much faster pickup process in credit2, but slower context switch process Credit1 Credit2 Credit2/Credit1 Perf/transaction 1,254 1,077 0.86 CPU% (Total) 46.68% 54.47% 1.17 Guest U 15.21% 16.64% 1.09 Guest K 15.61% 17.24% 1.10 Dom0 1.82% 2.02% 1.11 Xen 14.04% 18.58% 1.32 SCHED_Total (cycles) 0.04 0.05 1.24 SCHED_P (cycles) 1.32% 0.62% 0.47 SCHED_C (cycles) 0.95% 1.92% 2.02 Sched: runs through scheduler 6,339,737 5,808,118 0.92 Sched: context switches 4,689,289 4,615,206 0.98 Software 11 SSG/SSD/SOTC/PRC Scalability Lab & Services group
  • 12.
    Conclusion •Performance scalability got worse as system load increased in consolidation environment. • Hypervisor composed a big part of the total system cycles, ~28% • Too frequent context switch resulted in high overhead • Some kind of rate controller for Credit scheduler benefit performance improvement • Call people attention to continue developing a more powerful scheduler for Xen, in complex consolidation environment ® Intel and Xeon are trademarks of Intel Corporation in the United States and other countries * Other names and brands may be claimed as the property of others. Software 12 SSG/SSD/SOTC/PRC Scalability Lab & Services group
  • 13.
    Backup Software 13 SSG/SSD/SOTC/PRC Scalability Lab & Services group
  • 14.
    Hardware Layout SUT X5680 @ 3.33GHz Switch SR-IOV VFs Clients Clients iSCSI Direct Link iSCSI Target Storage Bay HBA Card Intel 82599 10Gbit Ethnet Adapter Software 14 SSG/SSD/SOTC/PRC Scalability Lab & Services group
  • 15.
    Server Under TestConfigurations Processor Intel Xeon 5680 ® Sokets/Cores/Threads 2/12/24 Frequency 3.33GHz LLC 12MB BIOS HT ON, Turbo OFF, Power OFF, NUMA ON Memory 12 x 8GB DDR3 Platform S5520UR Controller LSI 3801 HBA Storage ISCSI for data disk, QEMU disk for OS disk Network 82599 10G NIC Hypervisor Xen upstream c/s 22940 VM configs HVM Guests Software 15 SSG/SSD/SOTC/PRC Scalability Lab & Services group
  • 16.
    Which Caused theWorse Scalability • Cycles/transaction increase was caused by both CPI and Path Length increase -- Increase of CPI was partially due to increasing cache miss rate -- Increase of PL indicated some software bottlenecks existing Software 16 SSG/SSD/SOTC/PRC Scalability Lab & Services group
  • 17.
    Hypervisor Events Overview • Do we really need so many context switch work – ~15k per second for one physical core at peak performance? It means the average running time slice for a vcpu once scheduled is less than 0.1 ms. Events (number/s) 1tile 9tile 9tile/1tile VMExits 55,862 700,542 12.54 Hypercalls 52,612 417,770 7.94 APIC timer interrupts 5,733 31,591 5.51 IRQ 10,633 115,244 10.84 IPI 14,245 139,991 9.83 sched: runs through schedule 42,774 348,230 8.14 sched: context switches 28,917 302,803 10.47 csched: migrate_queued 7 39,757 5,847 csched: migrate_running 0 3 N/A Software 17 SSG/SSD/SOTC/PRC Scalability Lab & Services group
  • 18.
    VMExit Events Distribution • At peak performance, top three VMExit events were ‘APIC Access’, ‘External Interrupt’ and ‘CR Access’ • However, larger number does not mean higher overhead – it depends on the cost of related VMExit event Software 18 SSG/SSD/SOTC/PRC Scalability Lab & Services group