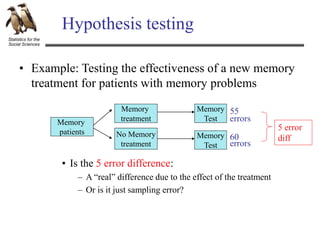
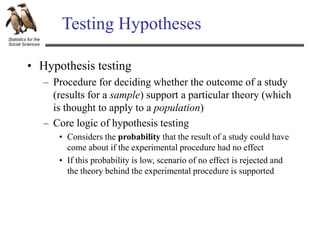
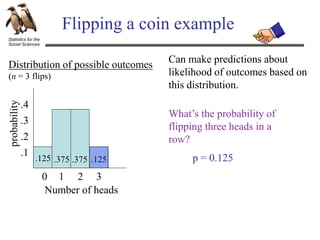
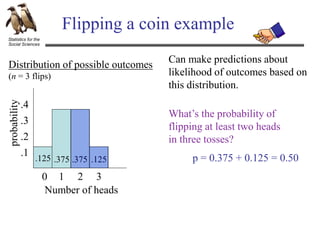
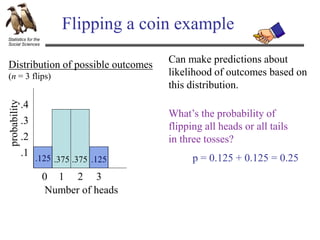
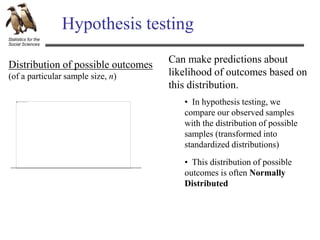
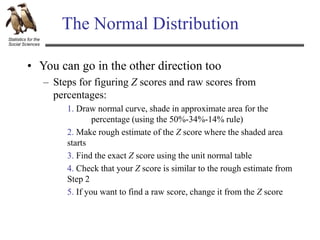
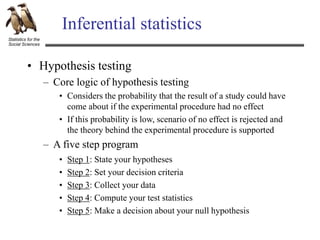
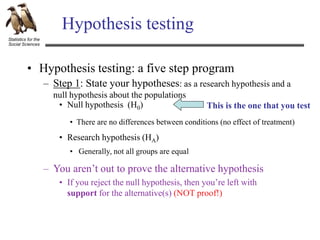
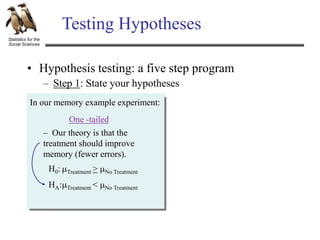
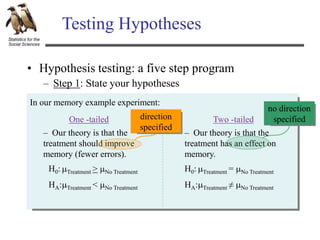
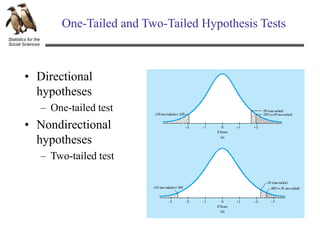
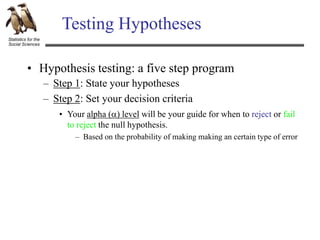
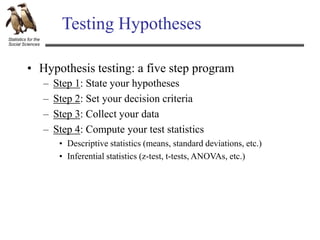
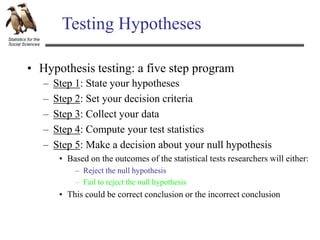
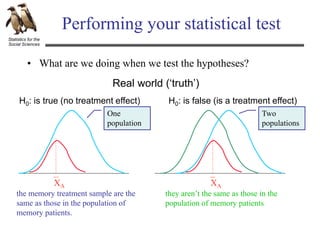
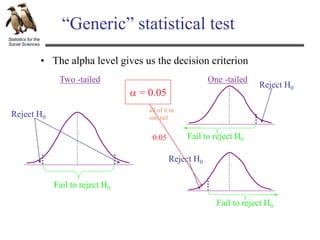
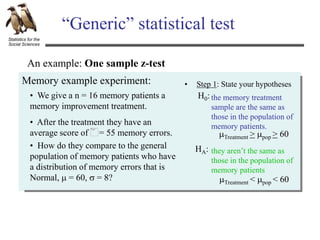
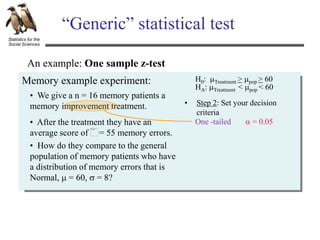
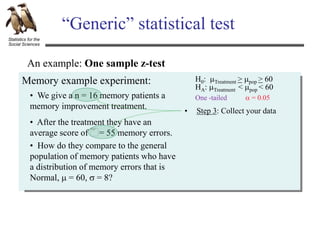
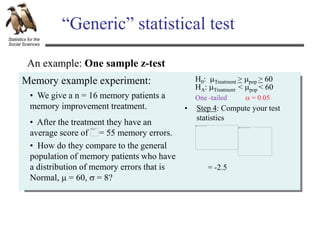
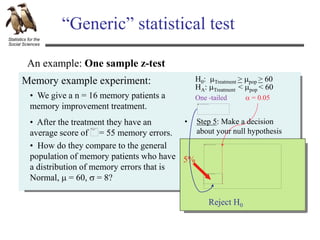
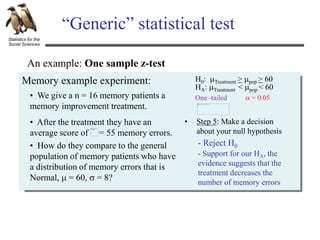
Statistics for the Social Sciences
Psychology 340
Fall 2006
Hypothesis testing
Statistics for the
Social Sciences
Outline (for week)
• Review of:
– Basic probability
– Normal distribution
– Hypothesis testing framework
• Stating hypotheses
• General test statistic and test statistic distributions
• When to reject or fail to reject
Statistics for the
Social Sciences
Hypothesis testing
• Example: Testing the effectiveness of a new memory
treatment for patients with memory problems
– Our pharmaceutical company develops a new drug
treatment that is designed to help patients with impaired
memories.
– Before we market the drug we want to see if it works.
– The drug is designed to work on all memory patients, but
we can’t test them all (the population).
– So we decide to use a sample and conduct the following
experiment.
– Based on the results from the sample we will make
conclusions about the population.
Statistics for the
Social Sciences
Hypothesis testing
• Example: Testing the effectiveness of a new memory
treatment for patients with memory problems
Memory
treatment
No Memory
treatment
Memory
patients
Memory
Test
Memory
Test
55
errors
60
errors
5 error
diff
• Is the 5 error difference:
– A “real” difference due to the effect of the treatment
– Or is it just sampling error?
Statistics for the
Social Sciences
Testing Hypotheses
• Hypothesis testing
– Procedure for deciding whether the outcome of a study
(results for a sample) support a particular theory (which
is thought to apply to a population)
– Core logic of hypothesis testing
• Considers the probability that the result of a study could have
come about if the experimental procedure had no effect
• If this probability is low, scenario of no effect is rejected and
the theory behind the experimental procedure is supported
Statistics for the
Social Sciences
Basics of Probability
• Probability
– Expected relative frequency of a particular outcome
• Outcome
– The result of an experiment
Statistics for the
Social Sciences
Flipping a coin example
What are the odds of getting a “heads”?
One outcome classified as heads
=
1
2
= 0.5
Total of two outcomes
n = 1 flip
Statistics for the
Social Sciences
Flipping a coin example
What are the odds of
getting two “heads”?
Number of heads
2
1
1
0
One 2 “heads”
outcome
Four total
outcomes
= 0.25
This situation is known as the binomial # of outcomes = 2n
n = 2
Statistics for the
Social Sciences
Flipping a coin example
What are the odds of
getting “at least one
heads”?
Number of heads
2
1
1
0
Four total
outcomes
= 0.75
Three “at least one
heads” outcome
n = 2
Statistics for the
Social Sciences
Flipping a coin example
HHH
HHT
HTH
HTT
THH
THT
TTH
TTT
Number of heads
3
2
1
0
2
2
1
1
2n = 23 = 8 total outcomes
n = 3
Statistics for the
Social Sciences
Flipping a coin example
Number of heads
3
2
1
0
2
2
1
1
X f p
3 1 .125
2 3 .375
1 3 .375
0 1 .125
Number of heads
0 1 2 3
.1
.2
.3
.4
probability
.125 .125
.375
.375
Distribution of possible outcomes
(n = 3 flips)
Statistics for the
Social Sciences
Flipping a coin example
Number of heads
0 1 2 3
.1
.2
.3
.4
probability
What’s the probability of
flipping three heads in a
row?
.125 .125
.375
.375 p = 0.125
Distribution of possible outcomes
(n = 3 flips)
Can make predictions about
likelihood of outcomes based on
this distribution.
Statistics for the
Social Sciences
Flipping a coin example
Number of heads
0 1 2 3
.1
.2
.3
.4
probability
What’s the probability of
flipping at least two heads
in three tosses?
.125 .125
.375
.375 p = 0.375 + 0.125 = 0.50
Can make predictions about
likelihood of outcomes based on
this distribution.
Distribution of possible outcomes
(n = 3 flips)
Statistics for the
Social Sciences
Flipping a coin example
Number of heads
0 1 2 3
.1
.2
.3
.4
probability
What’s the probability of
flipping all heads or all tails
in three tosses?
.125 .125
.375
.375 p = 0.125 + 0.125 = 0.25
Can make predictions about
likelihood of outcomes based on
this distribution.
Distribution of possible outcomes
(n = 3 flips)
Statistics for the
Social Sciences
Hypothesis testing
Can make predictions about
likelihood of outcomes based on
this distribution.
Distribution of possible outcomes
(of a particular sample size, n)
• In hypothesis testing, we
compare our observed samples
with the distribution of possible
samples (transformed into
standardized distributions)
• This distribution of possible
outcomes is often Normally
Distributed
Statistics for the
Social Sciences
The Normal Distribution
• The distribution of days before and after due date (bin
width = 4 days).
0 14
-14
Days before and after due date
Statistics for the
Social Sciences
The Normal Distribution
• Normal distribution
Statistics for the
Social Sciences
The Normal Distribution
• Normal distribution is a commonly found
distribution that is symmetrical and unimodal.
– Not all unimodal, symmetrical curves are Normal, so be careful
with your descriptions
• It is defined by the following equation:
1 2
-1
-2 0
Statistics for the
Social Sciences
The Unit Normal Table
z .00 .01
-3.4
-3.3
:
:
0
:
:
1.0
:
:
3.3
3.4
0.0003
0.0005
:
:
0.5000
:
:
0.8413
:
:
0.9995
0.9997
0.0003
0.0005
:
:
0.5040
:
:
0.8438
:
:
0.9995
0.9997
• Gives the precise proportion of scores (in
z-scores) between the mean (Z score of
0) and any other Z score in a Normal
distribution
– Contains the proportions in the tail to the
left of corresponding z-scores of a
Normal distribution
• This means that the table lists only
positive Z scores
• The normal distribution is often
transformed into z-scores.
Statistics for the
Social Sciences
Using the Unit Normal Table
z .00 .01
-3.4
-3.3
:
:
0
:
:
1.0
:
:
3.3
3.4
0.0003
0.0005
:
:
0.5000
:
:
0.8413
:
:
0.9995
0.9997
0.0003
0.0005
:
:
0.5040
:
:
0.8438
:
:
0.9995
0.9997
15.87% (13.59% and 2.28%)
of the scores are to the right of the score
100%-15.87% = 84.13% to the left
At z = +1:
13.59%
2.28%
34.13%
50%-34%-14% rule
1 2
-1
-2 0
Similar to the 68%-95%-99% rule
Statistics for the
Social Sciences
Using the Unit Normal Table
z .00 .01
-3.4
-3.3
:
:
0
:
:
1.0
:
:
3.3
3.4
0.0003
0.0005
:
:
0.5000
:
:
0.8413
:
:
0.9995
0.9997
0.0003
0.0005
:
:
0.5040
:
:
0.8438
:
:
0.9995
0.9997
1. Convert raw score to Z score
(if necessary)
2. Draw normal curve, where the
Z score falls on it, shade in the
area for which you are finding
the percentage
3. Make rough estimate of
shaded area’s percentage
(using 50%-34%-14% rule)
• Steps for figuring the
percentage above of below a
particular raw or Z score:
Statistics for the
Social Sciences
Using the Unit Normal Table
z .00 .01
-3.4
-3.3
:
:
0
:
:
1.0
:
:
3.3
3.4
0.0003
0.0005
:
:
0.5000
:
:
0.8413
:
:
0.9995
0.9997
0.0003
0.0005
:
:
0.5040
:
:
0.8438
:
:
0.9995
0.9997
4. Find exact percentage using
unit normal table
5. If needed, add or subtract 50%
from this percentage
6. Check the exact percentage is
within the range of the estimate
from Step 3
• Steps for figuring the
percentage above of below a
particular raw or Z score:
Statistics for the
Social Sciences
Suppose that you got a 630 on the SAT. What percent of
the people who take the SAT get your score or worse?
SAT Example problems
• The population parameters for the SAT are:
m = 500, s = 100, and it is Normally distributed
From the table:
z(1.3) =.0968
That’s 9.68%
above this score
So 90.32% got your
score or worse
Statistics for the
Social Sciences
The Normal Distribution
• You can go in the other direction too
– Steps for figuring Z scores and raw scores from
percentages:
1. Draw normal curve, shade in approximate area for the
percentage (using the 50%-34%-14% rule)
2. Make rough estimate of the Z score where the shaded area
starts
3. Find the exact Z score using the unit normal table
4. Check that your Z score is similar to the rough estimate from
Step 2
5. If you want to find a raw score, change it from the Z score
Statistics for the
Social Sciences
Inferential statistics
• Hypothesis testing
– Core logic of hypothesis testing
• Considers the probability that the result of a study could have
come about if the experimental procedure had no effect
• If this probability is low, scenario of no effect is rejected and
the theory behind the experimental procedure is supported
• Step 1: State your hypotheses
• Step 2: Set your decision criteria
• Step 3: Collect your data
• Step 4: Compute your test statistics
• Step 5: Make a decision about your null hypothesis
– A five step program
Statistics for the
Social Sciences
– Step 1: State your hypotheses: as a research hypothesis and a
null hypothesis about the populations
• Null hypothesis (H0)
• Research hypothesis (HA)
Hypothesis testing
• There are no differences between conditions (no effect of treatment)
• Generally, not all groups are equal
This is the one that you test
• Hypothesis testing: a five step program
– You aren’t out to prove the alternative hypothesis
• If you reject the null hypothesis, then you’re left with
support for the alternative(s) (NOT proof!)
Statistics for the
Social Sciences
In our memory example experiment:
Testing Hypotheses
mTreatment > mNo Treatment
mTreatment < mNo Treatment
H0:
HA:
– Our theory is that the
treatment should improve
memory (fewer errors).
– Step 1: State your hypotheses
• Hypothesis testing: a five step program
One -tailed
Statistics for the
Social Sciences
In our memory example experiment:
Testing Hypotheses
mTreatment > mNo Treatment
mTreatment < mNo Treatment
H0:
HA:
– Our theory is that the
treatment should improve
memory (fewer errors).
– Step 1: State your hypotheses
• Hypothesis testing: a five step program
mTreatment = mNo Treatment
mTreatment ≠ mNo Treatment
H0:
HA:
– Our theory is that the
treatment has an effect on
memory.
One -tailed Two -tailed
no direction
specified
direction
specified
Statistics for the
Social Sciences
One-Tailed and Two-Tailed Hypothesis Tests
• Directional
hypotheses
– One-tailed test
• Nondirectional
hypotheses
– Two-tailed test
Statistics for the
Social Sciences
Testing Hypotheses
– Step 1: State your hypotheses
– Step 2: Set your decision criteria
• Hypothesis testing: a five step program
• Your alpha () level will be your guide for when to reject or fail
to reject the null hypothesis.
– Based on the probability of making making an certain type of error
Statistics for the
Social Sciences
Testing Hypotheses
– Step 1: State your hypotheses
– Step 2: Set your decision criteria
– Step 3: Collect your data
• Hypothesis testing: a five step program
Statistics for the
Social Sciences
Testing Hypotheses
– Step 1: State your hypotheses
– Step 2: Set your decision criteria
– Step 3: Collect your data
– Step 4: Compute your test statistics
• Hypothesis testing: a five step program
• Descriptive statistics (means, standard deviations, etc.)
• Inferential statistics (z-test, t-tests, ANOVAs, etc.)
Statistics for the
Social Sciences
Testing Hypotheses
– Step 1: State your hypotheses
– Step 2: Set your decision criteria
– Step 3: Collect your data
– Step 4: Compute your test statistics
– Step 5: Make a decision about your null hypothesis
• Hypothesis testing: a five step program
• Based on the outcomes of the statistical tests researchers will either:
– Reject the null hypothesis
– Fail to reject the null hypothesis
• This could be correct conclusion or the incorrect conclusion
Statistics for the
Social Sciences
Error types
• Type I error (): concluding that there is a
difference between groups (“an effect”) when
there really isn’t.
– Sometimes called “significance level” or “alpha level”
– We try to minimize this (keep it low)
• Type II error (): concluding that there isn’t an
effect, when there really is.
– Related to the Statistical Power of a test (1-)
Statistics for the
Social Sciences
Error types
Real world (‘truth’)
H0 is
correct
H0 is
wrong
Experimenter’s
conclusions
Reject
H0
Fail to
Reject
H0
There really
isn’t an effect
There
really is
an effect
Statistics for the
Social Sciences
Error types
Real world (‘truth’)
H0 is
correct
H0 is
wrong
Experimenter’s
conclusions
Reject
H0
Fail to
Reject
H0
I conclude that
there is an
effect
I can’t detect
an effect
Statistics for the
Social Sciences
Error types
Real world (‘truth’)
H0 is
correct
H0 is
wrong
Experimenter’s
conclusions
Reject
H0
Fail to
Reject
H0
Type I
error
Type II
error
Statistics for the
Social Sciences
Performing your statistical test
H0: is true (no treatment effect) H0: is false (is a treatment effect)
Two
populations
One
population
• What are we doing when we test the hypotheses?
Real world (‘truth’)
XA
they aren’t the same as those in the
population of memory patients
XA
the memory treatment sample are the
same as those in the population of
memory patients.
Statistics for the
Social Sciences
Performing your statistical test
• What are we doing when we test the hypotheses?
– Computing a test statistic: Generic test
Could be difference between a sample and a
population, or between different samples
Based on standard error or an
estimate of the standard error
Statistics for the
Social Sciences
“Generic” statistical test
• The generic test statistic distribution (think of this as the distribution
of sample means)
– To reject the H0, you want a computed test statistics that is large
– What’s large enough?
• The alpha level gives us the decision criterion
Distribution of the test statistic
-level determines where
these boundaries go
Statistics for the
Social Sciences
“Generic” statistical test
If test statistic is
here Reject H0
If test statistic is here
Fail to reject H0
Distribution of the test statistic
• The generic test statistic distribution (think of this as the distribution
of sample means)
– To reject the H0, you want a computed test statistics that is large
– What’s large enough?
• The alpha level gives us the decision criterion
Statistics for the
Social Sciences
“Generic” statistical test
Reject H0
Fail to reject H0
• The alpha level gives us the decision criterion
One -tailed
Two -tailed
Reject H0
Fail to reject H0
Reject H0
Fail to reject H0
 = 0.05
0.025
0.025
split up
into the
two tails
Statistics for the
Social Sciences
“Generic” statistical test
Reject H0
Fail to reject H0
• The alpha level gives us the decision criterion
One -tailed
Two -tailed
Reject H0
Fail to reject H0
Reject H0
Fail to reject H0
 = 0.05
0.05
all of it in
one tail
Statistics for the
Social Sciences
“Generic” statistical test
Reject H0
Fail to reject H0
• The alpha level gives us the decision criterion
One -tailed
Two -tailed
Reject H0
Fail to reject H0
Reject H0
Fail to reject H0
 = 0.05
0.05
all of it in
one tail
Statistics for the
Social Sciences
“Generic” statistical test
An example: One sample z-test
Memory example experiment:
• We give a n = 16 memory patients a
memory improvement treatment.
• How do they compare to the general
population of memory patients who have
a distribution of memory errors that is
Normal, m = 60, s = 8?
• After the treatment they have an
average score of = 55 memory errors.
• Step 1: State your hypotheses
H0: the memory treatment
sample are the same as
those in the population of
memory patients.
HA: they aren’t the same as
those in the population of
memory patients
mTreatment > mpop > 60
mTreatment < mpop < 60
Statistics for the
Social Sciences
“Generic” statistical test
An example: One sample z-test
Memory example experiment:
• We give a n = 16 memory patients a
memory improvement treatment.
• How do they compare to the general
population of memory patients who have
a distribution of memory errors that is
Normal, m = 60, s = 8?
• After the treatment they have an
average score of = 55 memory errors.
• Step 2: Set your decision
criteria
 = 0.05
One -tailed
H0: mTreatment > mpop > 60
HA: mTreatment < mpop < 60
Statistics for the
Social Sciences
“Generic” statistical test
An example: One sample z-test
Memory example experiment:
• We give a n = 16 memory patients a
memory improvement treatment.
• How do they compare to the general
population of memory patients who have
a distribution of memory errors that is
Normal, m = 60, s = 8?
• After the treatment they have an
average score of = 55 memory errors.
 = 0.05
One -tailed
• Step 3: Collect your data
H0: mTreatment > mpop > 60
HA: mTreatment < mpop < 60
Statistics for the
Social Sciences
“Generic” statistical test
An example: One sample z-test
Memory example experiment:
• We give a n = 16 memory patients a
memory improvement treatment.
• How do they compare to the general
population of memory patients who have
a distribution of memory errors that is
Normal, m = 60, s = 8?
• After the treatment they have an
average score of = 55 memory errors.
 = 0.05
One -tailed
• Step 4: Compute your test
statistics
= -2.5
H0: mTreatment > mpop > 60
HA: mTreatment < mpop < 60
Statistics for the
Social Sciences
“Generic” statistical test
An example: One sample z-test
Memory example experiment:
• We give a n = 16 memory patients a
memory improvement treatment.
• How do they compare to the general
population of memory patients who have
a distribution of memory errors that is
Normal, m = 60, s = 8?
• After the treatment they have an
average score of = 55 memory errors.
 = 0.05
One -tailed
• Step 5: Make a decision
about your null hypothesis
5%
Reject H0
H0: mTreatment > mpop > 60
HA: mTreatment < mpop < 60
Statistics for the
Social Sciences
“Generic” statistical test
An example: One sample z-test
Memory example experiment:
• We give a n = 16 memory patients a
memory improvement treatment.
• How do they compare to the general
population of memory patients who have
a distribution of memory errors that is
Normal, m = 60, s = 8?
• After the treatment they have an
average score of = 55 memory errors.
 = 0.05
One -tailed
• Step 5: Make a decision
about your null hypothesis
- Reject H0
- Support for our HA, the
evidence suggests that the
treatment decreases the
number of memory errors
H0: mTreatment > mpop > 60
HA: mTreatment < mpop < 60

6.hypothesistesting.06

  • 1.
    Statistics for theSocial Sciences Psychology 340 Fall 2006 Hypothesis testing
  • 2.
    Statistics for the SocialSciences Outline (for week) • Review of: – Basic probability – Normal distribution – Hypothesis testing framework • Stating hypotheses • General test statistic and test statistic distributions • When to reject or fail to reject
  • 3.
    Statistics for the SocialSciences Hypothesis testing • Example: Testing the effectiveness of a new memory treatment for patients with memory problems – Our pharmaceutical company develops a new drug treatment that is designed to help patients with impaired memories. – Before we market the drug we want to see if it works. – The drug is designed to work on all memory patients, but we can’t test them all (the population). – So we decide to use a sample and conduct the following experiment. – Based on the results from the sample we will make conclusions about the population.
  • 4.
    Statistics for the SocialSciences Hypothesis testing • Example: Testing the effectiveness of a new memory treatment for patients with memory problems Memory treatment No Memory treatment Memory patients Memory Test Memory Test 55 errors 60 errors 5 error diff • Is the 5 error difference: – A “real” difference due to the effect of the treatment – Or is it just sampling error?
  • 5.
    Statistics for the SocialSciences Testing Hypotheses • Hypothesis testing – Procedure for deciding whether the outcome of a study (results for a sample) support a particular theory (which is thought to apply to a population) – Core logic of hypothesis testing • Considers the probability that the result of a study could have come about if the experimental procedure had no effect • If this probability is low, scenario of no effect is rejected and the theory behind the experimental procedure is supported
  • 6.
    Statistics for the SocialSciences Basics of Probability • Probability – Expected relative frequency of a particular outcome • Outcome – The result of an experiment
  • 7.
    Statistics for the SocialSciences Flipping a coin example What are the odds of getting a “heads”? One outcome classified as heads = 1 2 = 0.5 Total of two outcomes n = 1 flip
  • 8.
    Statistics for the SocialSciences Flipping a coin example What are the odds of getting two “heads”? Number of heads 2 1 1 0 One 2 “heads” outcome Four total outcomes = 0.25 This situation is known as the binomial # of outcomes = 2n n = 2
  • 9.
    Statistics for the SocialSciences Flipping a coin example What are the odds of getting “at least one heads”? Number of heads 2 1 1 0 Four total outcomes = 0.75 Three “at least one heads” outcome n = 2
  • 10.
    Statistics for the SocialSciences Flipping a coin example HHH HHT HTH HTT THH THT TTH TTT Number of heads 3 2 1 0 2 2 1 1 2n = 23 = 8 total outcomes n = 3
  • 11.
    Statistics for the SocialSciences Flipping a coin example Number of heads 3 2 1 0 2 2 1 1 X f p 3 1 .125 2 3 .375 1 3 .375 0 1 .125 Number of heads 0 1 2 3 .1 .2 .3 .4 probability .125 .125 .375 .375 Distribution of possible outcomes (n = 3 flips)
  • 12.
    Statistics for the SocialSciences Flipping a coin example Number of heads 0 1 2 3 .1 .2 .3 .4 probability What’s the probability of flipping three heads in a row? .125 .125 .375 .375 p = 0.125 Distribution of possible outcomes (n = 3 flips) Can make predictions about likelihood of outcomes based on this distribution.
  • 13.
    Statistics for the SocialSciences Flipping a coin example Number of heads 0 1 2 3 .1 .2 .3 .4 probability What’s the probability of flipping at least two heads in three tosses? .125 .125 .375 .375 p = 0.375 + 0.125 = 0.50 Can make predictions about likelihood of outcomes based on this distribution. Distribution of possible outcomes (n = 3 flips)
  • 14.
    Statistics for the SocialSciences Flipping a coin example Number of heads 0 1 2 3 .1 .2 .3 .4 probability What’s the probability of flipping all heads or all tails in three tosses? .125 .125 .375 .375 p = 0.125 + 0.125 = 0.25 Can make predictions about likelihood of outcomes based on this distribution. Distribution of possible outcomes (n = 3 flips)
  • 15.
    Statistics for the SocialSciences Hypothesis testing Can make predictions about likelihood of outcomes based on this distribution. Distribution of possible outcomes (of a particular sample size, n) • In hypothesis testing, we compare our observed samples with the distribution of possible samples (transformed into standardized distributions) • This distribution of possible outcomes is often Normally Distributed
  • 16.
    Statistics for the SocialSciences The Normal Distribution • The distribution of days before and after due date (bin width = 4 days). 0 14 -14 Days before and after due date
  • 17.
    Statistics for the SocialSciences The Normal Distribution • Normal distribution
  • 18.
    Statistics for the SocialSciences The Normal Distribution • Normal distribution is a commonly found distribution that is symmetrical and unimodal. – Not all unimodal, symmetrical curves are Normal, so be careful with your descriptions • It is defined by the following equation: 1 2 -1 -2 0
  • 19.
    Statistics for the SocialSciences The Unit Normal Table z .00 .01 -3.4 -3.3 : : 0 : : 1.0 : : 3.3 3.4 0.0003 0.0005 : : 0.5000 : : 0.8413 : : 0.9995 0.9997 0.0003 0.0005 : : 0.5040 : : 0.8438 : : 0.9995 0.9997 • Gives the precise proportion of scores (in z-scores) between the mean (Z score of 0) and any other Z score in a Normal distribution – Contains the proportions in the tail to the left of corresponding z-scores of a Normal distribution • This means that the table lists only positive Z scores • The normal distribution is often transformed into z-scores.
  • 20.
    Statistics for the SocialSciences Using the Unit Normal Table z .00 .01 -3.4 -3.3 : : 0 : : 1.0 : : 3.3 3.4 0.0003 0.0005 : : 0.5000 : : 0.8413 : : 0.9995 0.9997 0.0003 0.0005 : : 0.5040 : : 0.8438 : : 0.9995 0.9997 15.87% (13.59% and 2.28%) of the scores are to the right of the score 100%-15.87% = 84.13% to the left At z = +1: 13.59% 2.28% 34.13% 50%-34%-14% rule 1 2 -1 -2 0 Similar to the 68%-95%-99% rule
  • 21.
    Statistics for the SocialSciences Using the Unit Normal Table z .00 .01 -3.4 -3.3 : : 0 : : 1.0 : : 3.3 3.4 0.0003 0.0005 : : 0.5000 : : 0.8413 : : 0.9995 0.9997 0.0003 0.0005 : : 0.5040 : : 0.8438 : : 0.9995 0.9997 1. Convert raw score to Z score (if necessary) 2. Draw normal curve, where the Z score falls on it, shade in the area for which you are finding the percentage 3. Make rough estimate of shaded area’s percentage (using 50%-34%-14% rule) • Steps for figuring the percentage above of below a particular raw or Z score:
  • 22.
    Statistics for the SocialSciences Using the Unit Normal Table z .00 .01 -3.4 -3.3 : : 0 : : 1.0 : : 3.3 3.4 0.0003 0.0005 : : 0.5000 : : 0.8413 : : 0.9995 0.9997 0.0003 0.0005 : : 0.5040 : : 0.8438 : : 0.9995 0.9997 4. Find exact percentage using unit normal table 5. If needed, add or subtract 50% from this percentage 6. Check the exact percentage is within the range of the estimate from Step 3 • Steps for figuring the percentage above of below a particular raw or Z score:
  • 23.
    Statistics for the SocialSciences Suppose that you got a 630 on the SAT. What percent of the people who take the SAT get your score or worse? SAT Example problems • The population parameters for the SAT are: m = 500, s = 100, and it is Normally distributed From the table: z(1.3) =.0968 That’s 9.68% above this score So 90.32% got your score or worse
  • 24.
    Statistics for the SocialSciences The Normal Distribution • You can go in the other direction too – Steps for figuring Z scores and raw scores from percentages: 1. Draw normal curve, shade in approximate area for the percentage (using the 50%-34%-14% rule) 2. Make rough estimate of the Z score where the shaded area starts 3. Find the exact Z score using the unit normal table 4. Check that your Z score is similar to the rough estimate from Step 2 5. If you want to find a raw score, change it from the Z score
  • 25.
    Statistics for the SocialSciences Inferential statistics • Hypothesis testing – Core logic of hypothesis testing • Considers the probability that the result of a study could have come about if the experimental procedure had no effect • If this probability is low, scenario of no effect is rejected and the theory behind the experimental procedure is supported • Step 1: State your hypotheses • Step 2: Set your decision criteria • Step 3: Collect your data • Step 4: Compute your test statistics • Step 5: Make a decision about your null hypothesis – A five step program
  • 26.
    Statistics for the SocialSciences – Step 1: State your hypotheses: as a research hypothesis and a null hypothesis about the populations • Null hypothesis (H0) • Research hypothesis (HA) Hypothesis testing • There are no differences between conditions (no effect of treatment) • Generally, not all groups are equal This is the one that you test • Hypothesis testing: a five step program – You aren’t out to prove the alternative hypothesis • If you reject the null hypothesis, then you’re left with support for the alternative(s) (NOT proof!)
  • 27.
    Statistics for the SocialSciences In our memory example experiment: Testing Hypotheses mTreatment > mNo Treatment mTreatment < mNo Treatment H0: HA: – Our theory is that the treatment should improve memory (fewer errors). – Step 1: State your hypotheses • Hypothesis testing: a five step program One -tailed
  • 28.
    Statistics for the SocialSciences In our memory example experiment: Testing Hypotheses mTreatment > mNo Treatment mTreatment < mNo Treatment H0: HA: – Our theory is that the treatment should improve memory (fewer errors). – Step 1: State your hypotheses • Hypothesis testing: a five step program mTreatment = mNo Treatment mTreatment ≠ mNo Treatment H0: HA: – Our theory is that the treatment has an effect on memory. One -tailed Two -tailed no direction specified direction specified
  • 29.
    Statistics for the SocialSciences One-Tailed and Two-Tailed Hypothesis Tests • Directional hypotheses – One-tailed test • Nondirectional hypotheses – Two-tailed test
  • 30.
    Statistics for the SocialSciences Testing Hypotheses – Step 1: State your hypotheses – Step 2: Set your decision criteria • Hypothesis testing: a five step program • Your alpha () level will be your guide for when to reject or fail to reject the null hypothesis. – Based on the probability of making making an certain type of error
  • 31.
    Statistics for the SocialSciences Testing Hypotheses – Step 1: State your hypotheses – Step 2: Set your decision criteria – Step 3: Collect your data • Hypothesis testing: a five step program
  • 32.
    Statistics for the SocialSciences Testing Hypotheses – Step 1: State your hypotheses – Step 2: Set your decision criteria – Step 3: Collect your data – Step 4: Compute your test statistics • Hypothesis testing: a five step program • Descriptive statistics (means, standard deviations, etc.) • Inferential statistics (z-test, t-tests, ANOVAs, etc.)
  • 33.
    Statistics for the SocialSciences Testing Hypotheses – Step 1: State your hypotheses – Step 2: Set your decision criteria – Step 3: Collect your data – Step 4: Compute your test statistics – Step 5: Make a decision about your null hypothesis • Hypothesis testing: a five step program • Based on the outcomes of the statistical tests researchers will either: – Reject the null hypothesis – Fail to reject the null hypothesis • This could be correct conclusion or the incorrect conclusion
  • 34.
    Statistics for the SocialSciences Error types • Type I error (): concluding that there is a difference between groups (“an effect”) when there really isn’t. – Sometimes called “significance level” or “alpha level” – We try to minimize this (keep it low) • Type II error (): concluding that there isn’t an effect, when there really is. – Related to the Statistical Power of a test (1-)
  • 35.
    Statistics for the SocialSciences Error types Real world (‘truth’) H0 is correct H0 is wrong Experimenter’s conclusions Reject H0 Fail to Reject H0 There really isn’t an effect There really is an effect
  • 36.
    Statistics for the SocialSciences Error types Real world (‘truth’) H0 is correct H0 is wrong Experimenter’s conclusions Reject H0 Fail to Reject H0 I conclude that there is an effect I can’t detect an effect
  • 37.
    Statistics for the SocialSciences Error types Real world (‘truth’) H0 is correct H0 is wrong Experimenter’s conclusions Reject H0 Fail to Reject H0 Type I error Type II error
  • 38.
    Statistics for the SocialSciences Performing your statistical test H0: is true (no treatment effect) H0: is false (is a treatment effect) Two populations One population • What are we doing when we test the hypotheses? Real world (‘truth’) XA they aren’t the same as those in the population of memory patients XA the memory treatment sample are the same as those in the population of memory patients.
  • 39.
    Statistics for the SocialSciences Performing your statistical test • What are we doing when we test the hypotheses? – Computing a test statistic: Generic test Could be difference between a sample and a population, or between different samples Based on standard error or an estimate of the standard error
  • 40.
    Statistics for the SocialSciences “Generic” statistical test • The generic test statistic distribution (think of this as the distribution of sample means) – To reject the H0, you want a computed test statistics that is large – What’s large enough? • The alpha level gives us the decision criterion Distribution of the test statistic -level determines where these boundaries go
  • 41.
    Statistics for the SocialSciences “Generic” statistical test If test statistic is here Reject H0 If test statistic is here Fail to reject H0 Distribution of the test statistic • The generic test statistic distribution (think of this as the distribution of sample means) – To reject the H0, you want a computed test statistics that is large – What’s large enough? • The alpha level gives us the decision criterion
  • 42.
    Statistics for the SocialSciences “Generic” statistical test Reject H0 Fail to reject H0 • The alpha level gives us the decision criterion One -tailed Two -tailed Reject H0 Fail to reject H0 Reject H0 Fail to reject H0  = 0.05 0.025 0.025 split up into the two tails
  • 43.
    Statistics for the SocialSciences “Generic” statistical test Reject H0 Fail to reject H0 • The alpha level gives us the decision criterion One -tailed Two -tailed Reject H0 Fail to reject H0 Reject H0 Fail to reject H0  = 0.05 0.05 all of it in one tail
  • 44.
    Statistics for the SocialSciences “Generic” statistical test Reject H0 Fail to reject H0 • The alpha level gives us the decision criterion One -tailed Two -tailed Reject H0 Fail to reject H0 Reject H0 Fail to reject H0  = 0.05 0.05 all of it in one tail
  • 45.
    Statistics for the SocialSciences “Generic” statistical test An example: One sample z-test Memory example experiment: • We give a n = 16 memory patients a memory improvement treatment. • How do they compare to the general population of memory patients who have a distribution of memory errors that is Normal, m = 60, s = 8? • After the treatment they have an average score of = 55 memory errors. • Step 1: State your hypotheses H0: the memory treatment sample are the same as those in the population of memory patients. HA: they aren’t the same as those in the population of memory patients mTreatment > mpop > 60 mTreatment < mpop < 60
  • 46.
    Statistics for the SocialSciences “Generic” statistical test An example: One sample z-test Memory example experiment: • We give a n = 16 memory patients a memory improvement treatment. • How do they compare to the general population of memory patients who have a distribution of memory errors that is Normal, m = 60, s = 8? • After the treatment they have an average score of = 55 memory errors. • Step 2: Set your decision criteria  = 0.05 One -tailed H0: mTreatment > mpop > 60 HA: mTreatment < mpop < 60
  • 47.
    Statistics for the SocialSciences “Generic” statistical test An example: One sample z-test Memory example experiment: • We give a n = 16 memory patients a memory improvement treatment. • How do they compare to the general population of memory patients who have a distribution of memory errors that is Normal, m = 60, s = 8? • After the treatment they have an average score of = 55 memory errors.  = 0.05 One -tailed • Step 3: Collect your data H0: mTreatment > mpop > 60 HA: mTreatment < mpop < 60
  • 48.
    Statistics for the SocialSciences “Generic” statistical test An example: One sample z-test Memory example experiment: • We give a n = 16 memory patients a memory improvement treatment. • How do they compare to the general population of memory patients who have a distribution of memory errors that is Normal, m = 60, s = 8? • After the treatment they have an average score of = 55 memory errors.  = 0.05 One -tailed • Step 4: Compute your test statistics = -2.5 H0: mTreatment > mpop > 60 HA: mTreatment < mpop < 60
  • 49.
    Statistics for the SocialSciences “Generic” statistical test An example: One sample z-test Memory example experiment: • We give a n = 16 memory patients a memory improvement treatment. • How do they compare to the general population of memory patients who have a distribution of memory errors that is Normal, m = 60, s = 8? • After the treatment they have an average score of = 55 memory errors.  = 0.05 One -tailed • Step 5: Make a decision about your null hypothesis 5% Reject H0 H0: mTreatment > mpop > 60 HA: mTreatment < mpop < 60
  • 50.
    Statistics for the SocialSciences “Generic” statistical test An example: One sample z-test Memory example experiment: • We give a n = 16 memory patients a memory improvement treatment. • How do they compare to the general population of memory patients who have a distribution of memory errors that is Normal, m = 60, s = 8? • After the treatment they have an average score of = 55 memory errors.  = 0.05 One -tailed • Step 5: Make a decision about your null hypothesis - Reject H0 - Support for our HA, the evidence suggests that the treatment decreases the number of memory errors H0: mTreatment > mpop > 60 HA: mTreatment < mpop < 60