Download as PDF, PPTX


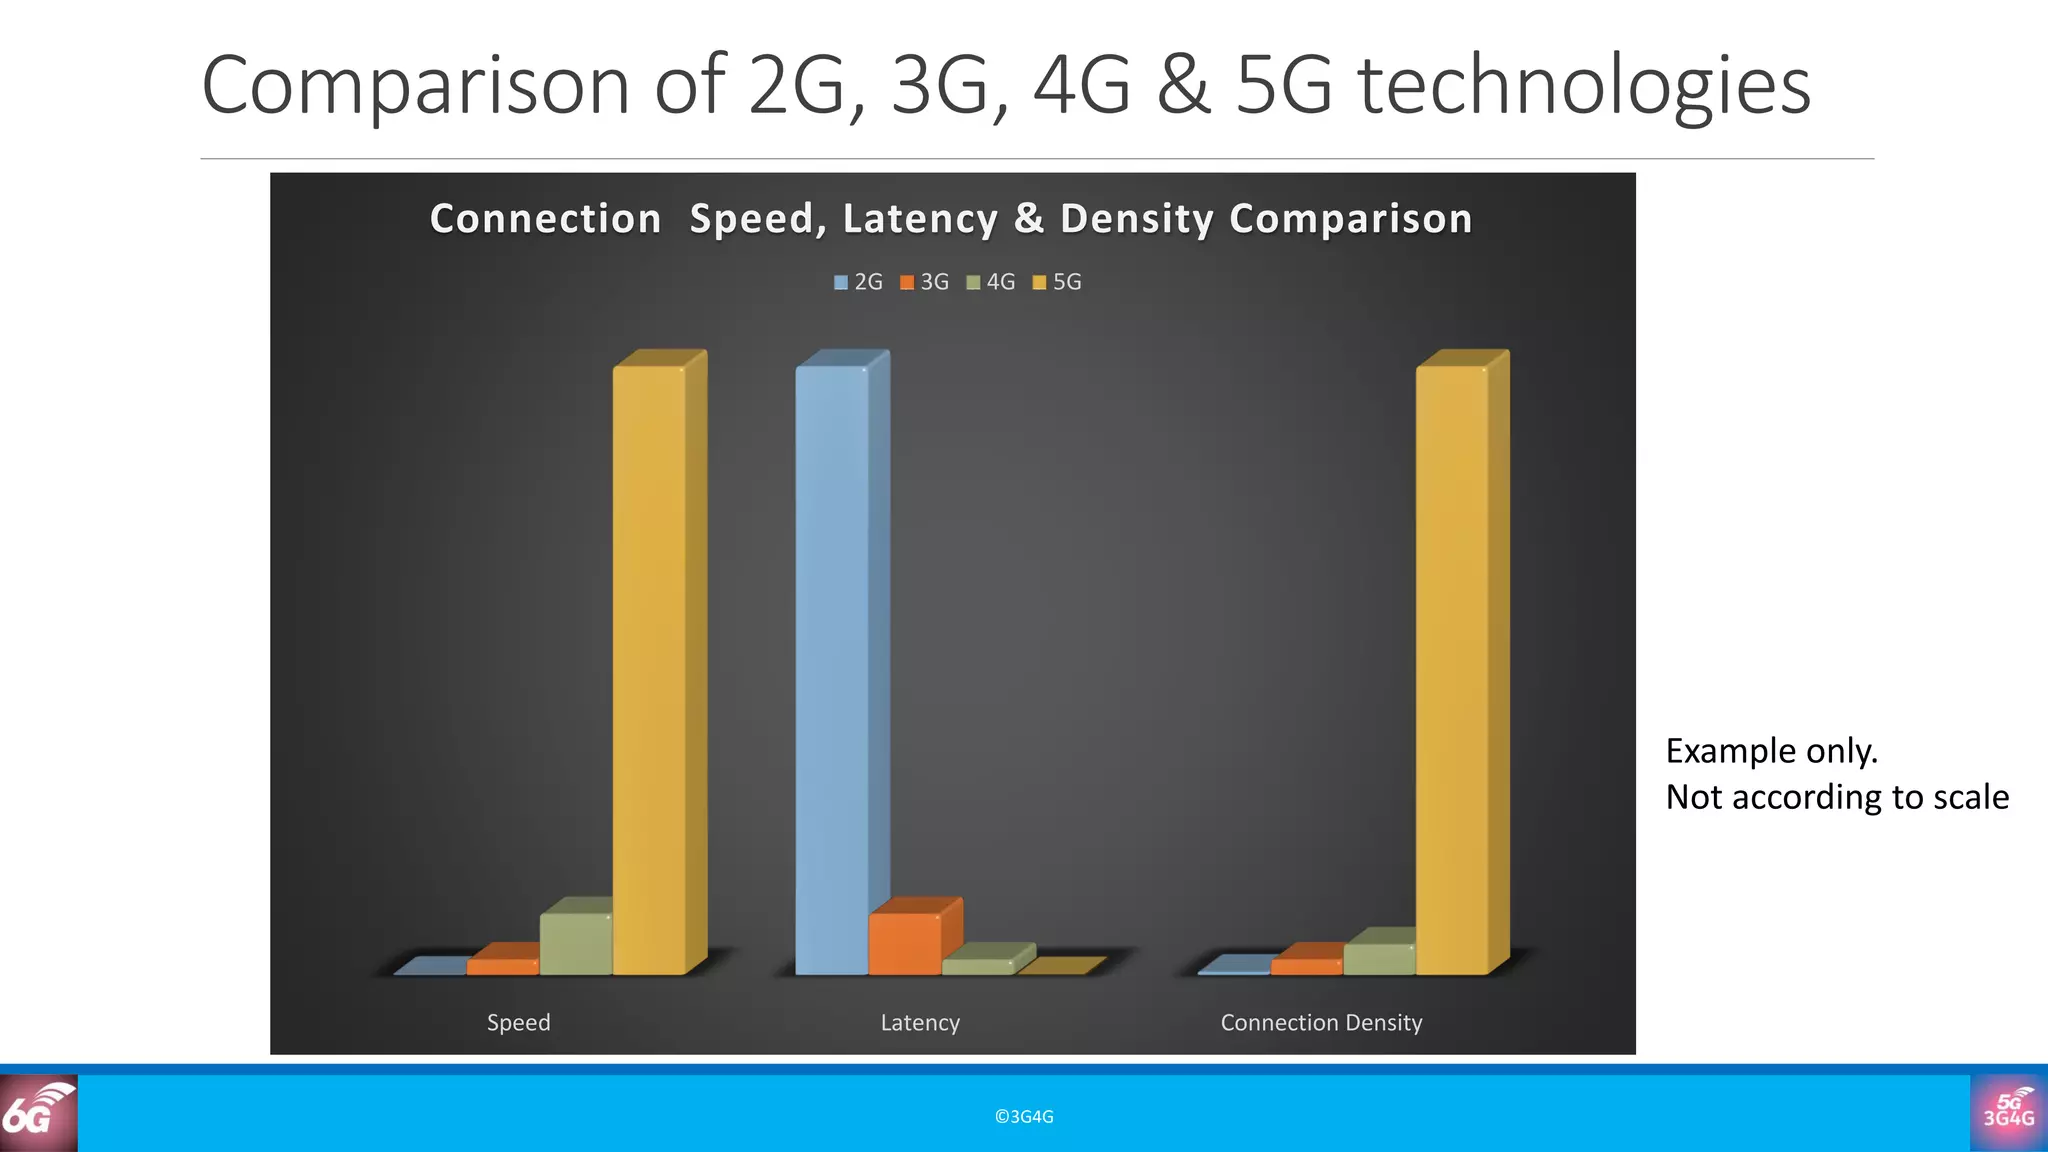


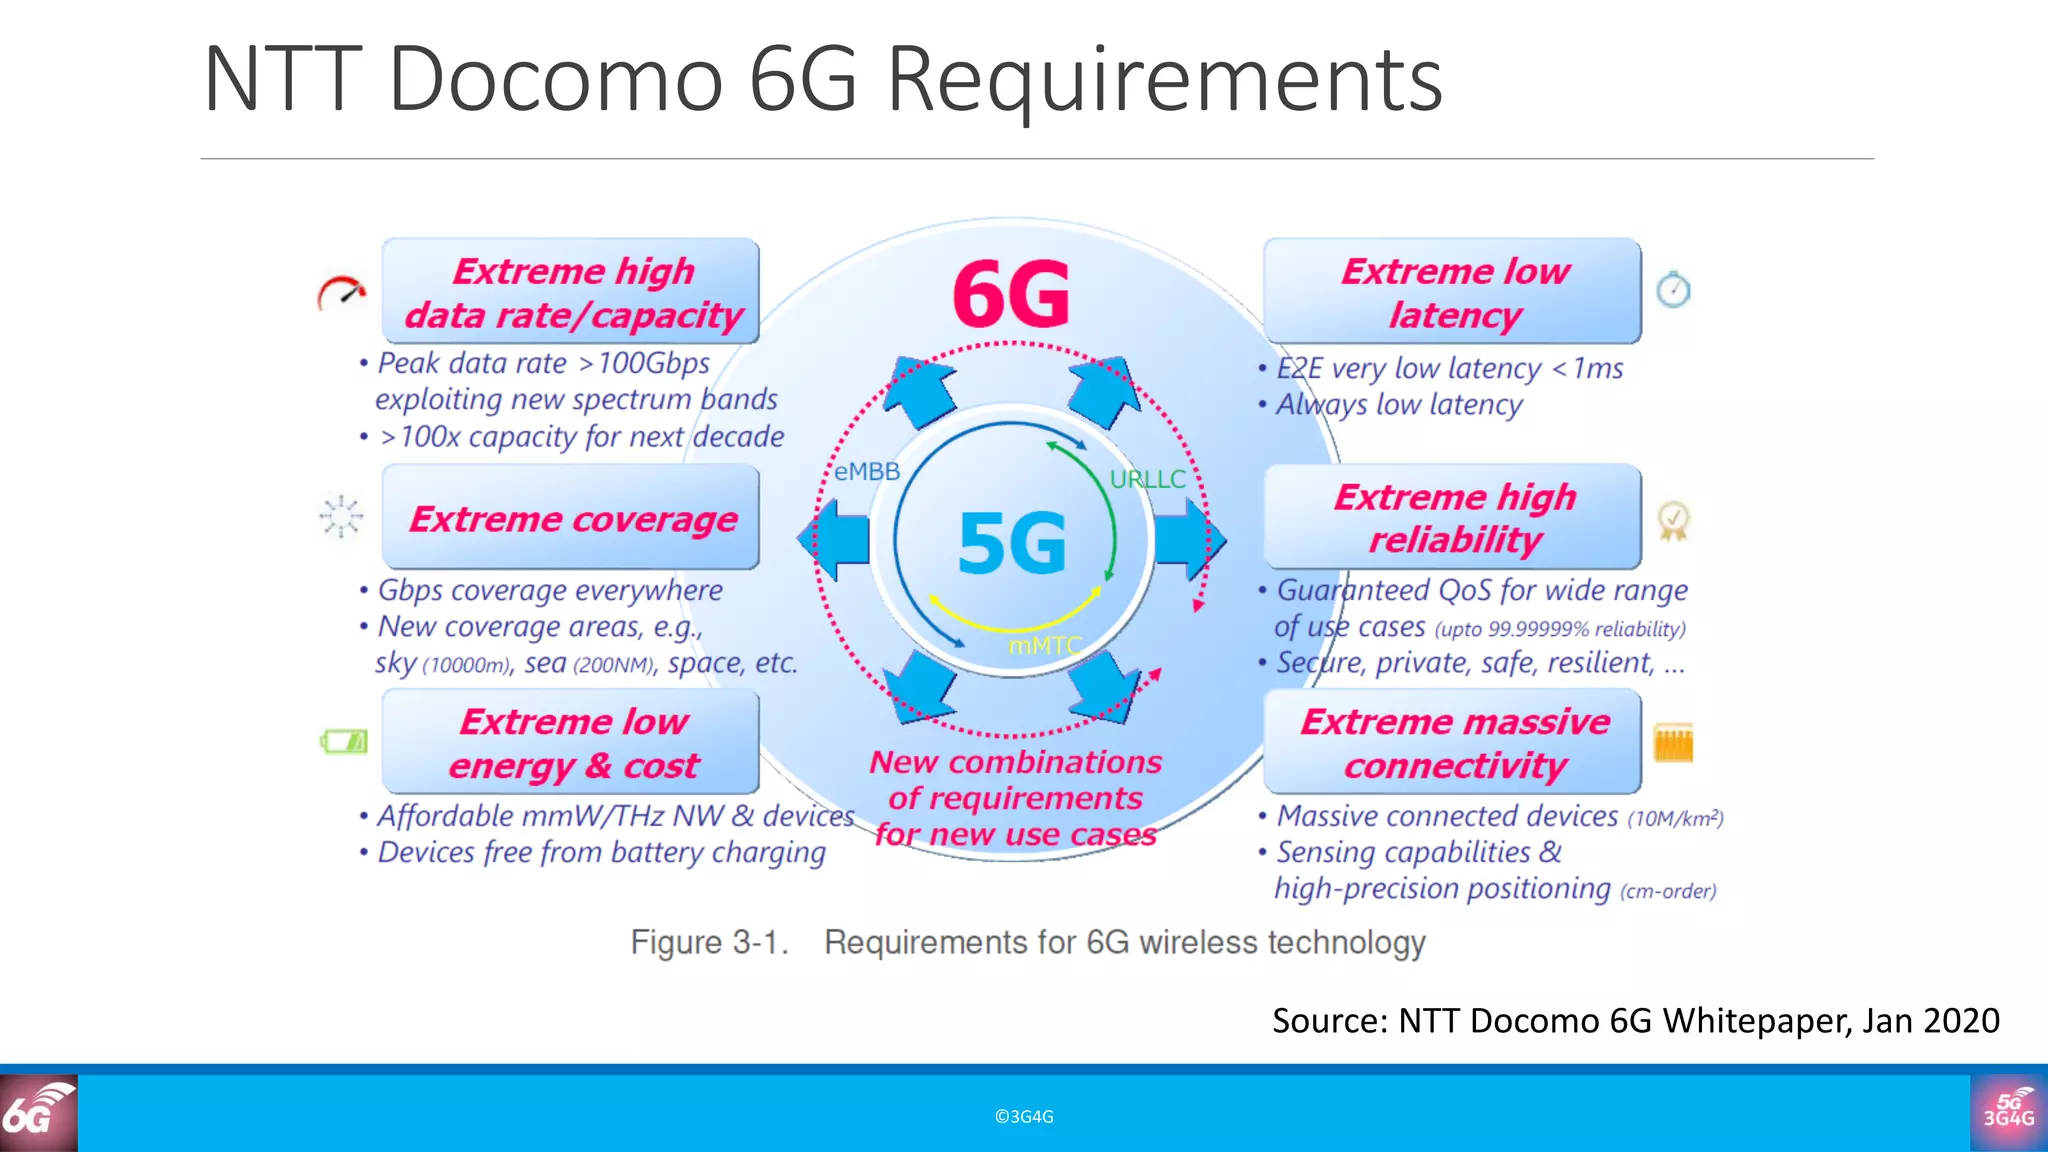
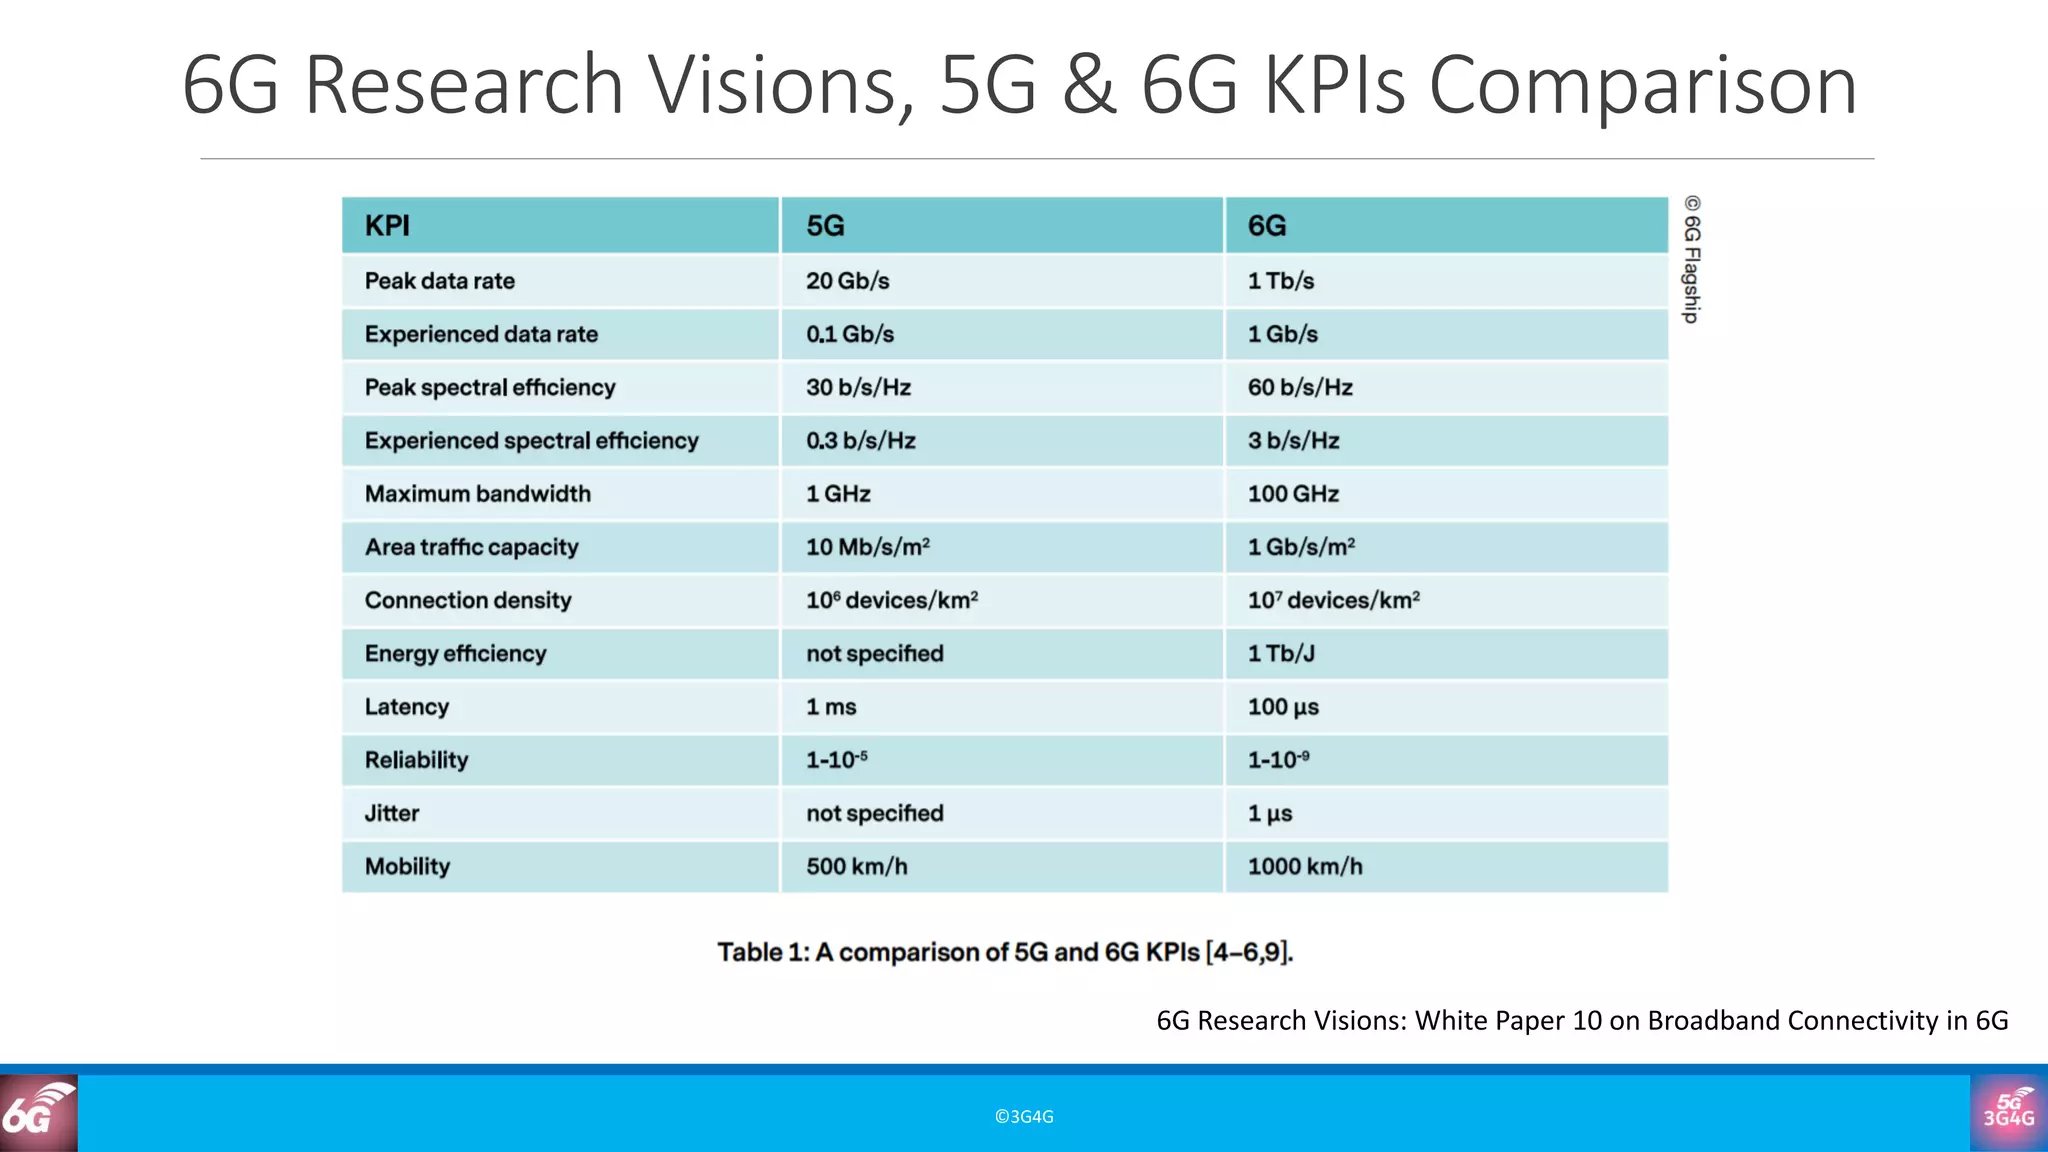
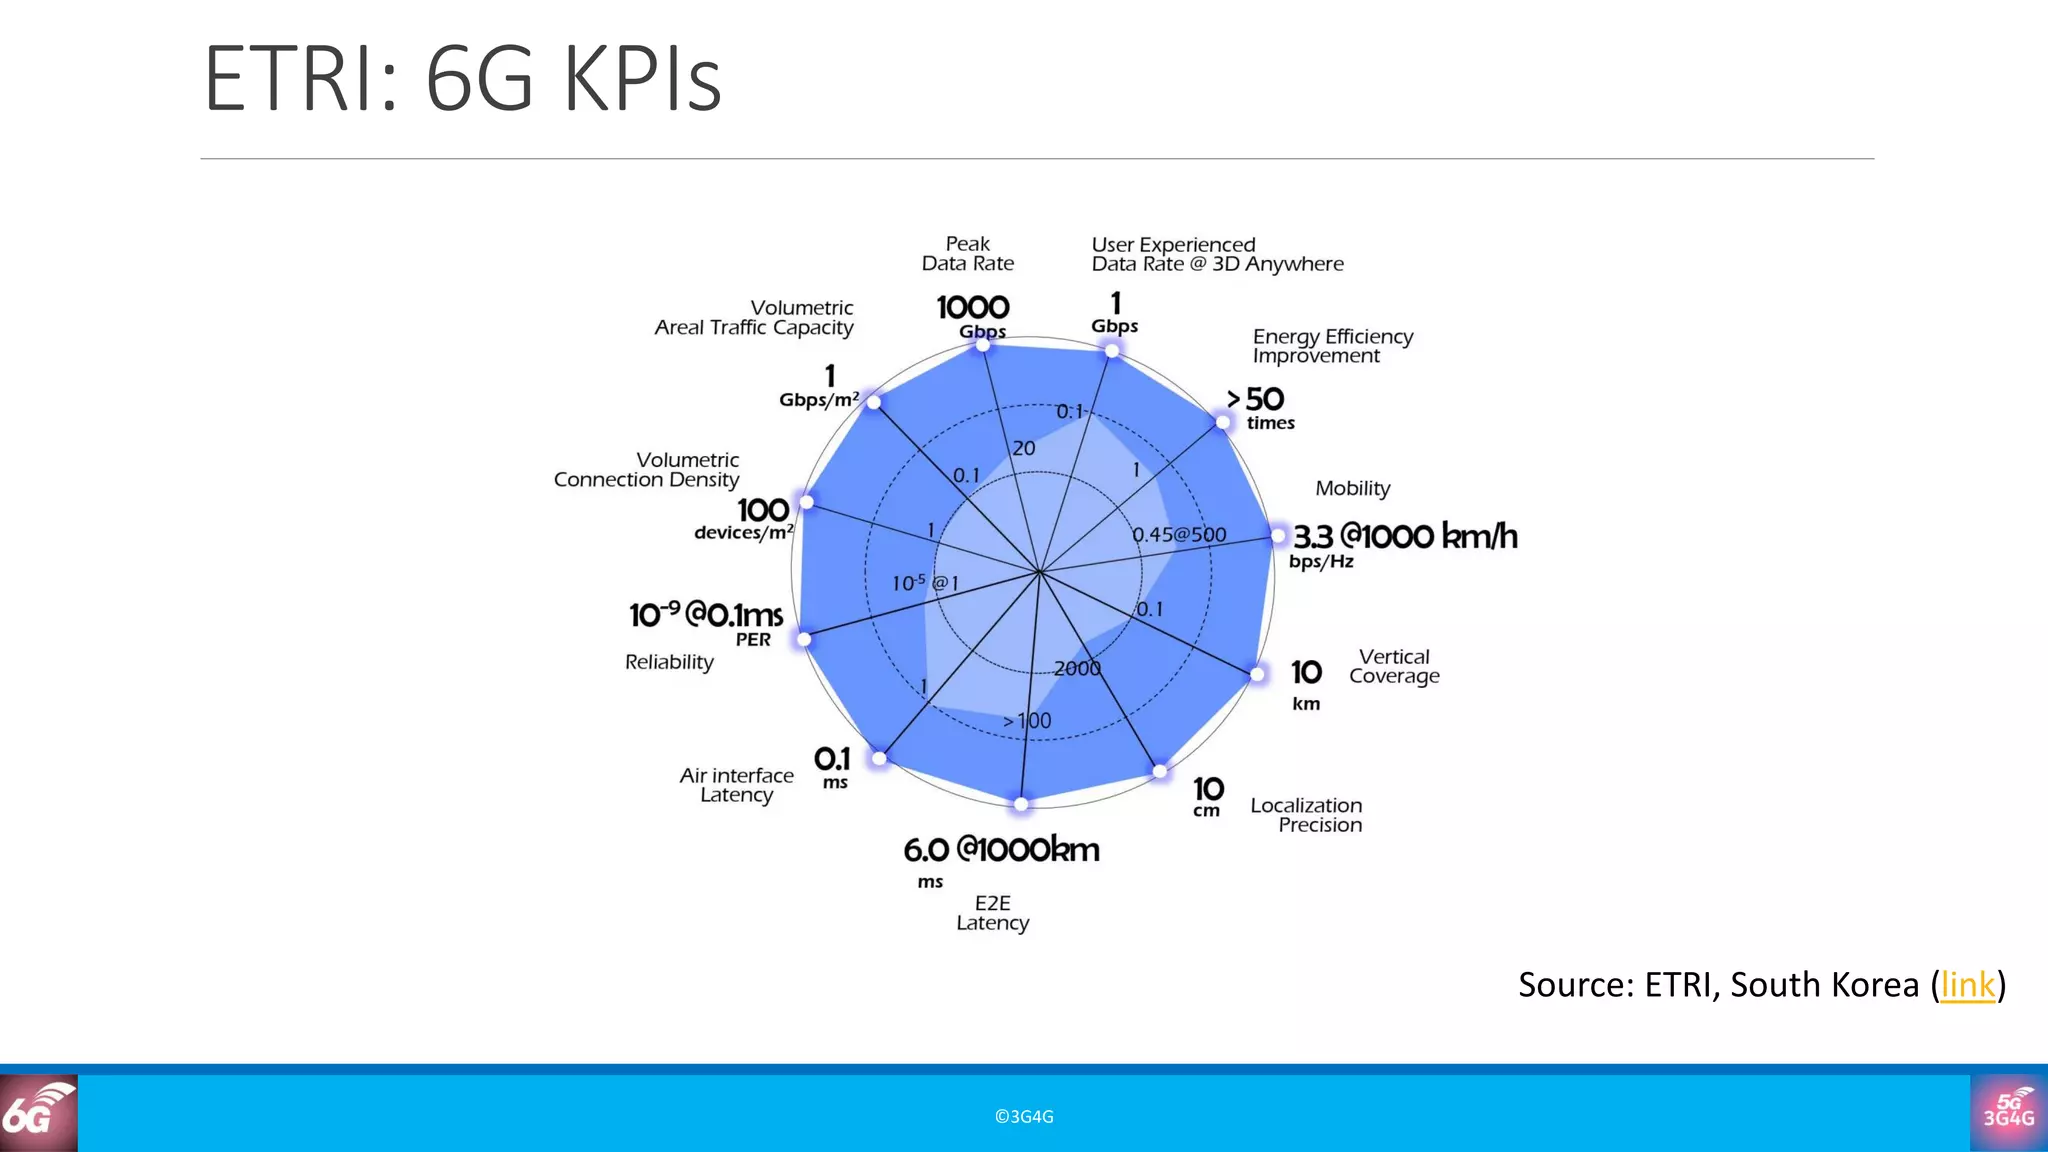


The document outlines the evolution of mobile communication technologies from 2G to 6G, highlighting key performance indicators such as download/upload speeds, latency, reliability, and connection density. It provides a comparative analysis of the requirements and advancements expected in 6G, which include significantly higher speeds and increased device density. Additionally, it references various resources for further reading and training on mobile communications.