This document provides a supplemental analysis of potential costs and benefits to the City of Hermosa Beach if a proposed oil drilling and recovery project is approved. It analyzes provisions of a development agreement negotiated between the City and the project applicant. Key findings include:
1) Under the development agreement terms, the City could realize $138-301 million over 35 years from royalties, with $46-109 million for the general fund. This is higher than the $118-270 million and $25-77 million estimated without the agreement.
2) The development agreement provides benefits like accelerated royalty payments, bonus payments ensuring $1 million minimum royalties, maintenance yard remediation and relocation, and payments

![HERMOSA BEACH - OIL DRILLING & RECOVERY COST BENEFIT ANALYSIS [DRAFT]
Table of Contents
1.0 Executive Summary ..........................................................................................................1
2.0 Background.......................................................................................................................3
3.0 Public Benefits Provided in DA .........................................................................................5
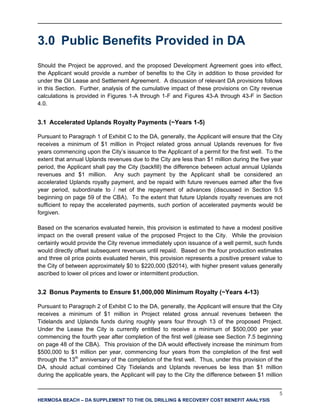
3.1 Accelerated Uplands Royalty Payments (~Years 1-5) ...................................................5
3.2 Bonus Payments to Ensure $1,000,000 Minimum Royalty (~Years 4-13) .....................5
3.3 Remediation of City Maintenance Yard ..........................................................................6
3.4 Relocation of City Maintenance Yard .............................................................................6
3.5 Payment to City to Fund Community Improvements ......................................................7
3.6 Hermosa Beach Property Fund ......................................................................................7
3.7 Cumulative Impact on City Costs ...................................................................................7
4.0 Supplemental Exhibits.......................................................................................................9
5.0 Oil Price Sensitivity .........................................................................................................21
6.0 School Revenues ............................................................................................................24
6.1 School District Revenues .............................................................................................24
6.2 Education Foundation Revenues .................................................................................24
7.0 Conclusion ......................................................................................................................25](https://image.slidesharecdn.com/6a-developmentagreementsupplement-costbenefitanalysisadded1-23-15-150209132301-conversion-gate02/85/Hermosa-Beach-Cost-Benefit-Analysis-Development-Supplemental-Agreement-2-320.jpg)
![HERMOSA BEACH - OIL DRILLING & RECOVERY COST BENEFIT ANALYSIS [DRAFT]
Index of Tables & Figures
Table 23-A: Summary of Direct City Costs (without DA) ..............................................................8
Table 23-B: Summary of Direct City Costs (DA Terms)................................................................8
Figure 1-A: Estimated Gross City Revenues, Expenses & Net Revenues ($95/BBL, without
DA, $2014)............................................................................................................10
Figure 1-B: Estimated Gross City Revenues, Expenses & Net Revenues ($95/BBL, DA
Terms, $2014).......................................................................................................10
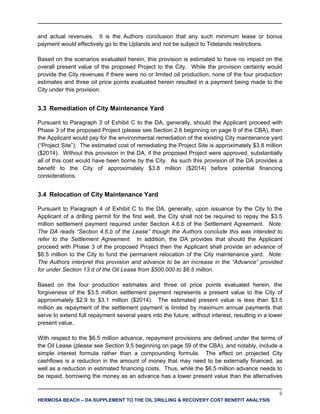
Figure 1-C: Estimated Gross City Revenues, Expenses & Net Revenues ($40/BBL, without
DA, $2014.............................................................................................................11
Figure 1-D: Estimated Gross City Revenues, Expenses & Net Revenues ($40/BBL, DA
Terms, $2014).......................................................................................................11
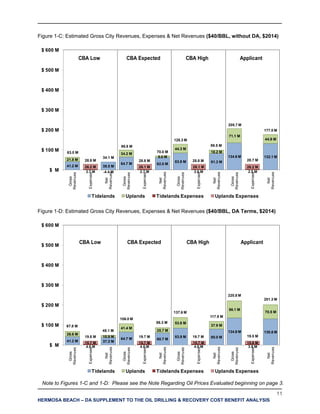
Figure 1-E: Estimated Gross City Revenues, Expenses & Net Revenues ($120/BBL, without
DA, $2014)............................................................................................................12
Figure 1-F: Estimated Gross City Revenues, Expenses & Net Revenues ($120/BBL, DA
Terms, $2014).......................................................................................................12
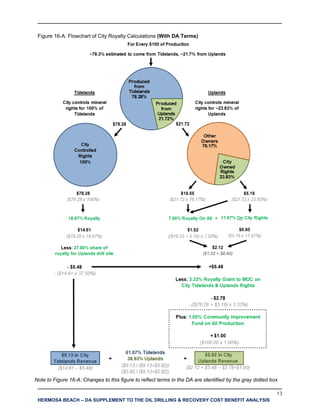
Figure 16-A: Flowchart of City Royalty Calculations (With DA Terms) .......................................13
Figure 17-A: Calculation of City Share of Oil & Gas Production (without DA & with DA
Terms)...................................................................................................................14
Figure 43-A: Summary of Net Projected Revenues with Project ($95/BBL, without DA,
$2014)...................................................................................................................15
Figure 43-B: Summary of Net Projected Revenues with Project ($95/BBL, DA Terms, $2014).16
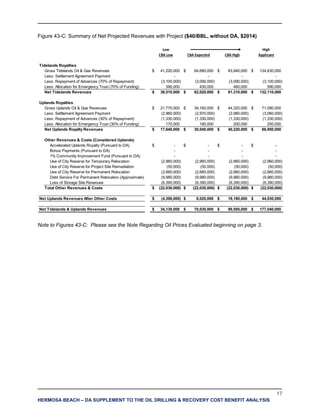
Figure 43-C: Summary of Net Projected Revenues with Project ($40/BBL, without DA,
$2014)...................................................................................................................17
Figure 43-D: Summary of Net Projected Revenues with Project ($40/BBL, DA Terms,
$2014)...................................................................................................................18
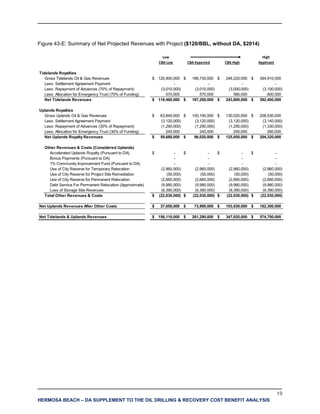
Figure 43-E: Summary of Net Projected Revenues with Project ($120/BBL, without DA,
$2014)...................................................................................................................19
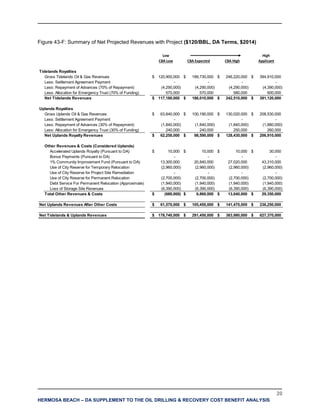
Figure 43-F: Summary of Net Projected Revenues with Project ($120/BBL, DA Terms,
$2014)...................................................................................................................20
Figure 100: Estimated Gross and Net Projected City Revenues – Range of Oil Prices
(without DA, $2014) ..............................................................................................22
Figure 101: Estimated Gross and Net Projected City Revenues – Range of Oil Prices (DA
Terms, $2014).......................................................................................................23
Figure 102: Estimated Net School District Revenues (in millions of $2014, not impacted by
DA Terms).............................................................................................................24
Figure 103: Estimated Net School District Revenues (in millions of $2014, no change under
DA Terms).............................................................................................................24](https://image.slidesharecdn.com/6a-developmentagreementsupplement-costbenefitanalysisadded1-23-15-150209132301-conversion-gate02/85/Hermosa-Beach-Cost-Benefit-Analysis-Development-Supplemental-Agreement-3-320.jpg)