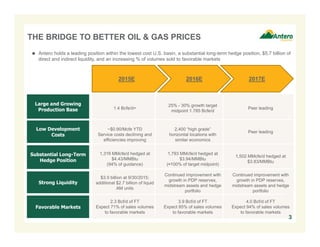
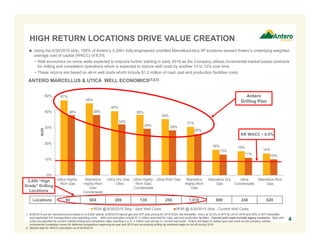
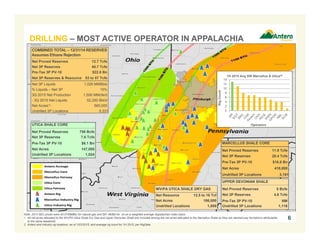
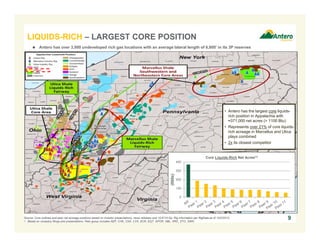
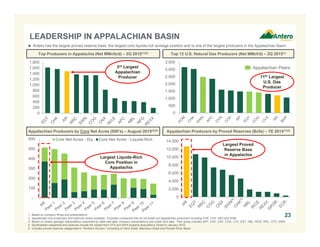
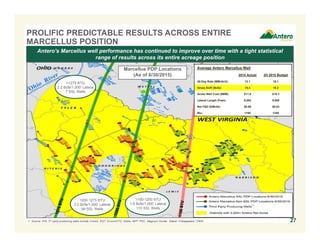
SlideShare a Scribd company logo
1 of 68
Download to read offline
Company Overview
November 2015
FORWARD-LOOKING STATEMENTS
This presentation contains forward-looking statements within the meaning of Section 27A of the Securities Act of 1933 and Section 21E of the
Securities Exchange Act of 1934. All statements, other than statements of historical facts, included in this presentation that address activities,
events or developments that Antero Resources Corporation and its subsidiaries (collectively, the “Company” or “Antero”) expects, believes or
anticipates will or may occur in the future are forward-looking statements. The words “believe,” “expect,” “anticipate,” “plan,” “intend,” “estimate,”
“project,” “foresee,” “should,” “would,” “could,” or other similar expressions are intended to identify forward-looking statements. However, the
absence of these words does not mean that the statements are not forward-looking. Without limiting the generality of the foregoing, forward-
looking statements contained in this presentation specifically include estimates of the Company’s reserves, expectations of plans, strategies,
objectives and anticipated financial and operating results of the Company, including as to the Company’s drilling program, production, hedging
activities, capital expenditure levels and other guidance included in this presentation. These statements are based on certain assumptions made
by the Company based on management’s experience and perception of historical trends, current conditions, anticipated future developments and
other factors believed to be appropriate. Such statements are subject to a number of assumptions, risks and uncertainties, many of which are
beyond the control of the Company, which may cause actual results to differ materially from those implied or expressed by the forward-looking
statements. These include the factors discussed or referenced under the heading “Item 1A. Risk Factors” in our Annual Report on Form 10-K for
the year ended December 31, 2014 and in the Company’s subsequent filings with the SEC.
The Company cautions you that these forward-looking statements are subject to all of the risks and uncertainties, most of which are difficult to
predict and many of which are beyond our control, incident to the exploration for and development, production, gathering and sale of natural gas
and oil. These risks include, but are not limited to, commodity price volatility, inflation, lack of availability of drilling and production equipment and
services, environmental risks, drilling and other operating risks, regulatory changes, the uncertainty inherent in estimating natural gas and oil
reserves and in projecting future rates of production, cash flow and access to capital, the timing of development expenditures, and the other risks
described under the heading “Risk Factors” in our Annual Report on Form 10-K for the year ended December 31, 2014 and in the Company’s
subsequent filings with the SEC.
Any forward-looking statement speaks only as of the date on which such statement is made and the Company undertakes no obligation to correct
or update any forward-looking statement, whether as a result of new information, future events or otherwise, except as required by applicable law.
1
Antero Resources Corporation is denoted as “AR” and Antero Midstream Partners LP is denoted as “AM”
in the presentation, which are their respective New York Stock Exchange ticker symbols.
2
CHANGES SINCE OCTOBER 2015 PRESENTATION
Updated AR and AM standalone leverage and liquidity
slides for 9/30/2015 pricing
Slide 14
Updated AR slide showing 3Q 2015 natural gas and
equivalent realizations
Slide 15
Updated AR slide showing liquidity position and debt maturity
position as of 9/30/2015
Slide 56
Updated AR slide showing debt position and financial and
operating statistics as of 9/30/2015
Slide 45
Updated AM slide showing capitalization table and cash
position as of 9/30/2015
Slide 43
Updated EBITDAX reconciliation slide as of 9/30/2015
Slide 66
THE BRIDGE TO BETTER OIL & GAS PRICES
2015E 2016E 2017E
Large and Growing
Production Base
Low Development
Costs
Substantial Long-Term
Hedge Position
Strong Liquidity
Favorable Markets
1.4 Bcfe/d+
25% - 30% growth target
midpoint 1.785 Bcfe/d
Peer leading
~$0.90/Mcfe YTD
Service costs declining and
efficiencies improving
2,400 “high grade”
horizontal locations with
similar economics
Peer leading
1,316 MMcfe/d hedged at
$4.43/MMBtu
(94% of guidance)
1,793 MMcfe/d hedged at
$3.94/MMBtu
(≈100% of target midpoint)
1,502 MMcfe/d hedged at
$3.83/MMBtu
$3.0 billion at 9/30/2015;
additional $2.7 billion of liquid
AM units
Continued improvement with
growth in PDP reserves,
midstream assets and hedge
portfolio
Continued improvement with
growth in PDP reserves,
midstream assets and hedge
portfolio
2.3 Bcf/d of FT
Expect 71% of sales volumes
to favorable markets
3.9 Bcf/d of FT
Expect 85% of sales volumes
to favorable markets
4.0 Bcf/d of FT
Expect 94% of sales volumes
to favorable markets
 Antero holds a leading position within the lowest cost U.S. basin, a substantial long-term hedge position, $5.7 billion of
direct and indirect liquidity, and an increasing % of volumes sold to favorable markets
3
47%
45%
40%
38%
35%
31%
16% 15%
14%
38% 38%
32%
29% 28%
26%
13%
11% 10%
0%
10%
20%
30%
40%
50%
Utica Highly-
Rich Gas
Marcellus
Highly-Rich
Gas/
Condensate
Utica Dry Gas
- Ohio
Utica Highly-
Rich Gas/
Condensate
Utica Rich Gas Marcellus
Highly-Rich
Gas
Marcellus Dry
Gas
Utica
Condensate
Marcellus Rich
Gas
ROR
ROR @ 6/30/2015 Strip - Spot Well Costs ROR @ 6/30/2015 Strip - Current Well Costs
AR WACC ≈ 8.5%
Antero
Drilling Plan
Locations 94 664 289 139 254 1,010 889 248 628
1. 6/30/2015 pre-tax well economics based on a 9,000’ lateral, 6/30/2015 natural gas and WTI strip pricing for 2015-2024, flat thereafter, NGLs at 32.5% of WTI for 2015–2016 and 50% of WTI thereafter,
and applicable firm transportation and operating costs . Well cost estimates include $1.2 million assumed for road, pad and production facilities. Current well costs include legacy contracts. Spot well
costs are adjusted for current market drilling and completion rates resulting in a $1.2 million cost saving vs. current well costs. Antero will begin to realize spot well costs as the company utilizes
incremental completion crews for deferred completions beginning at year end 2015 and as existing drilling rig contracts begin to roll off during 2016.
2. Market data for WACC calculation as of 8/25/2015.
HIGH RETURN LOCATIONS DRIVE VALUE CREATION
4
 Using the 6/30/2015 strip, 100% of Antero’s 4,200+ fully-engineered undrilled Marcellus/Utica 3P locations exceed Antero’s underlying weighted
average cost of capital (WACC) of 8.5%
− Well economics on some wells expected to improve further starting in early 2016 as the Company utilizes incremental market based contracts
for drilling and completion operations which is expected to reduce well costs by another 10 to 12% over time
− These returns are based on all-in well costs which include $1.2 million of road, pad and production facilities costs
ANTERO MARCELLUS & UTICA WELL ECONOMICS(1)(2)
2,450 “High
Grade” Drilling
Locations
5
Most Active Operator
in Appalachia
Largest Firm Transport
and Processing
Portfolio in Appalachia
Largest Gas Hedge
Position in U.S. E&P +
Strong Financial
Liquidity
Highest Growth
Large Cap E&P
Largest Core Liquids-
Rich Position in
Appalachia
Highest Realizations
and Margins Among
Large Cap
Appalachian Peers
Growth Liquids-Rich
Hedging &
Liquidity
Midstream
Drilling
LEADING UNCONVENTIONAL BUSINESS MODEL
MLP (NYSE: AM)
Highlights
Substantial Value in
Midstream Business
Realizations
Takeaway
Well
Economics
1
2 3
4
5
67
8
Premier Appalachian
E&P Company
Run by Co-Founders
Low Break-Even
Price Economics
Note: 2014 SEC prices were $4.07/MMBtu for natural gas and $81.48/Bbl for oil on a weighted average Appalachian index basis.
1. All net acres allocated to the WV/PA Utica Shale Dry Gas and Upper Devonian Shale are included among the net acres allocated to the Marcellus Shale as they are stacked pay formations attributable
to the same leasehold.
2. Antero and industry rig locations as of 10/2/2015, and average rig count for 1H 2015, per RigData.
DRILLING – MOST ACTIVE OPERATOR IN APPALACHIA
6
COMBINED TOTAL – 12/31/14 RESERVES
Assumes Ethane Rejection
Net Proved Reserves 12.7 Tcfe
Net 3P Reserves 40.7 Tcfe
Pre-Tax 3P PV-10 $22.8 Bn
Net 3P Reserves & Resource 53 to 57 Tcfe
Net 3P Liquids 1,026 MMBbls
% Liquids – Net 3P 15%
3Q 2015 Net Production 1,506 MMcfe/d
- 3Q 2015 Net Liquids 52,250 Bbl/d
Net Acres(1) 565,000
Undrilled 3P Locations 5,331
UTICA SHALE CORE
Net Proved Reserves 758 Bcfe
Net 3P Reserves 7.6 Tcfe
Pre-Tax 3P PV-10 $6.1 Bn
Net Acres 147,000
Undrilled 3P Locations 1,024
MARCELLUS SHALE CORE
Net Proved Reserves 11.9 Tcfe
Net 3P Reserves 28.4 Tcfe
Pre-Tax 3P PV-10 $16.8 Bn
Net Acres 418,000
Undrilled 3P Locations 3,191
UPPER DEVONIAN SHALE
Net Proved Reserves 8 Bcfe
Net 3P Reserves 4.6 Tcfe
Pre-Tax 3P PV-10 NM
Undrilled 3P Locations 1,116
WV/PA UTICA SHALE DRY GAS
Net Resource 12.5 to 16 Tcf
Net Acres 186,000
Undrilled Locations 1,889
0
2
4
6
8
10
12
14
RigCount
Operators
1H 2015 Avg SW Marcellus & Utica(2)
0.25
0.50
0.75
1.00
1.25
1.50
4Q'13 Annualized 2014A 2015E
29%
22%
19%
17%
10%
(4%)
-10%
-5%
0%
5%
10%
15%
20%
25%
30%
35%
AR Peer 1 Peer 2 Peer 3 Peer 4 Peer 5
GROWTH – DEBT-ADJUSTED PER SHARE PRODUCTION
7
 Based on the strength of its drilling program, and focus on the highly prolific Marcellus and Utica
Shale core areas, Antero has delivered 29% compounded annual growth in net debt-adjusted
production per share since its IPO in October 2013
 Antero’s net debt-adjusted production per share growth rate is seven percentage points higher than
the next closest Appalachian peer
NOTE: Production/Net Debt-Adjusted Share = total production divided by net debt-adjusted shares outstanding each period.
1. Net debt-adjusted shares = net debt at end of each period/stock price average for each respective period, plus average common shares outstanding each respective period.
2. Peers include CNX, COG, EQT, RRC, SWN.
AR Annualized Production / Net Debt-Adjusted Share(1)
Mcfe/Share
Net Debt-Adjusted Production per Share Growth vs. Peers (2)
(Since AR IPO)
0
10,000
20,000
30,000
40,000
2010 2011 2012 2013 2014 2015E
NGLs (C3+) Oil
5 246
6,436
23,051
37,000+
61%+ Growth
Guidance1. Assumes ethane rejection.
2. Reflects midpoint of 2016 production growth target of 25%-30%.
1,400
1,785
0
600
1,200
1,800
2010 2011 2012 2013 2014 2015E 2016E
Marcellus Utica Guidance
30
124
239
522
1,007
8
AVERAGE NET DAILY PRODUCTION (MMcfe/d)
0
50
100
150
200
2010 2011 2012 2013 2014 2015E
Marcellus Utica Deferred Completions
19
38
60
114
177 180
130
GROWTH – STRONG TRACK RECORD
OPERATED GROSS WELLS COMPLETED
40%+ Growth
Guidance
0
3,000
6,000
9,000
12,000
15,000
2010 2011 2012 2013 2014
Marcellus Utica
677
2,844
4,283
7,632
(1) (1)
12,683
(1)
NET PROVED RESERVES (Bcfe)
AVERAGE NET DAILY LIQUIDS PRODUCTION (Bbl/d)
+
25%-30%
Growth
Target
(2)
9
LIQUIDS-RICH – LARGEST CORE POSITION
Source: Core outlines and peer net acreage positions based on investor presentations, news releases and 10-K/10-Qs. Rig information per RigData as of 10/2/2015.
1. Based on company filings and presentations. Peer group includes AEP, CHK, CNX, CVX, ECR, EQT, GPOR, NBL, RRC, STO, SWN.
• Antero has the largest core liquids-
rich position in Appalachia with
≈371,000 net acres (> 1100 Btu)
• Represents over 21% of core liquids-
rich acreage in Marcellus and Utica
plays combined
• 2x its closest competitor
 Antero has over 3,000 undeveloped rich gas locations with an average lateral length of 6,800’ in its 3P reserves
0
100
200
300
400
(000s)
Core Liquids-Rich Net Acres(1)
$39 $42
$44
$51 $53 $54
$60
$64
$65
$68 $69
$72
$83
$86
$0
$20
$40
$60
$80
$100
WTIPrice($/Bbl)
Antero 2015
Drilling Plan
$1.94 $2.20 $2.20 $2.37
$2.96 $3.13 $3.31 $3.48 $3.50 $3.63 $3.77 $3.85 $3.88 $3.98
$4.33 $4.38
$5.56 $5.62 $5.69 $5.71 $5.74
$0.00
$1.00
$2.00
$3.00
$4.00
$5.00
$6.00
$7.00
NYMEXPrice($/MMBtu)
Antero 2015
Drilling Plan
Assumes $65/Bbl WTI Oil(3)
WELL ECONOMICS – LOW BREAK-EVEN
PRICE ECONOMICS
North American Gas Resource Play Breakeven Natural Gas Prices ($/MMBtu)(3)
10
North American Breakeven Oil Prices ($/Bbl)(1)
2015 NYMEX Strip: $3.01/MMBtu(2)
2015 WTI Strip: $56.26/Bbl(2)
 Marcellus and Utica undeveloped 3P rich-gas locations have the lowest breakeven prices for both oil and natural gas compared to other
U.S. shale plays
1. Source: Credit Suisse report dated December 2014 – Break-even WTI oil price to generate 15% after-tax rate of return. Assumes NYMEX gas price of $3.66/MMBtu for 2015-2019; $4.23/MMBtu thereafter.
2. 2015 one year WTI crude oil strip price as of 12/31/2014; NYMEX one year natural gas strip price as of 12/31/2014.
3. Source: Credit Suisse report dated December 2014 – Break-even NYMEX gas price to generate 15% after-tax rate of return. Assumes WTI oil price of $64.74/Bbl for 2015-2019; $70.50/Bbl thereafter; NGLs at
35% of WTI vs. Antero guidance of 30%-35% of WTI for 2015-2016 and 50% of WTI for 2017 and thereafter, driven by completion of Mariner East II project expected by year-end 2016.
Antero Projects
Assumes $3.66/MMBtu NYMEX Gas(1)
Antero Resources
Corporation (NYSE: AR)
$10.0 Billion Enterprise Value(1)
Ba2/BB Corporate Rating
Antero Midstream
Partners LP (NYSE: AM)
$4.1 Billion Valuation(1)
67% Limited
Partner Interest
E&P Assets
Gathering/Compression
Assets
MIDSTREAM – MLP (NYSE: AM) HIGHLIGHTS
SUBSTANTIAL VALUE IN MIDSTREAM BUSINESS
1. AR enterprise value excludes AM minority interest and cash. Market values as of 10/23/2015; balance sheet data as of 9/30/2015.
2. Based on 277.0 million AR shares outstanding and 175.8 million AM units outstanding. 11
Corporate Structure Overview(1)
Market Valuation of AR Ownership in AM:
• AR ownership: 67% LP Interest = 116.9 million units
AM Price
per Unit
AM Units
Owned
by AR
(MM)
AR Value in
AM LP Units
($MMs)
Value Per
AR Share(2)
$19 117 $2,221 $8
$20 117 $2,338 $8
$21 117 $2,455 $9
$22 117 $2,572 $9
$23 117 $2,689 $10
$24 117 $2,806 $10
Water Infrastructure
Assets
= $2.7 Billion Market Valuation(1)
MLP Benefits:
- Funding vehicle to expand midstream business
- Highlights value of Antero Midstream
- Liquid asset for Antero Resources
TAKEAWAY – LARGEST FIRM TRANSPORTATION AND
PROCESSING PORTFOLIO IN APPALACHIA
Antero Long Term Firm Processing & Takeaway Position (YE 2018) – Accessing Favorable Markets
Mariner East 2
62 MBbl/d Commitment
Marcus Hook Export
Shell
20 MBbl/d Commitment
Beaver County Cracker
(Pending FID YE‘15)
Sabine Pass (Trains 1-4)
50 MMcf/d per Train
Freeport LNG
70 MMcf/d
1. November 2015 and full year 2016 futures basis, respectively, provided by Wells Fargo dated 9/30/2015. Favorable markets shaded in green.
Chicago(1)
$.22 /
$0.04
CGTLA(1)
$(0.09) /
$(0.08)
Dom South(1)
$(1.55) /
$(1.05)
TCO(1)
$(0.18) /
$(0.22)
12
Cove Point
4.85 Bcf/d
Firm Gas
Takeaway
By YE 2018
 4.85 Bcf/d natural gas FT portfolio by YE 2018 with 85% serving favorable markets and an average demand fee of $0.40/MMBtu
YE 2018 Gas Market Mix
AR 4.85 Bcf/d FT
43%
Gulf Coast
16%
Midwest
13%
Atlantic
Seaboard
12%
Dom S/TETCO
(PA)
15%
TCO
13
HEDGING – INTEGRAL TO BUSINESS MODEL
1. 4Q 2015 – 4Q 2021 hedge gains based on current mark-to-market hedge gains.
2. Based on NYMEX strip as of 9/30/2015.
 Hedging is a key component of Antero’s business model which includes development of a large, repeatable drilling inventory
– Locks in higher returns in a low commodity price environment and reduces well payout thereby enhancing liquidity
 Antero has realized $1.5 billion of gains on commodity hedges since 2009
– Gains realized in 26 of last 27 quarters, or 96% of the quarters since 2009
● Based on Antero’s hedge position and strip pricing as of 9/30/2015(2), a further $2.8 billion in hedge gains are projected to be
realized through the end of 2021
● Significant additional hedge capacity remains under the credit facility hedging covenant for 2017 – 2021 period
Quarterly Realized Hedge Gains / (Losses)(1)
Realized Hedge Gains
Projected Hedge Gains(2)
NYMEX Natural Gas
Historical Spot Prices
($/Mcf)
NYMEX Natural Gas
Futures Prices(2)
3.1 Tcfe Hedged at
average price of
$3.93/Mcfe
through 2021
$2.8 Billion in
Projected Hedge
Gains Through
2021(1)
Average Hedge Prices
($/Mcfe)
$3.67
Realized $1.5 Billion
in Hedge Gains
Since 2009
$0.00
$1.00
$2.00
$3.00
$4.00
$5.00
$6.00
$0
$50
$100
$150
$200
$250
$MM
$4.51
$3.94
$3.83
$4.06
$3.94
$3.75
Liquid non-E&P assets of $5.5 Bn
significantly exceeds total debt of $3.9 Bn
Liquidity
LIQUIDITY – STRONG BALANCE SHEET AND FLEXIBILITY
Antero Resources (NYSE:AR) Antero Midstream (NYSE:AM)
9/30/2015 Debt Liquid Non-E&P Assets 9/30/2015 Debt Liquid Assets
Debt Type $MM
Credit facility $500
6.00% senior notes due 2020 525
5.375% senior notes due 2021 1,000
5.125% senior notes due 2022 1,100
5.625% senior notes due 2023 750
Total $3,875
Asset Type $MM
Commodity derivatives(1) $2,842
AM equity ownership(2) 2,694
Cash 10
Total $5,546
Asset Type $MM
Cash $10
Credit facility – commitments(3) 4,000
Credit facility – drawn (500)
Credit facility – letters of credit (535)
Total $2,975
Debt Type $MM
Credit facility $525
Total $525
Asset Type $MM
Cash $18
Total $18
Liquidity
Asset Type $MM
Cash $18
Credit facility – capacity(4) 1,500
Credit facility – drawn (525)
Credit facility – letters of credit -
Total $993
Approximately $3.0 billion of liquidity at AR
plus an additional $2.7 billion of liquid AM units
Approximately $1 billion of liquidity
at AM
14
Only 35% of AM credit facility capacity drawn
Note: All balance sheet data as of 9/30/2015, inclusive of water drop down and associated financing.
1. Mark-to-market as of 9/30/2015.
2. Based on AR ownership of AM units (116.9 million common and subordinated units) and AM’s closing price as of 10/23/2015.
3. AR credit facility commitments of $4.0 billion, borrowing base of $4.5 billion.
4. Credit facility increased to $1.5 billion upon water drop down – 3 new banks added to existing bank group of 17 banks.
$3.99
$2.63 $2.46
$2.21
$2.02
$0.00
$0.50
$1.00
$1.50
$2.00
$2.50
$3.00
$3.50
$4.00
$4.50
AR Peer 1 Peer 2 Peer 3 Peer 4
$1.97
$1.30 $1.18
$1.17 $0.66
$0.58
$0.85
$0.72
$0.88
$0.75
$3.86
$2.33 $2.34
$2.55
$2.35
$0.00
$0.50
$1.00
$1.50
$2.00
$2.50
$3.00
$3.50
$4.00
$4.50
AR Peer 1 Peer 2 Peer 3 Peer 4
$/Mcfe
Noncontrolling Interest of Midstream MLP EBITDA LOE
Production Taxes GPT
G&A EBITDAX
4-year Avg. All-in F&D
Region
3Q 2015
% Sales
Average
NYMEX Price
Average
Differential(2)
Average
BTU Upgrade
Hedge
Effect
Average 3Q 2015
Realized Gas Price(3)
NYMEX
Premium/
Discount
TCO 41% $2.77 $(0.30) $0.22 $0.14 $2.83 $0.06
Dom South/TETCO 32% $2.77 $(1.63) $0.10 $0.77 $2.01 $(0.76)
Gulf Coast(1) 7% $2.77 $(0.27) $0.22 $0.68 $3.40 $0.63
Chicago/Michigan 20% $2.77 $0.20 $0.18 $0.04 $3.19 $0.42
Total Wtd. Avg. 100% $2.77 $(0.62) $0.17 $1.67 $3.99 $1.22
1. Gulf Coast differential includes contractual deduct to NYMEX-based sales.
2. Includes firm sales.
3. Includes natural gas hedges.
4. Source: Public data from 3Q 2015 10-Qs. Peers include Cabot Oil & Gas, CONSOL Energy, EQT Corp. and Southwestern.
5. Includes realized hedge gains and losses. Operating costs include lease operating expenses, production taxes, gathering, processing and firm transport costs and general and administrative costs. 4-year proved
reserve average all-in F&D from 2011-2014. Calculation = (Development costs + exploration costs + leasehold costs) / Total reserves added (2014 ending reserves – 2011 beginning reserves + 4-year reserve
sales – 4-year reserve purchases + 4-year accumulated production). AR price realization includes $0.03 of midstream revenues; EBITDAX excludes AR’s midstream EBITDA not attributable to AR’s ownership.
15
REALIZATIONS – A LEADER IN REALIZATIONS & MARGINS
AMONG LARGE-CAP APPALACHIAN PEERS
3Q 2015 Natural Gas Realizations(3)(4) 3Q 2015 Price Realization & EBITDAX Margin vs F&D(4)(5)
($/Mcfe)
 Antero continues to be a leader in its peer group in price realizations and EBITDAX unit margins
3Q 2015 Natural Gas Realizations ($/Mcf)
3Q 2015 NYMEX
= $2.77/Mcf
DOM S
22%
DOM S - 9% DOM S - 6%
TETCO M2 - 7%
TETCO M2 - 6%
TCO
24%
TCO
16%
TCO - 9%
NYMEX
8%
NYMEX
11%
NYMEX
10%
Gulf Coast
18%
Gulf Coast
38%
Gulf Coast
56%
Chicago
21%
Chicago
20%
Chicago
19%
0%
10%
20%
30%
40%
50%
60%
70%
80%
90%
100%
($/Mcf) 2015E
NYMEX Strip Price(1) $3.09
Basis Differential to NYMEX(1) $(0.46)
BTU Upgrade(5) $0.26
Estimated Realized Hedge Gains $1.35
Realized Gas Price with Hedges $4.24
Premium to NYMEX +$1.15
Liquids Impact +$0.39
Premium to NYMEX w/ Liquids +$1.54
Realized Gas-Equivalent Price $4.63
REALIZATIONS – REALIZED PRICE “ROAD MAP”
Note: Hedge volumes as of 9/30/2015.
1. Based on 12/31/2014 strip pricing.
2. Differential represents contractual deduct to NYMEX-based firm sales contract.
3. Represents 120,000 MMBtu/d of TCO index hedges and 390,000 MMBtu/d of TCO basis
hedges that are matched with NYMEX hedges for presentation purposes.
4. Represents 60,000 MMBtu/d of TCO index hedges and 130,000 MMBtu/d of TCO basis
hedges that are matched with NYMEX hedges for presentation purposes.
5. Assumes ethane rejection resulting in 1100 BTU residue sales gas.
2015
Basis(1)
2016
Basis(1)
2017
Basis(1)
2015
Hedges
2016
Hedges
2017
Hedges
Marketed%ofTargetResidueGasProduction
+$0.05/MMBtu
$(0.25)/MMBtu(2)
$(1.28)/MMBtu
$(0.24)/MMBtu
$(0.07)/MMBtu
$(0.25)/MMBtu(2)
$(1.11)/MMBtu
$(0.41)/MMBtu
$(0.20)/MMBtu
$(0.25)/MMBtu(2)
$(0.83)/MMBtu
$(0.50)/MMBtu
$(0.09)/MMBtu
$(0.07)/MMBtu
1,000,000 MMBtu/d
@ $3.58/MMBtu
40,000 MMBtu/d
@ $4.00/MMBtu
230,000 MMBtu/d
@ $5.74/MMBtu
510,000 MMBtu/d
@ $3.87/MMBtu(3)
170,000 MMBtu/d
@ $4.09/MMBtu
272,500 MMBtu/d
@ $5.35/MMBtu
190,000 MMBtu/d
@ $3.66/MMBtu(4)
85% exposure to favorable price indices71% exposure to favorable price indices 94% exposure to favorable price indices
 Antero’s exposure to favorable gas price indices like Chicago, Gulf Coast, NYMEX and TCO is expected to increase to 94% by 2017
 Driven by expected in-service dates of regional gathering (4Q 2015) and Rover pipeline (1Q 2017)
$(1.35)/MMBtu
$(1.26)/MMBtu
Wtd. Avg.
Basis ($0.46)
Wtd. Avg.
Basis $(0.32)
1,160,000 MMBtu/d
@ $4.34/MMBtu
Wtd. Avg.
Basis $(0.18)
1,612,500 MMBtu/d
@ $3.92/MMBtu
420,000 MMBtu/d
@ $4.27/MMBtu
2015E 2016E 2017E
16
380,000 MMBtu/d
@ $3.88/MMBtu
980,000 MMBtu/d
@ $3.49/MMBtu
70,000 MMBtu/d
@ $4.57/MMBtu
1,490,000 MMBtu/d
@ $3.82/MMBtu
$(0.10)/MMBtu
$52.07
$54.25 $52.61 $53.71 $46.23 $51.98
$16.10
$24.71
$94.10 $98.01
$93.03
$49.48
$0
$20
$40
$60
$80
$100
$120
AR NGL
Pricing
Mont
Belvieu
AR NGL
Pricing
Mont
Belvieu
AR NGL
Pricing
Mont
Belvieu
AR NGL
Pricing
Mont
Belvieu
2012 2013 2014 2015E
Realized NGL C3+ Price
$0.63
$0.59
$0.47 $0.53
$0.10
$0.20
$0.30
$0.40
$0.50
$0.60
$0.70
0
5,000
10,000
15,000
20,000
25,000
30,000
4Q 2015 2016
Hedged Volume Average Hedge Price
Strip (9/30/2015)
REALIZATIONS – NGL REALIZATIONS AND PROPANE HEDGES
171. Based on 2015 NGL and WTI strip prices as of 9/30/2015, net of local transportation.
2. In ethane rejection, a minimal amount of ethane is produced and sold as propane.
3. 2015 NGL% of WTI of 33% represents midpoint of updated 2015 guidance.
4. As of 9/30/2015. Mark-to-market value for 2015 reflects 6 months of hedges from July through December.
Realized NGL Prices as % of WTI(1) 2015E NGL Price Road Map(1)
0%
20%
40%
60%
80%
100%
2015E
(% of Antero NGL Bbl)
57% Propane
11% Iso-Butane
15% Normal
Butane
16% Natural
Gasoline
1% Ethane
55% 54%
50%
33%
($/Bbl)
≈ 70% of 2015 NGL 
Guidance Hedged
NGL Marketing Propane Hedges
Mark-to-Market Value(4)
(Bbl/d) ($/Gal)
 Realized NGL (C3+) price was 50% of WTI in 2014 and
Antero is forecasting 30% to 35% of WTI for 2015
− YTD 2015 NGL realizations were 34% of WTI
− Including propane hedges, first nine months of 2015
realizations were 40% of WTI
 MarkWest is managing NGL volume growth in the
northeast by moving 57% of the volumes out of the region,
mostly by rail
 Antero has hedged significant propane volumes in 2015
and 2016
 By year-end 2016, Antero will market a significant portion
of its NGL volumes out of Marcus Hook to export markets
once Mariner East 2 is in service
– 61,500 Bbl/d firm commitment with expansion rights
$54 MM$15 MM
(3)
Wtd. Avg.
Mont Belvieu NGL Strip (1)
% of C3+ Price Per
($/gal) ($/Bbl) Barrel Barrel
Ethane (2)
$0.31 $12.86 1% $0.09
Propane $0.31 $12.86 57% $7.33
Iso-Butane $0.41 $17.33 11% $1.87
Normal Butane $0.41 $17.33 15% $2.60
Natural Gasoline $0.63 $26.41 16% $4.21
Wtd. Average NGL Barrel: $16.10
2015 WTI Strip (1)
: $49.48
NGL Barrel as %of WTI: 33%
(3)
NORTHEAST NGLS ARE TRANSPORTATION CHALLENGED
1. As an anchor shipper on Mariner East 2, Antero has the right to expand its NGL commitment with notice to operator.
2. 2015 NGL production assumes ethane rejection.
Mariner East 2
61,500 Bbl/d AR
Commitment(1)
4Q 2016 In-Service
 Not so much a supply problem but more of a logistics problem for NGLs in the northeast today
− The majority of northeast NGL production is being transported by expensive rail and trucking
− NGLs that are transported “to the water” are also faced with high shipping rates
Export
15%
Gulf
Coast
13%
Mid-
Atlantic
6%
Sarnia
3%
Northeast
43%
Midwest
10%
Edmonton
10%
2015 NGL Marketing by Region
18
NORTHEAST NGL GROWTH IS SUPPORTED BY
INCREASING TAKEAWAY OPTIONS
1. Chart 10 per BAML research dated 6/5/2015. Pipeline volumes are capacity estimates.
Industry NGL Pipelines – Actual (2015) and Projected(1)
19
Shell
Beaver County Cracker
(Pending FID YE’15)
Mariner East 2
62 MBbl/d Commitment
Marcus Hook Export
AR Has Doubling Rights
Gulf Coast
Critical to
NGL Pricing
Appalachia
 NGL transportation rates are expected to decline $0.12 to $0.15 per gallon by 2017 as pipeline options to domestic markets and
export terminals go in-service (Mariner East 1 and 2, for example)
(MMBbl/d)
$0.00
$0.10
$0.20
$0.30
$0.40
$0.50
$/Gallon
Baltic Exchange LPG Freight Futures
Baltic LPG Rate ($/gal) Marcus Hook to Europe ($/gal)
Marcus Hook to Far East ($/gal)
U.S. EXPORTS ARE SUPPORTED BY EXCESS
DOCK CAPACITY AND FLEET GROWTH
0
200
400
600
800
1,000
1,200
1,400
1,600
1,800
2009 2010 2011 2012 2013 2014 2015 2016 2017 2018 2019 2020 2021 2022 2023 2024 2025
MBbl/d
Butane Exports Propane Exports Total Export Capacity
Excess LPG Export Terminal Capacity vs. Expected Export Volumes(1)
Excess dock capacity supports
growing LPG export volumes
through 2025
Fleet Growth Supports U.S. LPG Export Growth(2) LPG Freight Futures Show Declining Freight Costs(3)
Baltic LPG shipping cost declines from
$0.14/gal to $0.09-$0.10/gal in early 2017
on fleet supply growth numbers
Projected growth in VLGC
fleet supports increasing
LPG export volumes and
lower shipping costs
1. Source: Bentek.
2. Source: Poten & Partners, August 2015.
3. Baltic Rate based on 9/30/2015 Baltic Futures converted to cost per gallon of LPGs, assuming 75/25 propane/butane.
 LPG transportation rates from northeast fractionation to Europe and Asia should improve by $0.05 to $0.15 per gallon by YE 2016,
driven both by pipelines replacing rail and by lower shipping costs
Excess Dock Capacity
Current Fleet 168
New builds +85
20
POSITIVE OUTLOOK FOR LONG-TERM NGL MARKETS
Steady Global LPG Demand Growth Through 2035(1)
1. Source: PIRA NGL Study, September 2015.
2. Source: IHS, Waterborne, SK Gas Analysis; Wood Mackenzie; Wood Mackenzie; PDH C3 capacity based on 25 MBbl/d = 650 Mt/y.
Multiple Factors Driving Global LPG Demand Growth Through 2020(2)
MMBbl/d
0.0
0.33
0.67
 Forecast global LPG demand growth of 800 MBbl/d to 1 MMBbl/d by 2020 to be driven by petrochem projects in Asia and Middle East as well as
residential/commercial, alkylate and power generation demand
− Naphtha cracker conversion to LPG another potential demand driver that has not yet been factored into analyst estimates ≈1 MMBbl/d
China Korea
Haiwei (2016)
- 21 MBbl/d C3
SK Advanced (2016)
- 27 MBbl/d C3
Ningbo Fuji (2016)
- 29 MBbl/d C3
Fujian Meide (2016)
- 29 MBbl/d C3
Tianjin Bohua 2 (2018)
- 29 MBbl/d C3 United States
Fujian Meide 2 (2018)
- 29 MBbl/d C3
Enterprise (3Q 2016)
- 29 MBbl/d C3
Oriental Tangshan (2019)
- 25 MBbl/d C3
Formosa (2017)
- 25 MBbl/d C3
Firm and Likely PDH Underway
(By 2020)
Total - 243 MBbl/d C3
Million Tons, Global PDH Capacity
1990 2000 2010 2020
20
10
0
21
14.7
13.0
11.4
9.8
8.2
6.5
4.9
3.3
1.7
U.S. Driven Global LPG Supply Through 2035(1)
MMBbl/d MMBbl/d
1.3
1.0
0.7
0.3
-0.3
Downstream LNG
and NGL Sales
Production and
Cash Flow Growth
22
Antero recently drilled and cased its first Utica dry gas well; has 186,000
net acres in WV and PA prospective for Utica dry gas – adjacent to
current industry activity with highly encouraging initial results
CATALYSTS
40%+ production growth guidance for 2015 with 94% hedged at
$4.51/MMBtu; targeting 25% to 30% production growth in 2016 with 98%
to 102% hedged at $3.94/MMBtu; capital budget flexibility to commodity
price changes
Large, low unit cost core Marcellus and Utica natural gas drilling
inventory with associated liquids generates attractive returns supported
by long-term natural gas hedges, takeaway portfolio and downstream
LNG and NGL sales agreements
Pursuing additional value enhancing long-term LNG and NGL sales
agreements, as well as additional NGL firm takeaway
Antero owns 67% of Antero Midstream Partners and thereby participates
directly in its growth and value creation; acquisition of integrated water
business from Antero expected to result in distributable cash flow per
unit accretion in 2016
Midstream MLP
Growth
Sustainability of
Antero’s Integrated
Business Model
1
2
3
5
4
Utica Dry Gas
Activity
-
100
200
300
400
500
600 Core Net Acres - Dry Core Net Acres - Liquids-Rich
Largest Liquids-Rich
Core Position in
Appalachia
0
2,000
4,000
6,000
8,000
10,000
12,000
14,000
Largest Proved
Reserve Base
in Appalachia
LEADERSHIP IN APPALACHIAN BASIN
Top Producers in Appalachia (Net MMcfe/d) – 2Q 2015(1)(2) Top 12 U.S. Natural Gas Producers (Net MMcf/d) – 2Q 2015(1)
Appalachian Producers by Proved Reserves (Bcfe) – YE 2014(1)(2)Appalachian Producers by Core Net Acres (000’s) – August 2015(3)(4)
1. Based on company filings and presentations.
2. Appalachian only production and reserves where available. Excludes companies that do not break out Appalachian production including CHK, CVX, HES and XOM.
3. Based on Antero geologic interpretation supported by state well data, company presentations and public land data. Peer group includes AEP, CHK, CNX, COG, CVX, EQT, NBL, RICE, RRC, STO, SWN.
4. Southwestern leasehold and reserves include the impact from STO and WPX property acquisitions closed in January 2015.
5. Includes proved reserves categorized in “Northern Division” consisting of Utica Shale, Marcellus Shale and Powder River Basin.
0
200
400
600
800
1,000
1,200
1,400
1,600
1,800
0
500
1,000
1,500
2,000
2,500
3,000
3,500
Appalachian Peers
11th Largest
U.S. Gas
Producer
23
3rd Largest
Appalachian
Producer
 Antero has the largest proved reserve base, the largest core liquids-rich acreage position and is one of the largest producers in the Appalachian Basin
ASSET OVERVIEW
24
248
139
94
254
289
15%
38%
47%
35%
40%
11%
29%
38%
28%
32%
0
100
200
300
0%
15%
30%
45%
60%
Condensate Highly-Rich
Gas/
Condensate
Highly-Rich
Gas
Rich Gas Dry Gas
Total3PLocations
ROR
Total 3P Locations ROR @ 6/30/2015 Strip-Spot ROR @ 6/30/2015 Strip-Current
664
1,010
628
889
45%
31%
14% 16%
38%
26%
10%
13%
0
500
1,000
1,500
0%
15%
30%
45%
60%
Highly-Rich
Gas/
Condensate
Highly-Rich
Gas
Rich Gas Dry Gas
Total3PLocations
ROR
Total 3P Locations ROR @ 6/30/2015 Strip-Spot ROR @ 6/30/2015 Strip-Current
MARCELLUS WELL ECONOMICS(1)
WELL COST REDUCTIONS SUPPORT
SUSTAINABLE BUSINESS MODEL
Marcellus Well Cost Improvement(2)
1. 6/30/2015 pre-tax well economics based on a 9,000’ lateral, 6/30/2015 natural gas and WTI strip pricing for 2015-2024, flat thereafter, NGLs at 32.5% of WTI for 2015–2016 and 50% of WTI thereafter,
and applicable firm transportation and operating costs . Well cost estimates include $1.2 million assumed for road, pad and production facilities. Current well costs include legacy contracts. Spot well
costs are adjusted for current market drilling and completion rates resulting in a $1.2 million cost saving vs. current well costs. Antero will begin to realize spot well costs as the company utilizes
incremental completion crews for deferred completions beginning at year end 2015 and as existing drilling rig contracts begin to roll off during 2016.
2. 2015E well costs based on $10.3 million for a 9,000’ lateral Marcellus well and $11.6 million for a 9,000’ lateral Utica well.
25
UTICA WELL ECONOMICS(1)
 72% of Marcellus locations are processable (1100-plus Btu)  72% of Utica locations are processable (1100-plus Btu)
2015
Drilling
Plan
 Antero has reduced average well costs for a 9,000’ lateral by 16% in the Marcellus and 18% in the Utica as compared to 2014 well costs,
through a combination of service cost reductions and drilling and completion efficiencies
− Well economics on some wells expected to improve further starting in early 2016 as the Company utilizes incremental market based
contracts for drilling and completion operations which is expected to reduce well costs by another 10 to 12% over time
Utica Well Cost Improvement(2)
$1.357
$1.144
$0.000
$0.500
$1.000
$1.500
$2.000
2014 2015E
$MM/1,000’Lateral
Well Cost ($MM/1,000')
16%
Decrease
vs. 2014 $1.571
$1.289
$0.000
$0.500
$1.000
$1.500
$2.000
2014 2015E
$MM/1,000’Lateral
Well Cost ($MM/1,000')
18%
Decrease
vs. 2014
WORLD CLASS MARCELLUS SHALE
DEVELOPMENT PROJECT
100% operated
Operating 6 drilling rigs including
1 intermediate rigs
418,000 net acres in
Southwestern Core (74%
includes processable rich gas
assuming an 1100 Btu cutoff)
– 52% HBP with additional 24%
not expiring for 5+ years
419 horizontal wells completed
and online
– Laterals average 7,500’
– 100% drilling success rate
6 plants in-service at Sherwood
Processing Complex capable of
processing in excess of 1.2 Bcf/d
of rich gas
− Over 900 MMcf/d of Antero gas
being processed currently
Net production of 1,140 MMcfe/d
in 3Q 2015, including 33,000
Bbl/d of liquids
3,191 future drilling locations in
the Marcellus (2,302 or 72% are
processable rich gas)
28.4 Tcfe of net 3P (17% liquids),
includes 11.9 Tcfe of proved
reserves (assuming ethane
rejection)
Highly-Rich Gas
137,000 Net Acres
1,010 Gross Locations
Rich Gas
90,000 Net Acres
628 Gross Locations
Dry Gas
107,000 Net Acres
889 Gross Locations
Highly-Rich/Condensate
84,000 Net Acres
664 Gross Locations
HEFLIN UNIT
30-Day Rate
2H: 21.4 MMcfe/d
(20% liquids)
CONSTABLE UNIT
30-Day Rate
1H: 14.3 MMcfe/d
(25% liquids)
142 Horizontals Completed
30-Day Rate
8.1 MMcf/d
6,915’ average lateral length
Sherwood
Processing
Complex
Source: Company presentations and press releases. Antero acreage position reflects tax districts in which greater than 3,000 net acres are held. Note: Rates in ethane rejection.
NERO UNIT
30-Day Rate
1H: 18.2 MMcfe/d
(27% liquids)
BEE LEWIS PAD
30-Day Rate
4-well combined
30-Day Rate of
67 MMcfe/d
(26% liquids)
RJ SMITH PAD
30-Day Rate
4-well combined
30-Day Rate of
56 MMcfe/d
(21% liquids)
26
HENDERSHOT UNIT
30-Day Rate
1H: 16.3 MMcfe/d
2H: 18.1 MMcfe/d
(29% liquids)
HORNET UNIT
30-Day Rate
1H: 21.5 MMcfe/d
2H: 17.2 MMcfe/d
(26% liquids)
CARR UNIT
30-Day Rate
2H: 20.6 MMcfe/d
(20% liquids)
WAGNER PAD
30-Day Rate
4-well combined
30-Day Rate of
59 MMcfe/d
(14% liquids)
Antero’s Marcellus well performance has continued to improve over time with a tight statistical
range of results across its entire acreage position
PROLIFIC PREDICTABLE RESULTS ACROSS ENTIRE
MARCELLUS POSITION
27
Marcellus PDP Locations
(As of 6/30/2015)
(1)
1. Source: IHS; 3rd party producing wells include Consol, EQT, Exxon/XTO, Noble, AEP, PDC, Magnum Hunter, Statoil, Chesapeake / SWN.
>1275 BTU
2.2 Bcfe/1,000’ Lateral
7 SSL Wells
1200-1275 BTU
2.0 Bcfe/1,000’ Lateral
99 SSL Wells
1100-1200 BTU
1.8 Bcfe/1,000’ Lateral
110 SSL Wells
Average Antero Marcellus Well
2014 Actual 2H 2015 Budget
30-Day Rate (MMcfe/d): 13.1 16.1
Gross EUR (Bcfe): 15.3 19.2
Gross Well Cost ($MM): $11.8 $10.3
Lateral Length (Feet): 8,052 9,000
Net F&D ($/Mcfe): $0.89 $0.63
Btu: 1195 1250
0
5
10
15
20
25
30
1.3 1.4 1.5 1.6 1.7 1.8 1.9 2 2.1 2.2 2.3 2.4 2.5 2.6 2.7 More
WellCount
Bcfe/1,000' of Lateral
0
5
10
15
20
25
30
MMcfe/d
 Antero’s Marcellus average 30-day rates have increased by 67% over the past two years as the Company increased per well lateral lengths by
12% and shortened stage lengths by 45% compared to 1H 2013
INCREASING RECOVERIES AND LOW VARIANCE
IN MARCELLUS
1. Processed rates converting C3+ NGLs and condensate at 6:1. Ethane rejected and sold in gas stream.
Antero 30-Day Rates – 415 Marcellus Wells(1)
28
Antero SSL Reserves per 1,000’ of Lateral – 223 Marcellus SSL Wells
2014 – 13.0 MMcfe/d
2013 – 9.4 MMcfe/d
2009–2012 – 8.0 MMcfe/d
 The Marcellus is a reliable, low risk play as demonstrated by the tight distribution of EURs per 1,000’ and the P10/P90 ratio of only 1.7x for 223
SSL wells
P10: 2.35 Bcfe/1,000’
P90: 1.42 Bcfe/1,000’
P10/P90: 1.7x
P90
P10
2015 YTD – 14.4 MMcfe/d
411 420
361
283
200 200
14
16
21
27
40
45
-
5
10
15
20
25
30
35
40
45
50
-
50
100
150
200
250
300
350
400
450
2010 2011 2012 2013 2014 2015E
AverageFracStagesperWell
AverageStageLength(Feet)
Increasing Frac Stages per Well
Average Stage Length (Feet) Average Frac Stages per Well
(1)
1.5
1.6
1.5
1.6
2.0
$0.97
$0.89
$0.98
$1.13
$0.89
$0.00
$0.20
$0.40
$0.60
$0.80
$1.00
$1.20
0.00
0.50
1.00
1.50
2.00
2.50
2010 2011 2012 2013 2014
DevelopmentCost($/Mcfe)
EUR/1,000'Lateral(Bcfe)
EUR vs. Development Cost per Unit
EUR/1,000' Lateral (Bcfe) Development Cost ($/Mcfe) 29
MARCELLUS WELL PERFORMANCE IMPROVEMENTS
 Increasing recoveries and efficiencies, through longer laterals, shorter stage lengths and faster drilling
 SSL completions drove a 21% decline in development costs in 2014 while lower service costs and efficiencies are driving further
development cost reductions in 2015
1. 2015 reflects Antero guidance per 1/20/2015 press release.
5,732
6,717
7,345 7,308
8,052
9,000
19
38
59
103
136
80
0
20
40
60
80
100
120
140
160
0
2,000
4,000
6,000
8,000
10,000
2010 2011 2012 2013 2014 2015E
WellsonFirstSales
LateralLength(Feet)
Increasing Lateral Lengths
Average Lateral Length (Feet) Wells on First Sales
(1)
37 36 34 32 29
13,181 14,067 14,658 14,607
15,355
-
4,000
8,000
12,000
16,000
20,000
0
10
20
30
40
50
2010 2011 2012 2013 2014
TotalMeasuredDepth(Feet)
Spud-to-SpudDays
Increasing Drilling Efficiency
Avg Spud-to-Spud Days Total Measured Depth (Feet)
Note: Antero acreage position reflects townships in which greater than 3,000 net acres are held. Antero 30-day rates in ethane rejection.
1. 30-day rate reflects restricted choke regime.
 100% operated
 Operating 4 drilling rigs
 147,000 net acres in the core rich gas/
condensate window (73% includes processable
rich gas assuming an 1100 Btu cutoff)
– 27% HBP with additional 63% not expiring
for 5+ years
 93 operated horizontal wells completed and
online in Antero core areas
− 100% drilling success rate
 4 plants at Seneca Processing Complex
capable of processing 800 MMcf/d of rich gas
− Over 500 MMcf/d being processed currently,
including third party production
 Net production of 366 MMcfe/d in 3Q 2015
including 19,250 Bbl/d of liquids
 Fifth party compressor station in-service
September 2015 with a capacity of 120 MMcf/d
 1,024 future gross drilling locations (735 or 72%
are processable gas)
 7.6 Tcfe of net 3P (15% liquids), includes
758 Bcfe of proved reserves (assuming ethane
rejection)
WORLD CLASS OHIO UTICA SHALE
DEVELOPMENT PROJECT
30
Cadiz
Processing
Plant
NORMAN UNIT
30-Day Rate
2 wells average
16.8 MMcfe/d
(15% liquids)
RUBEL UNIT
30-Day Rate
3 wells average
17.2 MMcfe/d
(20% liquids)
Utica
Core
Area
GARY UNIT
30-Day Rate
3 wells average
24.2 MMcfe/d
(21% liquids)
Highly-Rich/Cond
28,000 Net Acres
139 Gross Locations
Highly-Rich Gas
12,000 Net Acres
94 Gross Locations
Rich Gas
31,000 Net Acres
254 Gross Locations
Dry Gas
40,000 Net Acres
289 Gross Locations
NEUHART UNIT 3H
30-Day Rate
16.2 MMcfe/d
(57% liquids)
Condensate
36,000 Net Acres
248 Gross Locations
DOLLISON UNIT 1H
30-Day Rate
19.8 MMcfe/d
(40% liquids)
MYRON UNIT 1H
30-Day Rate
26.8 MMcfe/d
(52% liquids)
Seneca
Processing
Complex
LAW UNIT
30-Day Rate
2 wells average
16.1 MMcfe/d
(50% liquids)
SCHAFER UNIT
30-Day Rate(1)
2 wells average
14.2 MMcfe/d
(49% liquids)
URBAN PAD
30-Day Rate
4 wells average
18.8 MMcfe/d
(15% liquids)
GRAVES UNIT
500’ Density Pilot
30-Day Rate
4 wells average
15.5 MMcfe/d
(24% liquids)
FRANKLIN UNIT
30-Day Rate
3 wells average
17.6 MMcfe/d
(16% liquids)
FRAKES UNIT
30-Day Rate
2 wells average
18.6 MMcfe/d
(42% liquids)
1.4 1.6
$1.64
$1.24
$0.00
$0.30
$0.60
$0.90
$1.20
$1.50
$1.80
0.00
0.20
0.40
0.60
0.80
1.00
1.20
1.40
1.60
2013 2014
DevelopmentCost($/Mcfe)
EUR/1,000'Lateral(Bcfe)
EUR vs. Development Cost per Unit
EUR/1,000' Lateral (Bcfe) Development Cost ($/Mcfe)
31
OHIO UTICA WELL PERFORMANCE IMPROVEMENTS
 Increasing recoveries and efficiencies through longer laterals, shorter stage lengths and faster drilling
 Lower service costs and efficiencies, and focus on liquids-rich locations, driving development cost reductions in 2015
1. 2015 reflects Antero guidance per 1/20/2015 press release.
6,431
8,021
9,000
11
41
50
0
10
20
30
40
50
60
0
2,000
4,000
6,000
8,000
10,000
2013 2014 2015E
WellsonFirstSales
LateralLength(Feet)
Increasing Lateral Lengths
Average Lateral Length Wells on First Sales
(1)
289
183 175
26
47
51
-
10
20
30
40
50
60
-
50
100
150
200
250
300
350
2013 2014 2015E
AverageFracStagesperWell
AverageStageLength(Feet)
Increasing Frac Stages per Well
Average Stage Length (Feet) Average Frac Stages per Well
(1)
32
29
14,643
16,321
-
3,000
6,000
9,000
12,000
15,000
18,000
0
10
20
30
40
2013 2014
TotalMeasuredDepth(Feet)
Spud-to-SpudDays
Increasing Drilling Efficiency
Spud-to-Spud Days Total Measured Depth (Feet)
LARGE UTICA SHALE DRY GAS POSITION
32
 Antero has the right to build gathering and compression
infrastructure to move Antero’s future dry gas Utica
production
− AM pro forma water business would also serve Antero’s
dry gas Utica development
 Antero spud its first dry gas Utica well in 3Q 2015
 Antero has 226,000 net acres of exposure to Utica dry gas
play
 Other operators have reported strong Utica Shale dry gas
results including the following wells:
Chesapeake
Hubbard BRK #3H
3,550’ Lateral
IP 11.1 MMcf/d
Hess
Porterfield 1H-17
5,000’ Lateral
IP 17.2 MMcf/d
Gulfport
Irons #1-4H
5,714’ Lateral
IP 30.3 MMcf/d
Eclipse
Tippens #6H
5,858’ Lateral
IP 23.2 MMcf/d
Magnum Hunter
Stalder #3UH
5,050’ Lateral
IP 32.5 MMcf/d
Antero
Utica Well
Drilling
Well Operator
24-hr IP
(MMcf/d)
Lateral
Length
(Ft)
IP/1,000’
Lateral
(MMcf/d)
Scotts Run EQT 72.9 3,221 22.633
Gaut 4IH CNX 61.0 5,840 11.131
CSC #11H RRC 59.0 5,420 10.886
Stewart-Win 1300U MHR 46.5 5,289 8.792
Bigfoot 9H RICE 41.7 6,957 5.994
Blank U-7H GST 36.8 6,617 5.561
Stalder #3UH MHR 32.5 5,050 6.436
Irons #1-4H GPOR 30.3 5,714 5.303
Pribble 6HU SGY 30.0 3,605 8.322
Simms U-5H GST 29.4 4,447 6.611
Conner 6H CVX 25.0 6,451 3.875
Messenger 3H SWN 25.0 5,889 4.245
Tippens #6H ECR 23.2 5,858 3.960
Porterfield 1H-17 HESS 17.2 5,000 3.440
1. Antero acreage position reflects tax districts in which greater than 3,000 net acres are held in OH, WV and PA.
Magnum Hunter
Stewart Winland 1300U
5,289’ Lateral
IP 46.5 MMcf/d
Range
Claysville SC #11H
5,420’ Lateral
IP 59.0 MMcf/d
Chevron
Conner 6H
6,451’ Lateral
IP 25.0 MMcf/d
Gastar
Simms U-5H
4,447’ Lateral
IP 29.4 MMcf/d
Utica Shale Dry Gas Acreage in OH/WV/PA(1)
Rice
Bigfoot 9H
6,957’ Lateral
IP 41.7 MMcf/d
AR Utica Shale Dry Gas
WV/PA
Net Resource
12.5 to 16 Tcf
1,889 Gross Locations
186,000 Net Acres
AR Utica Shale Dry Gas
Ohio
3P Reserves
2.4 Tcf
289 Gross Locations
40,000 Net Acres
AR Utica Shale Dry Gas
Total OH/WV/PA
Net Resource
14.9 to 18.4 Tcf
2,178 Gross Locations
226,000 Net Acres
Stone Energy
Pribble 6HU
3,605’ Lateral
IP 30.0 MMcf/d
Southwestern
Messenger 3H
5,889’ Lateral
IP 25.0 MMcf/d
Rice
Blue Thunder
10H, 12H
≈9,000’ Lateral
Gastar
Blake U-7H
6,617’ Lateral
IP 36.8 MMcf/d
EQT
Scotts Run
3,221’ Lateral
IP 72.9 MMcf/d
CNX
Gaut 4IH
5,840’ Lateral
IP 61.0 MMcf/d
ANTERO’S FIRST UTICA DRY GAS WELL
33
 Dry gas fairway extends from the Antero Utica acreage in eastern
Ohio to the Antero Marcellus play acreage in northern West
Virginia
 186,000 net acres in West Virginia and Pennsylvania with net
resource of 12.5 to 16 Tcf as of 9/30/2015 (not included in 40.7
Tcfe of net 3P reserves)
− 1,889 locations underlying current Marcellus Shale leasehold in
West Virginia and Pennsylvania
 Antero recently drilled and cased its first dry gas Utica well in Tyler
County, WV with results expected in 4Q 2015 (Rymer 4HD)
− 6,400’ planned lateral length
− 100% working interest
 40,000 net acres in Ohio with net 3P reserves of 2.4 Tcf as of
12/31/2014
− 289 locations in Ohio
 In total, Antero has 226,000 net acres and 2,178 potential
locations in the Point Pleasant high pressure, high porosity dry gas
fairway in OH, WV and PA
− 10,000’ to 14,500’ TVD
− Density log porosity values average > 8.5%
− 120’ to 130’ total thickness
− 25 MMcf/d to 73 MMcf/d industry 24-hr IP flow rates
− 1000 to 1040 BTU expected
NOTE: Wellbore diagram for illustrative purposes only.
Targeted Pay Zone
IP / 1,000’ Lateral (MMcf/d)
5.0 – 10.0
10.0 – 15.0
15.0 – 25.0
Gulfport
Irons #1-4H
5,714’ Lateral
IP/1,000’: 5.3 MMcf/d
Range
Claysville SC #11H
5,420’ Lateral
IP/1,000’: 10.9 MMcf/d
CNX
Gaut 4IH
5,840’ Lateral
IP/1,000’: 10.4 MMcf/d
EQT
Scotts Run
3,221’ Lateral
IP/1,000’: 22.6 MMcf/d
Gastar
Blake U-7H
6,617’ Lateral
IP/1,000’: 5.6 MMcf/d
Gastar
Sims U-5H
4,447’ Lateral
IP/1,000’: 6.6 MMcf/d
Stone Energy
Pribble 6HU
3,605’ Lateral
IP/1,000’: 8.3 MMcf/d
Magnum Hunter
Stalder #3UH
5,050’ Lateral
IP/1,000’: 6.4 MMcf/d
Magnum Hunter
Stewart Winland 1300U
5,280’ Lateral
IP/1,000’: 8.8 MMcf/d
Antero
Utica Well Drilling
Rymer 4HD
Utica Dry Gas Fairway
-
500,000
1,000,000
1,500,000
2,000,000
2,500,000
3,000,000
3,500,000
4,000,000
4,500,000
5,000,000
FIRM TRANSPORTATION AND FIRM SALES PORTFOLIO
34
MMBtu/d
Columbia
7/26/2009 – 9/30/2025
Firm Sales #1
10/1/2011– 10/31/2019
Firm Sales #2
10/1/2011 – 5/31/2017
Firm Sales #3
1/1/2013 – 5/31/2022
Momentum III
9/1/2012 – 12/31/2023
EQT
8/1/2012 – 6/30/2025
REX/MGT/ANR
7/1/2014 – 12/31/2034
Tennessee
11/1/2015– 9/30/2030
(WGL) Mid-Atlantic/NYMEX
(Tennessee) Gulf Coast
(TCO) Appalachia or Gulf Coast
Appalachia
Appalachia
ANR
3/1/2015– 2/28/2045
(REX/ANR/NGPL/MGT) Midwest
Local Distribution
11/1/2015 – 9/30/2037
(ANR) Gulf Coast
Antero Transportation Portfolio
1,280 BBtu/d
790 BBtu/d
375 BBtu/d
250 BBtu/d
800 BBtu/d
600 BBtu/d
630 BBtu/d
40 BBtu/d
80 BBtu/d
Keys to Execution
Local Presence
 Antero has more than 3,500 employees and contract personnel working full-time
for Antero in West Virginia. 79% of these personnel are West Virginia residents.
 District office in Marietta, OH
 District office in Bridgeport, WV
 237 (49%) of Antero’s 482 employees are located in West Virginia and Ohio
Safety & Environmental
 Five company safety representatives and 57 safety consultants cover all
material field operations 24/7 including drilling, completion, construction and
pipelining
 37 person environmental staff plus outside consultants monitor all operations
and perform baseline water well testing
Central Fresh Water
System & Water
Recycling
 Numerous sources of water – built central water system to source fresh water
for completions
 Antero recycled over 74% of its flowback and produced water through 2014
 Antero Midstream building 60,000 Bbl/d advanced wastewater treatment facility
(in-service 4Q 2017)
Natural Gas
Vehicles (NGV)
 Antero supported the first natural gas fueling station in West Virginia
 Antero has 30 NGV trucks and plans to continue to convert its truck fleet to NGV
Pad Impact Mitigation
 Closed loop mud system – no mud pits
 Protective liners or mats on all well pads in addition to berms
Natural Gas Powered
Drilling Rigs & Frac
Equipment
 8 of Antero’s contracted drilling rigs are currently running on natural gas
 First natural gas powered clean fleet frac crew began operations summer 2014
Green Completion Units
 All Antero well completions use green completion units for completion flowback,
essentially eliminating methane emissions (full compliance with EPA 2015
requirements)
LEED Gold Headquarters
Building
 Corporate headquarters in Denver, Colorado LEED Gold Certified
HEALTH, SAFETY, ENVIRONMENT & COMMUNITY
Antero Core Values: Protect Our People, Communities And The Environment
Strong West Virginia
Presence
 79% of all Antero Marcellus
employees and contract
workers are West Virginia
residents
 Antero named Business of
the Year for 2013 in
Harrison County, West
Virginia “For outstanding
corporate citizenship and
community involvement”
 Antero representatives
recently participated in a
ribbon cutting with the
Governor of West Virginia
for the grand opening of
the first natural gas fueling
station in the state; Antero
supported the station with
volume commitments for
its NGV truck fleet
35
CLEAN FLEET & CNG TECHNOLOGY LEADER
● Antero has contracted for two clean completion
fleets to enhance the economics of its completion
operations and reduce the environmental impact
● Replaces diesel engines (for pressure pumping)
with electric motors powered by natural gas-fired
electric generators
● A clean fleet allows Antero to fuel part of its
completion operations from field gas instead of
more expensive diesel fuel. Benefits of using a
clean fleet include:
− Reduce fuel costs by up to 80%
representing cost savings of up to
$40,000/day
− Reduces NOx and CO emissions by 99%
− Eliminates 25 diesel truckloads from the
roads for an average well completion
− Reduces silica dust to levels 90% below
OSHA permissible exposure limits resulting
in a safer and cleaner work environment
− Significantly reduces noise pollution from a
well site
− Is the most environmentally responsible
completion solution in the oil and gas
industry
• Additionally, Antero utilizes compressed natural
gas (CNG) to fuel its truck fleet in Appalachia
− Antero supported the first natural gas fueling
station in West Virginia
− Antero has 30 NGV trucks and plans to
continue to convert its truck fleet to NGV
36
37
Antero Midstream (NYSE: AM)
Asset Overview
Regional Gas Pipelines
Miles Capacity In-Service
Regional Gathering
Pipeline(2)
50 1.4 Bcf/d 4Q 2015
381. Acquired by AM from AR for a $1.05 billion upfront payment and a $125 million earn out in each of 2019 and 2020.
2. AM holds option to purchase 15% of regional gathering pipeline at cost plus cost of carry.
End
Users
End
Users
Gas Processing
Y-Grade Pipeline
Long-Haul Interstate
Pipeline
Inter
Connect
NGL Product
Pipelines
Fractionation
Compression
Low Pressure Gathering
Well Pad
Terminals
and
Storage
(Miles) YE 2014 YE 2015E
Marcellus 91 108
Utica 45 56
Total 136 164
AM has option to participate
in processing, fractionation,
terminaling and storage
projects offered to AR
(Miles) YE 2014 YE 2015E
Marcellus 62 76
Utica 35 36
Total 97 112
(MMcf/d) YE 2014 YE 2015E
Marcellus 375 800
Utica 0 120
Total 375 920
AM Owned Assets
Condensate Gathering
Stabilization
(Miles) YE 2014 YE 2015E
Utica 16 19
End
Users
AM Option Assets
(Ethane, Propane,
Butane, etc.)
AM’S FULL VALUE CHAIN BUSINESS MODEL
Water Drop Down
Completed
1. Represents inception to date actuals as of 12/31/2014 and 2015 midpoint guidance.
2. Pro forma for water drop down. Includes $15.0 million of maintenance capex at 2015 midpoint guidance.
39
Utica
Shale
Marcellus
Shale
Projected Midstream Infrastructure(1)
Marcellus
Shale
Utica
Shale Total
YE 2014 Cumulative Gathering/
Compression Capex ($MM) $836 $345 $1,181
Gathering Pipelines
(Miles) 153 80 233
Compression Capacity
(MMcf/d) 375 - 375
Condensate Gathering Pipelines
(Miles) - 16 16
2015E Capex Budget ($MM)(2) $256 $182 $438
Gathering Pipelines
(Miles) 31 12 43
Compression Capacity
(MMcf/d) 425 120 545
Condensate Gathering Pipelines
(Miles) - 3 3
Midstream Assets
ANTERO MIDSTREAM ASSET OVERVIEW
• Gathering and compression assets in core of rapidly
growing Marcellus and Utica Shale plays
– Acreage dedication of ~434,000 net leasehold
acres for gathering and compression services
– Additional stacked pay potential with dedication on
186,000 acres of Utica deep rights underlying the
Marcellus in WV and PA
– 100% fixed fee long term contracts
• AR owns 67% of AM units (NYSE: AM) pro forma
ANTERO INTEGRATED WATER BUSINESS
40
Marcellus Fresh Water System(2)
• Provides fresh water to support Marcellus well completions
• Year-round water supply sources: Ohio River and local rivers
• Ozone Water treatment facility to be in-service by 3Q 2015
• Significant asset growth in 2015 as summarized below:
Note: Antero acreage position reflects tax districts in which greater than 3,000 net acres are owned.
1. Represents inception to date actuals as of 06/30/2015 and 2015 guidance.
2. All Antero water withdrawal sites are fully permitted under long-term state regulatory permits both in WV and OH.
3. Assumes fee of $3.685 per barrel subject to annual inflation and 250,000 barrels of water per well that utilize the fresh water delivery system based on 9,000 foot lateral. Operating margin excludes G&A.
4. Assumes fee of $3.635 per barrel subject to annual inflation and 275,000 barrels of water per well that utilize the fresh water delivery system based on 9,000 foot lateral. Operating margin excludes G&A.
Utica Fresh Water System(2)
• Provides fresh water to support Utica well completions
• Year-round water supply sources: local reservoirs and rivers
• Significant asset growth in 2015 as summarized below:
Marcellus Water System YE 2014 YE 2015E
Water Pipeline (Miles) 177 226
Fresh Water Storage Impoundments 22 24
Cash Operating Margin per Well ($)(3) $700K -
$750K
Utica Water System YE 2014 YE 2015E
Water Pipeline (Miles) 61 90
Fresh Water Storage Impoundments 8 14
Cash Operating Margin per Well ($)(4) $775K -
$825K
Projected Fresh Water Delivery Infrastructure(1)
Marcellus
Shale
Utica
Shale Total
YE 2015E Cumulative
Water System Capex ($MM) $340 $113 $453
Water Pipelines (Miles) 226 90 316
Water Storage Facilities 24 14 38
 AM has acquired AR’s integrated water business for $1.05 billion plus earn out payments of $125 million at year-end in each of 2019 and 2020
− The acquired business includes Antero’s Marcellus and Utica freshwater delivery business, the fully-contracted future advanced wastewater
treatment complex and all fluid handling and disposal services for Antero
Antero advanced wastewater treatment facility
to be constructed – connects to Antero
freshwater delivery system
0
10,000
20,000
30,000
40,000
50,000
60,000
70,000
80,000
Antero Clearwater Advanced Wastewater Treatment Capacity (Bbl/d)
Produced/Flowback Volumes (Bbl/d)
ADVANCED WASTEWATER TREATMENT
Illustrative Produced & Flowback Water VolumesAdvanced Wastewater Treatment
Antero Produced Water Services and Freshwater Delivery Business
Antero Advanced
Wastewater Treatment
3rd Party Recycling
and Well Disposal
(Bbl/d)
Advanced Wastewater Treatment Complex
Estimated capital expenditures ($ million)(1) ~$275
Standalone EBITDA at 100% utilization(2) ~$55 – $65
Implied investment to standalone EBITDA build-out multiple ~4x – 5x
Estimated per well savings to Antero Resources ~$150,000
Estimated in-service date Late 2017
Operating capacity (Bbl/d) 60,000
Operating agreement
•Antero has contracted with Veolia to integrate an advanced wastewater treatment complex into its water business
• Veolia will build and operate, and Antero will own largest
advanced wastewater treatment complex in Appalachia
− Will treat and recycle AR produced and flowback water
− Creates additional year-round water source for completions
− Will have capacity for third party business over first two years
1. Includes capital to construct pipeline to connect facility to freshwater delivery system. Includes $10 million that AR agreed to fund in the drop down transaction.
2. Standalone EBITDA projection assumes inter-company fixed fee for recycling of $4.00 per barrel and 60,000 barrels per day of capacity. Does not include potential sales of marketable byproducts.
20 Years, Extendable
41Integrated Water Business
$1
$5 $7 $8 $11
$19
$28
$36
$41
$55
$0
$10
$20
$30
$40
$50
$60
26 31 40 36 41
116
222
358
454 435
0
100
200
300
400
500
600
700 Marcellus
10 38 80 126
266
531
908
1,134
1,197 1,216
0
200
400
600
800
1,000
1,200
1,400
1,600 Utica Marcellus
108
216
281
331
386
531
738
935 965
1,038
0
200
400
600
800
1,000
1,200
1,400 Utica Marcellus
Low Pressure Gathering (MMcf/d)
Compression (MMcf/d)
High Pressure Gathering (MMcf/d)
EBITDA ($MM)(1)
42
$185
HIGH GROWTH MIDSTREAM THROUGHPUT
1. 2015E EBITDA guidance updated per 10/13/2015 Partnership press release based on 10/1/2015 effective date for water drop down. Y-O-Y growth based on 3Q’14 to 3Q’15.
$175
0.0x
1.0x
2.0x
3.0x
4.0x
5.0x
6.0x
Peer 1 Peer 2 Peer 3 Peer 4 Peer 5 Peer 6 Peer 7 Peer 8
TotalDebt/LQAEBITDA
• $1.5 billion revolver in place to fund future growth capital
(5x Debt/EBITDA Cap)
• Liquidity of $993 million at 9/30/2015
• Sponsor (NYSE: AR) has Ba2/BB corporate ratings
AM Liquidity (9/30/2015)
AM Peer Leverage Comparison(1)
($ in millions)
Revolver Capacity $1,500
Less: Borrowings 525
Plus: Cash 18
Liquidity $993
1. As of 9/30/2015. Peers include TEP, EQM, MWE, WES, RMP, SHLX, DM, and CNNX.
2. AM pro forma for water drop down; LQA EBITDA for water based on 2016E midpoint of 8.5x – 9.0x purchase price multiple announced.
Financial Flexibility
SIGNIFICANT FINANCIAL FLEXIBILITY
43
(2)
44
APPENDIX
44
($ in millions) 9/30/2015
Cash $27
Senior Secured Revolving Credit Facility 500
Midstream Bank Credit Facility 525
6.00% Senior Notes Due 2020 525
5.375% Senior Notes Due 2021 1,000
5.125% Senior Notes Due 2022 1,100
5.625% Senior Notes Due 2023 750
Net Unamortized Premium 7
Total Debt $4,407
Net Debt $4,380
Financial & Operating Statistics
LTM EBITDAX(1)
$1,246
LTM Interest Expense(2) $219
Proved Reserves (Bcfe) (12/31/2014) 12,683
Proved Developed Reserves (Bcfe) (12/31/2014) 3,803
Credit Statistics
Net Debt / LTM EBITDAX 3.5x
Net Debt / Net Book Capitalization 38%
Net Debt / Proved Developed Reserves ($/Mcfe) $1.15
Net Debt / Proved Reserves ($/Mcfe) $0.35
Liquidity
Credit Facility Commitments(3) $5,500
Less: Borrowings (1,025)
Less: Letters of Credit (535)
Plus: Cash 27
Liquidity (Credit Facility + Cash) $3,968
ANTERO CAPITALIZATION – CONSOLIDATED
1. LTM and 9/30/2015 EBITDAX reconciliation provided below.
2. LTM interest expense adjusted for all capital market transactions since 1/1/2014.
3. AR lender commitments under the facility increased to $4.0 billion from $3.0 billion on 2/17/2015; borrowing base capacity increased to $4.5 billion from $4.0 billion on 10/26/2015. AM credit facility
increased to $1.5 billion concurrent with water drop down on 9/23/2015.
45
ANTERO RESOURCES – UPDATED 2015 GUIDANCE
Key Variable 2015 Guidance
Net Daily Production (MMcfe/d) 1,400
Net Residue Natural Gas Production (MMcf/d) 1,175
Net Liquids Production (Bbl/d) 33,000
Net Oil Production (Bbl/d) 4,000
Natural Gas Realized Price Differential to NYMEX Henry Hub Before Hedging ($/Mcf) $(0.20) - $(0.30)
Oil Realized Price Differential to NYMEX WTI Before Hedging ($/Bbl) $(12.00) - $(14.00)
NGL Realized Price (% of WTI) 30% - 35%
Cash Production Expense ($/Mcfe)(1) $1.50 - $1.60
Marketing Expense, Net of Marketing Revenue ($/Mcfe) $0.20 - $0.30
G&A Expense ($/Mcfe) $0.23 - $0.27
Net Income Attributable to Non-Controlling Interest ($MM) $23 - $27
Operated Wells Completed 130
Average Operated Drilling Rigs 14
Capital Expenditures ($MM)
Drilling & Completion $1,600
Water Infrastructure $50
Land $150
Total Capital Expenditures ($MM) $1,800
1. Includes lease operating expenses, gathering, compression and transportation expenses and production taxes. Excludes net marketing expense.
Key Operating & Financial Assumptions
46
ANTERO MIDSTREAM – 2015 GUIDANCE
Key Variable Initial Guidance(1) Updated Guidance(2)
Adjusted EBITDA ($MM) $150 - $160 $180 - $190
Distributable Cash Flow ($MM) $135 - $145 $160 - $170
Year-over-Year Distribution Growth(3) 28% - 30% 28% - 30%
Low Pressure Pipelines Added (Miles) 44 27
High Pressure Pipelines Added (Miles) 20 15
Compression Capacity Added (MMcf/d) 545 545
Capital Expenditures ($MM)
Low Pressure Gathering $165 - $170 $90 - $95
High Pressure Gathering $85 - $90 $70 - $75
Compression $160 - $165 $165 - $170
Condensate Gathering $5 - $10 $5
Water Infrastructure(4) - $80 - $90
Maintenance Capital $10 - $15 $15
Total Capital Expenditures ($MM) $425 - $450 $425 - $450
1. Financial guidance per Partnership press release dated 1/20/2015.
2. Updated financial guidance per Partnership press release dated 10/13/2015.
3. Reflects the expected distribution growth associated with the fourth quarter 2015 over the fourth quarter 2014.
4. Includes fresh water delivery system plus waste water treatment capital expenditures.
Key Operating & Financial Assumptions
47
$2,477
$197
$841
Drilling & Completion Water Infrastructure Land
65%
35%
Marcellus Utica
2015 CAPITAL BUDGET
By Area
48
$3.5 Billion - 2014
By Segment ($MM)
$1,600
$50
$150
Drilling & Completion Water Infrastructure Land
59%41%
Marcellus Utica
By Area
$1.8 Billion – 2015
By Segment ($MM)
 Antero’s 2015 capital budget is $1.8 billion, a 49% decrease from 2014 capital expenditures of $3.5 billion
49%
177 Completions 130 Completions
$0.00
$0.50
$1.00
$1.50
$2.00
$2.50
$3.00
$3.50
$4.00
2015 2015 2016 2016 2017
GasPrice$/MMBtu
Completion Deferral Impact on Realized Gas Price
TETCO CGTLA
TETCO Cal 2015:
$1.88/MMBtu
CGTLA Cal 2016:
$3.27/MMBtu
BTAX IRR:
57%
49
 Plan to defer 50 Marcellus well completions into 2016 to achieve higher gas price realizations
− Regional gathering pipeline expected in-service late 2015 will connect incremental Marcellus production to CGTLA (Gulf
Coast) and TCO pricing
− Results in estimated pre-tax IRR of 57% vs. 39% from 2015 TETCO pricing in first year, excluding sunk drilling costs
COMPLETION DEFERRALS – OPTIMIZING PRICING
0
50
100
150
200
250
300
350
400
450
500
Jan-16 Mar-16 May-16
GrossWellheadProduction(MMcf/d)
Completion Deferral Impact on 2016 Production
Production From
50 Deferred
Completions
+$1.39/MMBtu Pickup
in Price =
18% BTAX IRR Increase
BTAX IRR:
39%
12.7 Tcfe
Proved
21.8 Tcfe
Probable
6.3 Tcfe
Possible
Proved
Probable
Possible
40.7 Tcfe 3P
85% 2P
Reserves
OUTSTANDING RESERVE GROWTH
1. 2012, 2013 and 2014 reserves assuming ethane rejection. 2014 SEC prices were $4.07/MMBtu for natural gas and $81.48/Bbl for oil on a weighted average Appalachian index basis.
50
3P RESERVES BY VOLUME – 2014(1)3P RESERVE GROWTH(1)
25.0 28.4
5.8
7.64.2
4.6
0
5
10
15
20
25
30
35
40
45
2013 2014
(Tcfe)
Marcellus Utica Upper Devonian
Key Drivers
4.2
NET PROVED RESERVES (Tcfe)(1) 2014 RESERVE ADDITIONS
35.0
40.7
• 93,000 net
acres added
in 2014
• SSL results
• Utica results
• 3P reserves increased 16% to 40.7 Tcfe at 12/31/14 with a
PV-10 of $22.8 billion
− Estimated 10% well cost reduction since YE 2014 results
in $2.0 billion increase in 3P PV-10
• All-in finding and development cost of $0.61/Mcfe for 2014
(includes land)
• “Bottoms-up” development cost of $0.98/Mcfe for 2014
• Only 66% of 3P Marcellus locations booked as SSL (1.7
Bcf/1,000’ type curve) at 12/31/2014
• No Utica Shale WV/PA dry gas reserves booked –
estimated net resource of 11.1 Tcf
0.0
2.0
4.0
6.0
8.0
10.0
12.0
14.0
2010 2011 2012 2013 2014
Marcellus Utica
0.7
2.8
4.3
7.6
12.7
(Tcfe)
CONSIDERABLE RESERVE BASE WITH
ETHANE OPTIONALITY
 35 year proved reserve life based on 2014 production annualized
 Reserve base provides significant exposure to liquids-rich projects
– 3P reserves of over 2.5 BBbl of NGLs and condensate in ethane recovery mode; 32% liquids
1. Ethane rejection occurs when ethane is left in the wellhead gas stream as the gas is processed, rather than being separated out and sold as a liquid after fractionation. When ethane is left in the gas
stream, the BTU content of the residue gas at the outlet of the processing plant is higher. Producers will elect to “reject” ethane when the price received for the higher BTU residue gas is greater than the
price received for the ethane being sold as a liquid after fractionation. When ethane is recovered, the BTU content of the residue gas is lower, but a producer is then able to recover the value of the
ethane sold as a separate NGL product.
ETHANE REJECTION(1) ETHANE RECOVERY(1)
51
Marcellus – 28.4 Tcfe
Utica – 7.6 Tcfe
Upper Devonian – 4.6 Tcfe
40.7
Tcfe
Gas – 34.5 Tcf
Oil – 102 MMBbls
NGLs – 924 MMBbls
Marcellus – 33.7 Tcfe
Utica – 8.6 Tcfe
Upper Devonian – 5.1 Tcfe
47.4
Tcfe
Gas – 32.0 Tcf
Oil – 102 MMBbls
NGLs – 2,459 MMBbls
15%
Liquids
32%
Liquids
664
1,010
628
889
45%
31%
14% 16%
38%
26%
10%
13%
0
200
400
600
800
1,000
1,200
0%
15%
30%
45%
60%
Highly-Rich Gas/
Condensate
Highly-Rich Gas Rich Gas Dry Gas
Total3PLocations
ROR
Total 3P Locations ROR @ 6/30/2015 Strip-Spot ROR @ 6/30/2015 Strip-Current
MARCELLUS SINGLE WELL ECONOMICS
– IN ETHANE REJECTION
52
DRY GAS LOCATIONS RICH GAS LOCATIONS
HIGHLY
RICH GAS
LOCATIONS
Assumptions
 Natural Gas – 6/30/2015 strip
 Oil – 6/30/2015 strip
 NGLs – 32.5% of Oil Price 2015-2016;
50% of Oil Price 2017+
NYMEX
($/MMBtu)
WTI
($/Bbl)
C3+ NGL(2)
($/Bbl)
2015 $2.87 $61 $20
2016 $3.14 $62 $20
2017 $3.32 $64 $32
2018 $3.40 $65 $32
2019 $3.47 $66 $33
2020-24 $3.61-$4.09 $66-$69 $34-$35
Marcellus Well Economics and Total Gross Locations(1)
Classification
Highly-Rich Gas/
Condensate
Highly-Rich
Gas Rich Gas Dry Gas
Modeled BTU 1313 1250 1150 1050
EUR (Bcfe): 20.8 18.8 16.8 15.3
EUR (MMBoe): 3.5 3.1 2.8 2.6
% Liquids: 33% 24% 12% 0%
Lateral Length (ft): 9,000 9,000 9,000 9,000
Well Cost ($MM): $10.3 $10.3 $10.3 $10.3
Bcfe/1,000’: 2.3 2.1 1.9 1.7
Pre-Tax NPV10 ($MM): $11.2 $5.8 $0.0 $0.8
Pre-Tax ROR: 38% 26% 10% 13%
Net F&D ($/Mcfe): $0.58 $0.64 $0.72 $0.79
Payout (Years): 2.4 3.4 7.8 6.8
Gross 3P Locations(3): 664 1,010 628 889
1. 6/30/2015 well economics based on 6/30/2015 strip pricing less basis differential and related transportation cost. Well economics include gathering, compression and processing fees, where
applicable. Well cost estimates are all-in and include $1.2 million assumed for road, pad and production facilities. Current well costs include legacy contracts. Spot well costs are adjusted for
current market drilling and completion rates resulting in a $1.2 million cost saving vs. current well costs. Antero will begin to realize spot well costs as the company utilizes incremental completion
crews for deferred completions beginning at year end 2015 and as existing drilling rig contracts begin to roll off during 2016.
2. Pricing for a 1225 BTU y-grade ethane rejection barrel. NGLs at 32.5% of WTI for 2015-2016 and 50% of WTI for 2017 and thereafter. NGL prices are forecast to increase in 2017 relative to WTI
due to projected in-service date of Mariner East II project allowing for a significant increase in AR NGL exports via ship.
3. Undeveloped well locations as of 12/31/2014.
2015
Drilling
Plan
248
139
94
254
289
15%
38%
47%
35%
40%
11%
29%
38%
28%
32%
0
50
100
150
200
250
300
0%
15%
30%
45%
60%
Condensate Highly-Rich Gas/
Condensate
Highly-Rich Gas Rich Gas Dry Gas
Total3PLocations
ROR
Total 3P Locations ROR @ 6/30/2015 Strip-Spot ROR @ 6/30/2015 Strip-Current
UTICA SINGLE WELL ECONOMICS
– IN ETHANE REJECTION
53
DRY GAS LOCATIONS RICH GAS LOCATIONS
HIGHLY
RICH GAS
LOCATIONS
Utica Well Economics and Gross Locations(1)
Classification Condensate
Highly-Rich Gas/
Condensate
Highly-Rich
Gas Rich Gas Dry Gas
Modeled BTU 1275 1235 1215 1175 1050
EUR (Bcfe): 9.4 17.0 25.3 23.8 21.4
EUR (MMBoe): 1.6 2.8 4.2 4.0 3.6
% Liquids 35% 26% 21% 14% 0%
Lateral Length (ft): 9,000 9,000 9,000 9,000 9,000
Well Cost ($MM): $11.6 $11.6 $11.6 $11.6 $11.6
Bcfe/1,000’: 1.0 1.9 2.8 2.7 2.4
Pre-Tax NPV10 ($MM): $0.3 $7.0 $11.2 $7.8 $8.6
Pre-Tax ROR: 11% 29% 38% 28% 32%
Net F&D ($/Mcfe): $1.52 $0.84 $0.57 $0.60 $0.67
Payout (Years): 7.0 2.6 2.2 2.9 2.4
Gross 3P Locations(3): 248 139 94 254 289
1. 6/30/2015 well economics based on 6/30/2015 strip pricing less basis differential and related transportation cost. Well economics include gathering, compression and processing fees, where
applicable. Well cost estimates are all-in and include $1.2 million assumed for road, pad and production facilities. Current well costs include legacy contracts. Spot well costs are adjusted for
current market drilling and completion rates resulting in a $1.2 million cost saving vs. current well costs. Antero will begin to realize spot well costs as the company utilizes incremental completion
crews for deferred completions beginning at year end 2015 and as existing drilling rig contracts begin to roll off during 2016.
2. Pricing for a 1225 BTU y-grade ethane rejection barrel. NGLs at 32.5% of WTI for 2015-2016 and 50% of WTI for 2017 and thereafter. NGL prices are forecast to increase in 2017 relative to WTI
due to projected in-service date of Mariner East II project allowing for a significant increase in AR NGL exports via ship.
3. Undeveloped well locations as of 12/31/2014. 3P locations representative of BTU regime; EUR and economics within regime will vary based on BTU content.
2015
Drilling
Plan
Assumptions
 Natural Gas – 6/30/2015 strip
 Oil – 6/30/2015 strip
 NGLs – 32.5% of Oil Price 2015-2016;
50% of Oil Price 2017+
NYMEX
($/MMBtu)
WTI
($/Bbl)
C3+ NGL(2)
($/Bbl)
2015 $2.87 $61 $20
2016 $3.14 $62 $20
2017 $3.32 $64 $32
2018 $3.40 $65 $32
2019 $3.47 $66 $33
2020-24 $3.61-$4.09 $66-$69 $34-$35
1,316 1,793 1,502 1,745 1,800 1,213 235
$4.51
$3.94 $3.83 $4.06 $3.94 $3.75 $3.67
$2.57 $2.77 $2.95 $3.01 $3.06 $3.17 $3.31
$0.00
$1.00
$2.00
$3.00
$4.00
$5.00
$6.00
0
200
400
600
800
1,000
1,200
1,400
1,600
1,800
6 Mths 2015 2016 2017 2018 2019 2020 2021
BBtu/d $/MMBtu
54
Average Index Hedge Price(1)Hedged Volume Current NYMEX Strip(2)
COMMODITY HEDGE POSITION
 ~$2.8 billion mark-to-market unrealized gain based on 9/30/2015 prices
 3.1 Tcfe hedged from October 1, 2015 through year-end 2021 and 83 Bcf of TCO basis hedged from 2015 to 2017
$235 MM $838 MM $494 MM $664 MM $575 MM $257 MM
Mark-to-Market Value(2)
LARGEST GAS HEDGE POSITION IN U.S. E&P
≈ 94% of 2015 
Guidance 
Hedged
541. Weighted average index price based on volumes hedged assuming 6:1 gas to liquids ratio; excludes impact of TCO basis hedges. 3,000 Bbl/d of oil and 23,000 Bbl/d of propane hedged for 2015.
2. As of 9/30/2015; 2015 mark-to-market value reflects October-December hedges.
 Hedging is a key component of Antero’s business model due to the large, repeatable drilling inventory
 Antero has realized almost $1.5 billion of gains on commodity hedges since 2008
– Gains realized in 29 of last 31 quarters
$MM $/Mcfe
$31 MM
$4
-$8
$5
$25
$34 $29 $28 $26 $12 $16 $17 $28 $29
$19 $25
$43
$80 $83
$59 $49 $48
$14
$47 $54
-$1
$1
$58
$78
$185
$196 $183
($2.00)
($1.00)
$0.00
$1.00
$2.00
$3.00
$4.00
($20.0)
$30.0
$80.0
$130.0
$180.0
$230.0
Quarterly Realized Gains/(Losses)
1Q '08 - 3Q '15
≈ 100% of 2016 
Target 
Midpoint
$0.14 $0.17
$0.23
$0.33
$0.11
$0.11
$0.12
$0.13
$0.00
$0.10
$0.20
$0.30
$0.40
$0.50
$0.60
$0.70
2013A 2014A 2015E 2016E
($/MMBtu)
Wtd. Avg. FT Demand ($/MMBtu) Wtd. Avg. FT Commodity/Fuel ($/MMBtu)
All-in Firm Transportation Costs(1)
FIRM TRANSPORTATION REDUCES APPALACHIAN
BASIS EXPOSURE
Appalachia
49%
Gulf Coast
51%
2013 Firm
Transportation(1)(2)
2013 Firm Transportation – 647 MMcf/d
Average All-in FT Cost $0.25/MMBtu
2016 Firm Transportation – 3.1 Bcf/d
Average All-in FT Cost $0.46/MMBtu
+ $0.18/MMBtu
 Antero’s firm transportation (FT) portfolio increases visibility on production growth and increases exposure to Gulf Coast and Midwest
pricing, with little incremental cost per Mcf
 Reduces weighted average basis by $0.35 per MMBtu compared to 2014 basis – while significantly reducing Appalachian basis
exposure
Utilized portion included
in cash production
expense
(fixed cost)
1. Assumes full utilization of firm transportation capacity.
2. Represents accessible firm transportation and sales agreements.
3. Based on current strip pricing as at 9/30/2015.
Included in cash
production expense
(variable cost)
$0.25
$0.28
$0.35
$0.46
2016 Basis(3)
TCO – $(0.22)/MMBtu
DOM S – $(1.05)/MMBtu
2016 Basis(3)
Chicago – $0.04/MMBtu
2016 Basis(3)
CGTLA – $(0.08)/MMBtu
55
Appalachia
35%
Midwest
20%
Gulf Coast
45%
$525
$1,000
$1,100
$750
$0
$200
$400
$600
$800
$1,000
$1,200
2015 2016 2017 2018 2019 2020 2021 2022 2023
($inMillions)
$1,500
$993
($525)
$0 $18
$0
$250
$500
$750
$1,000
$1,250
$1,500
Credit Facility
9/30/2015
Bank Debt
9/30/2015
L/Cs Outstanding
9/30/2015
Cash
9/30/2015
Liquidity
9/30/2015
56
STRONG FINANCIAL LIQUIDITY AND DEBT TERM
STRUCTURE
56
$4,000
$2,975
($500)
($535) $10
$0
$1,000
$2,000
$3,000
$4,000
Credit Facility
9/30/2015
Bank Debt
9/30/2015
L/Cs Outstanding
9/30/2015
Cash
9/30/2015
Liquidity
9/30/2015
AR LIQUIDITY POSITION ($MM) AM LIQUIDITY POSITION ($MM)
 Over $3.9 billion of combined AR and AM financial liquidity as of 9/30/2015
 No leverage covenant in AR bank facility, only interest coverage and working capital covenants
AR Credit Facility AR Senior Notes
DEBT MATURITY PROFILE
 Recent credit facility increases and equity offerings have allowed Antero to reduce its cost of debt to 4.4% and significantly enhance liquidity
while the average debt maturity is April 2021
AM Credit Facility
Moody's S&P
POSITIVE RATINGS MOMENTUM
Moody’s / S&P Historical Corporate Credit Ratings
“We could raise the ratings due to our assessment of an improvement in
the company's financial profile. An improvement in the financial profile
would include maintaining FFO to debt of greater than 45% and
narrowing the amount that the company outspends its cash flows by.”
- S&P Credit Research, September 2014
"The upgrade reflects Moody's expectation that Antero will continue to
report strong production growth and increasing reserves despite
challenging market conditions and without a significant increase in
leverage. Antero's low finding and development costs and significant
commodity hedge position should allow the company to continue to
prosper despite today's low commodity price environment.“
- Moody’s Credit Research, February 2015
Corporate Credit Rating
(Moody’s / S&P)
Ba3 / BB-
B1 / B+
B2 / B
B3 / B-
2/24/2011 10/21/2013 9/4/20145/31/13
Ba2 / BB
Ba1 / BB+
Caa1 / CCC+
(1)
1. Represents corporate credit rating of Antero Resources Corporation / Antero Resources LLC.
Baa3 / BBB-
Moody’s Upgrade Rationale S&P Upgrade Criteria
57
3/31/2015
Ba2/BB
9/30/20159/1/2010
LNG Exports
48%
Mexico/Canada
Exports
18%
Power
Generation
17%
Transportation
1%
Industrial
16%
20 BCF/D OF INCREMENTAL GAS DEMAND BY 2020
 Significant demand growth expected for U.S.
natural gas
 More than 65% of the 20 Bcf/d in incremental
gas demand forecast by 2020 is expected to
be generated from exports:
− LNG: 9.5 Bcf/d (~48%)
− Mexico/Canada: 3.5 Bcf/d (~18%)
 Of the 9.5 Bcf/d of expected incremental
demand from LNG export projects, 6.7 Bcf/d
(or 70%) of the projects have secured the
necessary DOE and FERC permits
58
Incremental Demand Growth Through 2020 by Category
Projected Incremental Natural Gas Demand Through 2020
Source: Simmons & Company International, “2015 US Natural Gas Outlook and Updated Long Term Demand Forecast,” September 2014.
Sherwood 7
2
5
9
13
17
20
0
4
8
12
16
20
2015 2016 2017 2018 2019 2020
Mexico/Canada Exports Power Generation
Transportation Petrochem
LNG Exports
9.5 Bcf/d of the 20 Bcf/d of
incremental demand is
expected to come from
LNG exports
(Bcf/d)
LNG
Exports
Power Gen
Petrochem
LNG Exports by Project
(in Bcf/d)
2015 2016 2017 2018 2019 2020 Total
Sabine Pass 1 - 0.6 - - - -
Sabine Pass 2 - 0.6 - - - -
Sabine Pass 3 - - 0.6 - - -
Sabine Pass 4 - - 0.6 - - -
Sabine Pass 5 - - - - 0.6 - 3.0
Cove Point 1 - - 0.4 - - -
Cove Point 2 - - - 0.4 - - 0.8
Cameron 1 - - - 0.6 - -
Cameron 2 - - - 0.6 - -
Cameron 3 - - - - 0.6 - 1.8
Freeport 1 - - - 0.5 - -
Freeport 2 - - - - 0.5 -
Freeport 3 - - - - 0.5 -
Freeport 4 - - - - - 0.4 2.1
Corpus Christi 1 - - - - 0.6 -
Corpus Christi 2 - - - - - 0.6 1.2
Lake Charles 1 - - - - - 0.6 0.6
LNG Incremental Exports - 1.2 1.6 2.2 2.9 1.7
LNG Cumulative Exports - 1.2 2.8 5.0 7.9 9.5
LNG EXPORTS BY PROJECT – EXPECTED START UP
 Assuming 9.5 Bcf/d of LNG exports by 2020,
the U.S. will be the world’s 3rd largest LNG
exporter behind Qatar and Australia
− 7.7 Bcf/d (81%) of the 9.5 Bcf/d of expected LNG
exports have secured US DOE non-FTA (Free
Trade Agreement) permit approval
− 6.7 Bcf/d (four projects, 70%) have been
awarded FERC construction permits
 The first LNG export project, Sabine Pass LNG
Train 1, is expected to commence operations
in early 2016
− Antero has committed to 200 MMcf/d on Sabine
Pass Trains 1-4
 The second LNG export project, Cove Point
LNG, is expected to commence operations in
mid-2017
− Antero has committed to 330 MMcf/d on Cove
Point 1 & 2
59
LNG Exports by Project Through 2020
Antero Supply Agreements
for Portion of Capacity
Source: Simmons & Company International, “2015 US Natural Gas Outlook and Updated Long Term Demand Forecast,” September 2014.
Note: Data updated for recent announcements subsequent to Simmons report.
Antero Supplied
2015 GLOBAL LPG DEMAND
 Global LPG demand is 8.5 MMBbl/d and growing
60
GLOBAL LPG DEMAND DRIVEN BY
PETCHEM AND RES/COMM
 Largest end-use sectors for LPG are residential/commercial, which tends to grow with population and improvement in
living standards in the emerging markets
− PIRA forecasting >1.0 MMBbl/d over next 5 years and >4.5 MMBbl/d of global LPG demand growth over next 20 years
611. PIRA NGL Study, September 2015.
MMBbl/d
14.7
13.0
11.4
9.8
8.2
6.5
4.9
3.3
1.6
GLOBAL LPG TRADE DRIVEN BY U.S. SHALE
 The U.S. is the largest single driver of the rapid expansion in LPG trade accounting for over 90% in trade growth
621. PIRA NGL Study, September 2015.
MMBbl/d
5.2
4.6
3.9
3.3
2.6
2.0
1.3
0.7
United States
U.S. SHALE NGL EURS SUPPORT LPG TRADE GROWTH
631. PIRA NGL Study, September 2015.
• U.S. shale play NGL reserves are 50.8 billion barrels
• Eagle Ford, Marcellus, Utica, Bakken and Permian are the
work horses of U.S. shale production growth
• Marcellus/Utica NGL resource estimate by PIRA is 9.7 billion
barrels, in line with Antero estimate of ≈ 11.1 billion barrels
• The growth curve of each basin will ultimately be a function
of downstream solutions and investment
(1)
(1)
(1)
POSITIVE OUTLOOK FOR LONG-TERM
ETHANE MARKETS AS WELL
U.S. Ethane Supply/Demand Balance Through 2020(1)
1. Source: Bentek, August 2015.
2. Source: Citi research dated 7/15/2015.
U.S. Ethane Exports Through 2020(2)
 U.S. ethane demand is projected to increase at an annual 3.5% CAGR through 2020, primarily based on an ≈8% CAGR for U.S. petrochem
demand and a 30% growth in exports primarily to Europe
− The growth in shipping exports in 2016 and 2017 is driven by Enterprise Products’ 200 MBbl/d export facility on the Gulf Coast
-
0.5
1.0
1.5
2.0
2.5
2012 2013 2014 2015 2016 2017 2018 2019 2020
MMBb/d
Petchem Exports Rejection Total Supply (Net Stock Change)
U.S. Seaborne Ethane Exports Through 2020(2)
-
50
100
150
200
250
300
350
2013 2014 2015 2016 2017 2018 2019 2020
MBbl/d
Ship Pipeline
250
200
150
100
50
MBbl/d
U.S. exports increase
significantly into 2016
and 2017 as EPD’s
Morgan Point Facility
comes in-service
U.S. Ethane Rejection by Region Through 2020(1)
Access to both
Marcus Hook and
the Gulf Coast is
critical to
optimizing ethane
netbacks
Rejection declines
significantly into 2018
Unlike LPG, 80% of
ethane will be
consumed in the U.S.
Petrochem demand increases at
≈8% CAGR through 2020
-
100
200
300
400
500
600
2012 2013 2014 2015 2016 2017 2018 2019 2020
MBbl/d
Williston PADD 4 PADD 1 (East Coast) PADD 2 PADD 3
No Northeast
rejection after 2017
64
Northeast
Ethane
Rejection
Exports
U.S.
PetChem
Europe
Mariner East II
Shipping
$0.25/Gal
NGL EXPORTS AND NETBACKS STEP-UP BY 4Q 2016
1. Source: Intercontinental exchange as of 6/30/2015.
2. Source of graphic: Tudor Pickering Holt & Co. research presentation dated June 16, 2015
3. As an anchor shipper on Mariner East II, Antero has the right to expand its NGL commitment with
notice to operator.
4. Shipping rates based on benchmark Baltic shipping rate of $129/ton as of 6/30/15, adjusted for
number of shipping days to NWE.
5. Pipeline fee equal to $0.0725/gal, per Mariner East I tariff. Terminal fee equal to $0.12/gal, per
TPH report dated June 16, 2015.
 Upon in-service of Mariner East II, Antero will have the ability to market its propane and n-butane to
international buyers, which we expect will provide uplifts of $0.14/Gal and $0.12/Gal, respectively, to
the current netbacks received from propane and n-butane volumes shipped to Mont Belvieu today
− In the meantime, Antero has 23,000 Bbl/d of propane hedged at $0.63/Bbl in 2015 and 30,000 Bbl/d
hedged at $0.59/Bbl in 2016
 Commitment to Mariner East II results in over $100 million in combined incremental annualized cash
flow from sales of propane and n-butane (~$75 MM from propane and ~$28 MM from n-butane)
Pricing
Propane: $0.43/Gal
N-Butane: $0.60/Gal
Pricing
Propane: $0.69/Gal
N-Butane: $0.87/Gal
Mariner East II
61,500 Bbl/d AR
Commitment
(see table below) (3)
4Q 2016 In-Service
Shipping
Propane: $0.18/Gal
N-Butane:
$0.21/Gal
Mont Belvieu Netback ($/Gal)
Propane N-Butane
August Mont Belvieu (1)
: $0.43 $0.60
Less: Shipping Costs to Mont Belvieu (2)
: (0.25) (0.25)
Appalachia Netback to AR: $0.18 $0.35
AR Mariner East II Commitment (Bbl/d)
Product Base Option (3)
Total
Ethane (C2) 11,500 - 11,500
Propane (C3) 35,000 35,000 70,000
Butane (C4) 15,000 15,000 30,000
Total 61,500 50,000 111,500
NWE Netback ($/Gal)
Propane N-Butane
August NWE Price (1)
: $0.69 $0.87
Less: Spot Freight (4)
: (0.18) (0.21)
FOB Margin at Marcus Hook: $0.51 $0.66
Less: Pipeline & Terminal Fee (5)
: (0.19) (0.19)
NWE Netback to AR: $0.32 $0.47
Upside to Appalachia Netback: $0.14 $0.12
65
ANTERO EBITDAX RECONCILIATION
66
EBITDAX Reconciliation
($ in millions) Quarter Ended LTM Ended
9/30/2015 9/30/2015
EBITDAX:
Net income (loss) including noncontrolling interest $544.7 $1,413.4
Commodity derivative fair value (gains) (1,079.1) (2,768.3)
Net cash receipts (payments) on settled derivatives instruments 205.9 665.1
(Gain) loss on sale of assets - (40.0)
Interest expense 60.9 222.9
Loss on early extinguishment of debt - -
Income tax expense (benefit) 335.5 868.5
Depreciation, depletion, amortization and accretion 189.1 706.5
Impairment of unproved properties 8.8 51.0
Exploration expense 1.1 9.8
Equity-based compensation expense 23.9 105.6
State franchise taxes - 0.6
Contract termination and rig stacking - 10.9
Consolidated Adjusted EBITDAX $290.8 $1,245.9
EBITDAX:
Net income from discontinued operations - -
(Gain) on sale of assets - -
Provision for income taxes - -
Adjusted EBITDAX from discontinued operations - -
Total Adjusted EBITDAX $290.8 $1,245.9
CAUTIONARY NOTE
The SEC permits oil and gas companies, in their filings with the SEC, to disclose only proved, probable and possible reserve estimates
(collectively, “3P”). Antero has provided internally generated estimates for proved, probable and possible reserves in this presentation in
accordance with SEC guidelines and definitions. The estimates of proved, probable and possible reserves as of December 31, 2014 included in
this presentation have been audited by Antero’s third-party engineers. Unless otherwise noted, reserve estimates as of December 31, 2014
assume ethane rejection and strip pricing.
Actual quantities that may be ultimately recovered from Antero’s interests may differ substantially from the estimates in this presentation. Factors
affecting ultimate recovery include the scope of Antero’s ongoing drilling program, which will be directly affected by commodity prices, the
availability of capital, drilling and production costs, availability of drilling services and equipment, drilling results, lease expirations, transportation
constraints, regulatory approvals and other factors; and actual drilling results, including geological and mechanical factors affecting recovery rates.
In this presentation:
 “3P reserves” refer to Antero’s estimated aggregate proved, probable and possible reserves as of December 31, 2014. The SEC prohibits
companies from aggregating proved, probable and possible reserves in filings with the SEC due to the different levels of certainty associated
with each reserve category.
 “EUR,” or “Estimated Ultimate Recovery,” refers to Antero’s internal estimates of per well hydrocarbon quantities that may be potentially
recovered from a hypothetical future well completed as a producer in the area. These quantities do not necessarily constitute or represent
reserves within the meaning of the Society of Petroleum Engineer’s Petroleum Resource Management System or the SEC’s oil and natural gas
disclosure rules.
 “Condensate” refers to gas having a heat content between 1250 BTU and 1300 BTU in the Utica Shale.
 “Highly-Rich Gas/Condensate” refers to gas having a heat content between 1275 BTU and 1350 BTU in the Marcellus Shale and 1225 BTU
and 1250 BTU in the Utica Shale.
 “Highly-Rich Gas” refers to gas having a heat content between 1200 BTU and 1275 BTU in the Marcellus Shale and 1200 BTU and 1225 BTU
in the Utica Shale.
 “Rich Gas” refers to gas having a heat content of between 1100 BTU and 1200 BTU.
 “Dry Gas” refers to gas containing insufficient quantities of hydrocarbons heavier than methane to allow their commercial extraction or to
require their removal in order to render the gas suitable for fuel use.
Regarding Hydrocarbon Quantities
67

More Related Content

What's hot

Company website-presentation-january-2015
Company website-presentation-january-2015Company website-presentation-january-2015
Company website-presentation-january-2015anteromidstream
 
Company website presentation august 2014
Company website presentation   august 2014Company website presentation   august 2014
Company website presentation august 2014AnteroResources
 
Company Overview - May 2015
Company Overview - May 2015Company Overview - May 2015
Company Overview - May 2015AnteroResources
 
Company website presentation (a) march 2016
Company website presentation (a)   march 2016Company website presentation (a)   march 2016
Company website presentation (a) march 2016AnteroResources
 
Company website presentation (b) december 2014
Company website presentation (b)   december 2014Company website presentation (b)   december 2014
Company website presentation (b) december 2014AnteroResources
 
Am website presentation (b) june 2016
Am website presentation (b)   june 2016Am website presentation (b)   june 2016
Am website presentation (b) june 2016anteromidstream
 
Company website presentation april 2014
Company website presentation   april 2014Company website presentation   april 2014
Company website presentation april 2014AnteroResources
 
Company website presentation - July 2014
Company website presentation -  July 2014Company website presentation -  July 2014
Company website presentation - July 2014AnteroResources
 
Company Website Presentation - August 2014
Company Website Presentation - August 2014Company Website Presentation - August 2014
Company Website Presentation - August 2014AnteroResources
 
Company website presentation (a) december 2014
Company website presentation (a)   december 2014Company website presentation (a)   december 2014
Company website presentation (a) december 2014AnteroResources
 
Company Website Presentation - April 2014 (C)
Company Website Presentation - April 2014 (C)Company Website Presentation - April 2014 (C)
Company Website Presentation - April 2014 (C)AnteroResources
 
Approach 2Q14 Results Presentation
Approach 2Q14 Results PresentationApproach 2Q14 Results Presentation
Approach 2Q14 Results PresentationApproachResources
 
Howard weil presentation 03.18.16 v_f1
Howard weil presentation 03.18.16 v_f1Howard weil presentation 03.18.16 v_f1
Howard weil presentation 03.18.16 v_f1AnteroResources
 
Company website presentation (c) october 2014
Company website presentation (c)   october 2014Company website presentation (c)   october 2014
Company website presentation (c) october 2014AnteroResources
 
Company Overview December 2014
Company Overview December 2014Company Overview December 2014
Company Overview December 2014AnteroResources
 
Company website presentation (a) november 2014
Company website presentation (a)   november 2014Company website presentation (a)   november 2014
Company website presentation (a) november 2014AnteroResources
 

What's hot (16)

Company website-presentation-january-2015
Company website-presentation-january-2015Company website-presentation-january-2015
Company website-presentation-january-2015
 
Company website presentation august 2014
Company website presentation   august 2014Company website presentation   august 2014
Company website presentation august 2014
 
Company Overview - May 2015
Company Overview - May 2015Company Overview - May 2015
Company Overview - May 2015
 
Company website presentation (a) march 2016
Company website presentation (a)   march 2016Company website presentation (a)   march 2016
Company website presentation (a) march 2016
 
Company website presentation (b) december 2014
Company website presentation (b)   december 2014Company website presentation (b)   december 2014
Company website presentation (b) december 2014
 
Am website presentation (b) june 2016
Am website presentation (b)   june 2016Am website presentation (b)   june 2016
Am website presentation (b) june 2016
 
Company website presentation april 2014
Company website presentation   april 2014Company website presentation   april 2014
Company website presentation april 2014
 
Company website presentation - July 2014
Company website presentation -  July 2014Company website presentation -  July 2014
Company website presentation - July 2014
 
Company Website Presentation - August 2014
Company Website Presentation - August 2014Company Website Presentation - August 2014
Company Website Presentation - August 2014
 
Company website presentation (a) december 2014
Company website presentation (a)   december 2014Company website presentation (a)   december 2014
Company website presentation (a) december 2014
 
Company Website Presentation - April 2014 (C)
Company Website Presentation - April 2014 (C)Company Website Presentation - April 2014 (C)
Company Website Presentation - April 2014 (C)
 
Approach 2Q14 Results Presentation
Approach 2Q14 Results PresentationApproach 2Q14 Results Presentation
Approach 2Q14 Results Presentation
 
Howard weil presentation 03.18.16 v_f1
Howard weil presentation 03.18.16 v_f1Howard weil presentation 03.18.16 v_f1
Howard weil presentation 03.18.16 v_f1
 
Company website presentation (c) october 2014
Company website presentation (c)   october 2014Company website presentation (c)   october 2014
Company website presentation (c) october 2014
 
Company Overview December 2014
Company Overview December 2014Company Overview December 2014
Company Overview December 2014
 
Company website presentation (a) november 2014
Company website presentation (a)   november 2014Company website presentation (a)   november 2014
Company website presentation (a) november 2014
 

Viewers also liked

Design project two brief
Design project two   brief Design project two   brief
Design project two brief Jonathan Lim
 
Optimizing The Ecommerce Exp Trends 2011
Optimizing The Ecommerce Exp Trends 2011Optimizing The Ecommerce Exp Trends 2011
Optimizing The Ecommerce Exp Trends 2011Chaitanya Rane
 
Temporalidade política em daniel bensaïd
Temporalidade política em daniel bensaïdTemporalidade política em daniel bensaïd
Temporalidade política em daniel bensaïdCARLOS BRETA
 
Company website presentation june 2016
Company website presentation   june 2016Company website presentation   june 2016
Company website presentation june 2016AnteroResources
 
Invent The Future The New Normal For Hotels In 2010 Beyond
Invent The Future The New Normal For Hotels In 2010 BeyondInvent The Future The New Normal For Hotels In 2010 Beyond
Invent The Future The New Normal For Hotels In 2010 BeyondChaitanya Rane
 
Phoenix Motorcars Case Study
Phoenix Motorcars Case StudyPhoenix Motorcars Case Study
Phoenix Motorcars Case StudyGailGuge
 
EUROHOLD_FR_(digital for email)
EUROHOLD_FR_(digital for email)EUROHOLD_FR_(digital for email)
EUROHOLD_FR_(digital for email)Mehdi Ziady
 
Company website presentation April 2016
Company website presentation April 2016Company website presentation April 2016
Company website presentation April 2016AnteroResources
 
The Higher Education Academy Framework
The Higher Education Academy FrameworkThe Higher Education Academy Framework
The Higher Education Academy FrameworkJISC infoNet
 
Introduction to the Higher Education Academy
Introduction to the Higher Education AcademyIntroduction to the Higher Education Academy
Introduction to the Higher Education AcademyJISC infoNet
 
programa nacional de la educacion
programa nacional de la educacionprograma nacional de la educacion
programa nacional de la educacionAdita Perez Perez
 
Hawaiian Airlines Social Media Marketing Presentation at HPU
Hawaiian Airlines Social Media Marketing Presentation at HPUHawaiian Airlines Social Media Marketing Presentation at HPU
Hawaiian Airlines Social Media Marketing Presentation at HPUAsiana Ponciano
 
2o taller de socialización proyecto diseño de producto turístico en Oriente A...
2o taller de socialización proyecto diseño de producto turístico en Oriente A...2o taller de socialización proyecto diseño de producto turístico en Oriente A...
2o taller de socialización proyecto diseño de producto turístico en Oriente A...1492.travel
 
POST’s CORRESPONDENCE PROBLEM
POST’s CORRESPONDENCE PROBLEMPOST’s CORRESPONDENCE PROBLEM
POST’s CORRESPONDENCE PROBLEMRajendran
 
Company website presentation september 2016
Company website presentation   september 2016Company website presentation   september 2016
Company website presentation september 2016AnteroResources
 
Company website presentation (a) july 2016
Company website presentation (a)   july 2016Company website presentation (a)   july 2016
Company website presentation (a) july 2016AnteroResources
 
Fast web development using groovy on grails
Fast web development using groovy on grailsFast web development using groovy on grails
Fast web development using groovy on grailsAnshuman Biswal
 

Viewers also liked (20)

Design project two brief
Design project two   brief Design project two   brief
Design project two brief
 
Optimizing The Ecommerce Exp Trends 2011
Optimizing The Ecommerce Exp Trends 2011Optimizing The Ecommerce Exp Trends 2011
Optimizing The Ecommerce Exp Trends 2011
 
Euubc
EuubcEuubc
Euubc
 
Temporalidade política em daniel bensaïd
Temporalidade política em daniel bensaïdTemporalidade política em daniel bensaïd
Temporalidade política em daniel bensaïd
 
Company website presentation june 2016
Company website presentation   june 2016Company website presentation   june 2016
Company website presentation june 2016
 
Invent The Future The New Normal For Hotels In 2010 Beyond
Invent The Future The New Normal For Hotels In 2010 BeyondInvent The Future The New Normal For Hotels In 2010 Beyond
Invent The Future The New Normal For Hotels In 2010 Beyond
 
Phoenix Motorcars Case Study
Phoenix Motorcars Case StudyPhoenix Motorcars Case Study
Phoenix Motorcars Case Study
 
Sweden
 Sweden Sweden
Sweden
 
EUROHOLD_FR_(digital for email)
EUROHOLD_FR_(digital for email)EUROHOLD_FR_(digital for email)
EUROHOLD_FR_(digital for email)
 
Company website presentation April 2016
Company website presentation April 2016Company website presentation April 2016
Company website presentation April 2016
 
The Higher Education Academy Framework
The Higher Education Academy FrameworkThe Higher Education Academy Framework
The Higher Education Academy Framework
 
Introduction to the Higher Education Academy
Introduction to the Higher Education AcademyIntroduction to the Higher Education Academy
Introduction to the Higher Education Academy
 
programa nacional de la educacion
programa nacional de la educacionprograma nacional de la educacion
programa nacional de la educacion
 
Seo histroy
Seo histroy Seo histroy
Seo histroy
 
Hawaiian Airlines Social Media Marketing Presentation at HPU
Hawaiian Airlines Social Media Marketing Presentation at HPUHawaiian Airlines Social Media Marketing Presentation at HPU
Hawaiian Airlines Social Media Marketing Presentation at HPU
 
2o taller de socialización proyecto diseño de producto turístico en Oriente A...
2o taller de socialización proyecto diseño de producto turístico en Oriente A...2o taller de socialización proyecto diseño de producto turístico en Oriente A...
2o taller de socialización proyecto diseño de producto turístico en Oriente A...
 
POST’s CORRESPONDENCE PROBLEM
POST’s CORRESPONDENCE PROBLEMPOST’s CORRESPONDENCE PROBLEM
POST’s CORRESPONDENCE PROBLEM
 
Company website presentation september 2016
Company website presentation   september 2016Company website presentation   september 2016
Company website presentation september 2016
 
Company website presentation (a) july 2016
Company website presentation (a)   july 2016Company website presentation (a)   july 2016
Company website presentation (a) july 2016
 
Fast web development using groovy on grails
Fast web development using groovy on grailsFast web development using groovy on grails
Fast web development using groovy on grails
 

Similar to Company website presentation november 2015

Antero Resources Company Overview - January 2016
Antero Resources Company Overview - January 2016Antero Resources Company Overview - January 2016
Antero Resources Company Overview - January 2016Marcellus Drilling News
 
Company website presentation (b) january 2016
Company website presentation (b)   january 2016Company website presentation (b)   january 2016
Company website presentation (b) january 2016AnteroResources
 
Company website presentation (b) january 2015
Company website presentation (b)   january 2015Company website presentation (b)   january 2015
Company website presentation (b) january 2015AnteroResources
 
Company website presentation (b) january 2015
Company website presentation (b)   january 2015Company website presentation (b)   january 2015
Company website presentation (b) january 2015AnteroResources
 
Company website presentation (a) january 2015
Company website presentation (a)   january 2015Company website presentation (a)   january 2015
Company website presentation (a) january 2015AnteroResources
 
Company website presentation march 2016
Company website presentation   march 2016Company website presentation   march 2016
Company website presentation march 2016AnteroResources
 
Company website presentation june 2015
Company website presentation   june 2015Company website presentation   june 2015
Company website presentation june 2015AnteroResources
 
Company Presentation - October 2014
Company Presentation - October 2014Company Presentation - October 2014
Company Presentation - October 2014AnteroResources
 
Am website presentation (a) september 2016
Am website presentation (a)   september 2016Am website presentation (a)   september 2016
Am website presentation (a) september 2016anteromidstream
 
Antero Resources Company Presentation - Updated Jan 14, 2015
Antero Resources Company Presentation - Updated Jan 14, 2015Antero Resources Company Presentation - Updated Jan 14, 2015
Antero Resources Company Presentation - Updated Jan 14, 2015Marcellus Drilling News
 
Company website presentation january 2015
Company website presentation   january 2015Company website presentation   january 2015
Company website presentation january 2015AnteroResources
 
Am website presentation september 2016
Am website presentation   september 2016Am website presentation   september 2016
Am website presentation september 2016anteromidstream
 
Company website presentation (a) february 2016
Company website presentation (a)   february 2016Company website presentation (a)   february 2016
Company website presentation (a) february 2016AnteroResources
 
Am website presentation (a) june 2016
Am website presentation (a)   june 2016Am website presentation (a)   june 2016
Am website presentation (a) june 2016anteromidstream
 
Am website presentation (c) june 2016
Am website presentation (c)   june 2016Am website presentation (c)   june 2016
Am website presentation (c) june 2016anteromidstream
 
Company website presentation (c) october 2014
Company website presentation (c)   october 2014Company website presentation (c)   october 2014
Company website presentation (c) october 2014AnteroResources
 
Am website presentation (a) july 2016
Am website presentation (a)   july 2016Am website presentation (a)   july 2016
Am website presentation (a) july 2016anteromidstream
 
Am website presentation july 2016
Am website presentation   july 2016Am website presentation   july 2016
Am website presentation july 2016anteromidstream
 
Company Overview September 2014
Company Overview September 2014Company Overview September 2014
Company Overview September 2014AnteroResources
 
Company website presentation (a) november 2014(2)
Company website presentation (a)   november 2014(2)Company website presentation (a)   november 2014(2)
Company website presentation (a) november 2014(2)AnteroResources
 

Similar to Company website presentation november 2015 (20)

Antero Resources Company Overview - January 2016
Antero Resources Company Overview - January 2016Antero Resources Company Overview - January 2016
Antero Resources Company Overview - January 2016
 
Company website presentation (b) january 2016
Company website presentation (b)   january 2016Company website presentation (b)   january 2016
Company website presentation (b) january 2016
 
Company website presentation (b) january 2015
Company website presentation (b)   january 2015Company website presentation (b)   january 2015
Company website presentation (b) january 2015
 
Company website presentation (b) january 2015
Company website presentation (b)   january 2015Company website presentation (b)   january 2015
Company website presentation (b) january 2015
 
Company website presentation (a) january 2015
Company website presentation (a)   january 2015Company website presentation (a)   january 2015
Company website presentation (a) january 2015
 
Company website presentation march 2016
Company website presentation   march 2016Company website presentation   march 2016
Company website presentation march 2016
 
Company website presentation june 2015
Company website presentation   june 2015Company website presentation   june 2015
Company website presentation june 2015
 
Company Presentation - October 2014
Company Presentation - October 2014Company Presentation - October 2014
Company Presentation - October 2014
 
Am website presentation (a) september 2016
Am website presentation (a)   september 2016Am website presentation (a)   september 2016
Am website presentation (a) september 2016
 
Antero Resources Company Presentation - Updated Jan 14, 2015
Antero Resources Company Presentation - Updated Jan 14, 2015Antero Resources Company Presentation - Updated Jan 14, 2015
Antero Resources Company Presentation - Updated Jan 14, 2015
 
Company website presentation january 2015
Company website presentation   january 2015Company website presentation   january 2015
Company website presentation january 2015
 
Am website presentation september 2016
Am website presentation   september 2016Am website presentation   september 2016
Am website presentation september 2016
 
Company website presentation (a) february 2016
Company website presentation (a)   february 2016Company website presentation (a)   february 2016
Company website presentation (a) february 2016
 
Am website presentation (a) june 2016
Am website presentation (a)   june 2016Am website presentation (a)   june 2016
Am website presentation (a) june 2016
 
Am website presentation (c) june 2016
Am website presentation (c)   june 2016Am website presentation (c)   june 2016
Am website presentation (c) june 2016
 
Company website presentation (c) october 2014
Company website presentation (c)   october 2014Company website presentation (c)   october 2014
Company website presentation (c) october 2014
 
Am website presentation (a) july 2016
Am website presentation (a)   july 2016Am website presentation (a)   july 2016
Am website presentation (a) july 2016
 
Am website presentation july 2016
Am website presentation   july 2016Am website presentation   july 2016
Am website presentation july 2016
 
Company Overview September 2014
Company Overview September 2014Company Overview September 2014
Company Overview September 2014
 
Company website presentation (a) november 2014(2)
Company website presentation (a)   november 2014(2)Company website presentation (a)   november 2014(2)
Company website presentation (a) november 2014(2)
 

More from AnteroResources

Company website presentation april 2017
Company website presentation   april 2017Company website presentation   april 2017
Company website presentation april 2017AnteroResources
 
Howard weil conference presentation march 2017 v-f (small)
Howard weil conference presentation   march 2017 v-f (small)Howard weil conference presentation   march 2017 v-f (small)
Howard weil conference presentation march 2017 v-f (small)AnteroResources
 
Company website presentation (b) march 2017
Company website presentation (b)   march 2017Company website presentation (b)   march 2017
Company website presentation (b) march 2017AnteroResources
 
Company website presentation march 2017
Company website presentation   march 2017Company website presentation   march 2017
Company website presentation march 2017AnteroResources
 
Credit suisse conference presentation february 2017 v-f
Credit suisse conference presentation   february 2017 v-fCredit suisse conference presentation   february 2017 v-f
Credit suisse conference presentation february 2017 v-fAnteroResources
 
Company website presentation (c) february 2017
Company website presentation (c)   february 2017Company website presentation (c)   february 2017
Company website presentation (c) february 2017AnteroResources
 
Company website presentation (b) february 2017
Company website presentation (b)   february 2017Company website presentation (b)   february 2017
Company website presentation (b) february 2017AnteroResources
 
Company website presentation (a) february 2017
Company website presentation (a)   february 2017Company website presentation (a)   february 2017
Company website presentation (a) february 2017AnteroResources
 
Company website presentation february 2017
Company website presentation   february 2017Company website presentation   february 2017
Company website presentation february 2017AnteroResources
 
Goldman Sachs Global Energy Conference
Goldman Sachs Global Energy ConferenceGoldman Sachs Global Energy Conference
Goldman Sachs Global Energy ConferenceAnteroResources
 
Company website presentation (a) december 2016
Company website presentation (a)   december 2016Company website presentation (a)   december 2016
Company website presentation (a) december 2016AnteroResources
 
Company website presentation december 2016
Company website presentation   december 2016Company website presentation   december 2016
Company website presentation december 2016AnteroResources
 
Company website presentation november 2016
Company website presentation   november 2016Company website presentation   november 2016
Company website presentation november 2016AnteroResources
 
Company website presentation (b) october 2016
Company website presentation (b)   october 2016Company website presentation (b)   october 2016
Company website presentation (b) october 2016AnteroResources
 
Company website presentation October 2016
Company website presentation October 2016Company website presentation October 2016
Company website presentation October 2016AnteroResources
 
Company website presentation october 2016
Company website presentation   october 2016Company website presentation   october 2016
Company website presentation october 2016AnteroResources
 
Company website presentation (b) september 2016
Company website presentation (b)   september 2016Company website presentation (b)   september 2016
Company website presentation (b) september 2016AnteroResources
 
Company website presentation (a) september 2016
Company website presentation (a)   september 2016Company website presentation (a)   september 2016
Company website presentation (a) september 2016AnteroResources
 
Barclays conference presentation (website) september 2016 v5
Barclays conference presentation (website)   september 2016 v5Barclays conference presentation (website)   september 2016 v5
Barclays conference presentation (website) september 2016 v5AnteroResources
 
Company website presentation august 2016
Company website presentation   august 2016Company website presentation   august 2016
Company website presentation august 2016AnteroResources
 

More from AnteroResources (20)

Company website presentation april 2017
Company website presentation   april 2017Company website presentation   april 2017
Company website presentation april 2017
 
Howard weil conference presentation march 2017 v-f (small)
Howard weil conference presentation   march 2017 v-f (small)Howard weil conference presentation   march 2017 v-f (small)
Howard weil conference presentation march 2017 v-f (small)
 
Company website presentation (b) march 2017
Company website presentation (b)   march 2017Company website presentation (b)   march 2017
Company website presentation (b) march 2017
 
Company website presentation march 2017
Company website presentation   march 2017Company website presentation   march 2017
Company website presentation march 2017
 
Credit suisse conference presentation february 2017 v-f
Credit suisse conference presentation   february 2017 v-fCredit suisse conference presentation   february 2017 v-f
Credit suisse conference presentation february 2017 v-f
 
Company website presentation (c) february 2017
Company website presentation (c)   february 2017Company website presentation (c)   february 2017
Company website presentation (c) february 2017
 
Company website presentation (b) february 2017
Company website presentation (b)   february 2017Company website presentation (b)   february 2017
Company website presentation (b) february 2017
 
Company website presentation (a) february 2017
Company website presentation (a)   february 2017Company website presentation (a)   february 2017
Company website presentation (a) february 2017
 
Company website presentation february 2017
Company website presentation   february 2017Company website presentation   february 2017
Company website presentation february 2017
 
Goldman Sachs Global Energy Conference
Goldman Sachs Global Energy ConferenceGoldman Sachs Global Energy Conference
Goldman Sachs Global Energy Conference
 
Company website presentation (a) december 2016
Company website presentation (a)   december 2016Company website presentation (a)   december 2016
Company website presentation (a) december 2016
 
Company website presentation december 2016
Company website presentation   december 2016Company website presentation   december 2016
Company website presentation december 2016
 
Company website presentation november 2016
Company website presentation   november 2016Company website presentation   november 2016
Company website presentation november 2016
 
Company website presentation (b) october 2016
Company website presentation (b)   october 2016Company website presentation (b)   october 2016
Company website presentation (b) october 2016
 
Company website presentation October 2016
Company website presentation October 2016Company website presentation October 2016
Company website presentation October 2016
 
Company website presentation october 2016
Company website presentation   october 2016Company website presentation   october 2016
Company website presentation october 2016
 
Company website presentation (b) september 2016
Company website presentation (b)   september 2016Company website presentation (b)   september 2016
Company website presentation (b) september 2016
 
Company website presentation (a) september 2016
Company website presentation (a)   september 2016Company website presentation (a)   september 2016
Company website presentation (a) september 2016
 
Barclays conference presentation (website) september 2016 v5
Barclays conference presentation (website)   september 2016 v5Barclays conference presentation (website)   september 2016 v5
Barclays conference presentation (website) september 2016 v5
 
Company website presentation august 2016
Company website presentation   august 2016Company website presentation   august 2016
Company website presentation august 2016
 

Recently uploaded

Teck Investor Presentation, April 24, 2024
Teck Investor Presentation, April 24, 2024Teck Investor Presentation, April 24, 2024
Teck Investor Presentation, April 24, 2024TeckResourcesLtd
 
slideshare Call girls Noida Escorts 9999965857 henakhan
slideshare Call girls Noida Escorts 9999965857 henakhanslideshare Call girls Noida Escorts 9999965857 henakhan
slideshare Call girls Noida Escorts 9999965857 henakhanhanshkumar9870
 
Call Girls In Amritsar 💯Call Us 🔝 76967 34778🔝 💃 Independent Escort In Amritsar
Call Girls In Amritsar 💯Call Us 🔝 76967 34778🔝 💃 Independent Escort In AmritsarCall Girls In Amritsar 💯Call Us 🔝 76967 34778🔝 💃 Independent Escort In Amritsar
Call Girls In Amritsar 💯Call Us 🔝 76967 34778🔝 💃 Independent Escort In Amritsaronly4webmaster01
 
Collective Mining | Corporate Presentation - April 2024
Collective Mining | Corporate Presentation - April 2024Collective Mining | Corporate Presentation - April 2024
Collective Mining | Corporate Presentation - April 2024CollectiveMining1
 
VIP 7001035870 Find & Meet Hyderabad Call Girls Abids high-profile Call Girl
VIP 7001035870 Find & Meet Hyderabad Call Girls Abids high-profile Call GirlVIP 7001035870 Find & Meet Hyderabad Call Girls Abids high-profile Call Girl
VIP 7001035870 Find & Meet Hyderabad Call Girls Abids high-profile Call Girladitipandeya
 
CALL ON ➥8923113531 🔝Call Girls Fazullaganj Lucknow best sexual service
CALL ON ➥8923113531 🔝Call Girls Fazullaganj Lucknow best sexual serviceCALL ON ➥8923113531 🔝Call Girls Fazullaganj Lucknow best sexual service
CALL ON ➥8923113531 🔝Call Girls Fazullaganj Lucknow best sexual serviceanilsa9823
 
Sustainability Leadership, April 26 2024
Sustainability Leadership, April 26 2024Sustainability Leadership, April 26 2024
Sustainability Leadership, April 26 2024TeckResourcesLtd
 
High Profile Call Girls Kolkata Gayatri 🤌 8250192130 🚀 Vip Call Girls Kolkata
High Profile Call Girls Kolkata Gayatri 🤌  8250192130 🚀 Vip Call Girls KolkataHigh Profile Call Girls Kolkata Gayatri 🤌  8250192130 🚀 Vip Call Girls Kolkata
High Profile Call Girls Kolkata Gayatri 🤌 8250192130 🚀 Vip Call Girls Kolkataanamikaraghav4
 
Malad Escorts, (Pooja 09892124323), Malad Call Girls Service
Malad Escorts, (Pooja 09892124323), Malad Call Girls ServiceMalad Escorts, (Pooja 09892124323), Malad Call Girls Service
Malad Escorts, (Pooja 09892124323), Malad Call Girls ServicePooja Nehwal
 
Short-, Mid-, and Long-term gxxoals.pptx
Short-, Mid-, and Long-term gxxoals.pptxShort-, Mid-, and Long-term gxxoals.pptx
Short-, Mid-, and Long-term gxxoals.pptxHenryBriggs2
 
VIP Kolkata Call Girl Rishra 👉 8250192130 Available With Room
VIP Kolkata Call Girl Rishra 👉 8250192130  Available With RoomVIP Kolkata Call Girl Rishra 👉 8250192130  Available With Room
VIP Kolkata Call Girl Rishra 👉 8250192130 Available With Roomdivyansh0kumar0
 
VIP 7001035870 Find & Meet Hyderabad Call Girls Shamirpet high-profile Call Girl
VIP 7001035870 Find & Meet Hyderabad Call Girls Shamirpet high-profile Call GirlVIP 7001035870 Find & Meet Hyderabad Call Girls Shamirpet high-profile Call Girl
VIP 7001035870 Find & Meet Hyderabad Call Girls Shamirpet high-profile Call Girladitipandeya
 
Methanex Investor Presentation (April 2024)
Methanex Investor Presentation (April 2024)Methanex Investor Presentation (April 2024)
Methanex Investor Presentation (April 2024)Methanex Corporation
 

Recently uploaded (20)

Teck Investor Presentation, April 24, 2024
Teck Investor Presentation, April 24, 2024Teck Investor Presentation, April 24, 2024
Teck Investor Presentation, April 24, 2024
 
slideshare Call girls Noida Escorts 9999965857 henakhan
slideshare Call girls Noida Escorts 9999965857 henakhanslideshare Call girls Noida Escorts 9999965857 henakhan
slideshare Call girls Noida Escorts 9999965857 henakhan
 
Call Girls 🫤 East Of Kailash ➡️ 9999965857 ➡️ Delhi 🫦 Russian Escorts FULL ...
Call Girls 🫤 East Of Kailash ➡️ 9999965857  ➡️ Delhi 🫦  Russian Escorts FULL ...Call Girls 🫤 East Of Kailash ➡️ 9999965857  ➡️ Delhi 🫦  Russian Escorts FULL ...
Call Girls 🫤 East Of Kailash ➡️ 9999965857 ➡️ Delhi 🫦 Russian Escorts FULL ...
 
Escort Service Call Girls In Shalimar Bagh, 99530°56974 Delhi NCR
Escort Service Call Girls In Shalimar Bagh, 99530°56974 Delhi NCREscort Service Call Girls In Shalimar Bagh, 99530°56974 Delhi NCR
Escort Service Call Girls In Shalimar Bagh, 99530°56974 Delhi NCR
 
Call Girls In Amritsar 💯Call Us 🔝 76967 34778🔝 💃 Independent Escort In Amritsar
Call Girls In Amritsar 💯Call Us 🔝 76967 34778🔝 💃 Independent Escort In AmritsarCall Girls In Amritsar 💯Call Us 🔝 76967 34778🔝 💃 Independent Escort In Amritsar
Call Girls In Amritsar 💯Call Us 🔝 76967 34778🔝 💃 Independent Escort In Amritsar
 
Collective Mining | Corporate Presentation - April 2024
Collective Mining | Corporate Presentation - April 2024Collective Mining | Corporate Presentation - April 2024
Collective Mining | Corporate Presentation - April 2024
 
Call Girls Service Green Park @9999965857 Delhi 🫦 No Advance VVIP 🍎 SERVICE
Call Girls Service Green Park @9999965857 Delhi 🫦 No Advance  VVIP 🍎 SERVICECall Girls Service Green Park @9999965857 Delhi 🫦 No Advance  VVIP 🍎 SERVICE
Call Girls Service Green Park @9999965857 Delhi 🫦 No Advance VVIP 🍎 SERVICE
 
Vip Call Girls Vasant Kunj ➡️ Delhi ➡️ 9999965857 No Advance 24HRS Live
Vip Call Girls Vasant Kunj ➡️ Delhi ➡️ 9999965857 No Advance 24HRS LiveVip Call Girls Vasant Kunj ➡️ Delhi ➡️ 9999965857 No Advance 24HRS Live
Vip Call Girls Vasant Kunj ➡️ Delhi ➡️ 9999965857 No Advance 24HRS Live
 
VIP 7001035870 Find & Meet Hyderabad Call Girls Abids high-profile Call Girl
VIP 7001035870 Find & Meet Hyderabad Call Girls Abids high-profile Call GirlVIP 7001035870 Find & Meet Hyderabad Call Girls Abids high-profile Call Girl
VIP 7001035870 Find & Meet Hyderabad Call Girls Abids high-profile Call Girl
 
CALL ON ➥8923113531 🔝Call Girls Fazullaganj Lucknow best sexual service
CALL ON ➥8923113531 🔝Call Girls Fazullaganj Lucknow best sexual serviceCALL ON ➥8923113531 🔝Call Girls Fazullaganj Lucknow best sexual service
CALL ON ➥8923113531 🔝Call Girls Fazullaganj Lucknow best sexual service
 
Sustainability Leadership, April 26 2024
Sustainability Leadership, April 26 2024Sustainability Leadership, April 26 2024
Sustainability Leadership, April 26 2024
 
High Profile Call Girls Kolkata Gayatri 🤌 8250192130 🚀 Vip Call Girls Kolkata
High Profile Call Girls Kolkata Gayatri 🤌  8250192130 🚀 Vip Call Girls KolkataHigh Profile Call Girls Kolkata Gayatri 🤌  8250192130 🚀 Vip Call Girls Kolkata
High Profile Call Girls Kolkata Gayatri 🤌 8250192130 🚀 Vip Call Girls Kolkata
 
Malad Escorts, (Pooja 09892124323), Malad Call Girls Service
Malad Escorts, (Pooja 09892124323), Malad Call Girls ServiceMalad Escorts, (Pooja 09892124323), Malad Call Girls Service
Malad Escorts, (Pooja 09892124323), Malad Call Girls Service
 
Short-, Mid-, and Long-term gxxoals.pptx
Short-, Mid-, and Long-term gxxoals.pptxShort-, Mid-, and Long-term gxxoals.pptx
Short-, Mid-, and Long-term gxxoals.pptx
 
Rohini Sector 15 Call Girls Delhi 9999965857 @Sabina Saikh No Advance
Rohini Sector 15 Call Girls Delhi 9999965857 @Sabina Saikh No AdvanceRohini Sector 15 Call Girls Delhi 9999965857 @Sabina Saikh No Advance
Rohini Sector 15 Call Girls Delhi 9999965857 @Sabina Saikh No Advance
 
VIP Kolkata Call Girl Rishra 👉 8250192130 Available With Room
VIP Kolkata Call Girl Rishra 👉 8250192130  Available With RoomVIP Kolkata Call Girl Rishra 👉 8250192130  Available With Room
VIP Kolkata Call Girl Rishra 👉 8250192130 Available With Room
 
VIP 7001035870 Find & Meet Hyderabad Call Girls Shamirpet high-profile Call Girl
VIP 7001035870 Find & Meet Hyderabad Call Girls Shamirpet high-profile Call GirlVIP 7001035870 Find & Meet Hyderabad Call Girls Shamirpet high-profile Call Girl
VIP 7001035870 Find & Meet Hyderabad Call Girls Shamirpet high-profile Call Girl
 
Methanex Investor Presentation (April 2024)
Methanex Investor Presentation (April 2024)Methanex Investor Presentation (April 2024)
Methanex Investor Presentation (April 2024)
 
Call Girls 🫤 Nehru Place ➡️ 9999965857 ➡️ Delhi 🫦 Russian Escorts FULL ENJOY
Call Girls 🫤 Nehru Place ➡️ 9999965857  ➡️ Delhi 🫦  Russian Escorts FULL ENJOYCall Girls 🫤 Nehru Place ➡️ 9999965857  ➡️ Delhi 🫦  Russian Escorts FULL ENJOY
Call Girls 🫤 Nehru Place ➡️ 9999965857 ➡️ Delhi 🫦 Russian Escorts FULL ENJOY
 
Call Girls 🫤 Hauz Khas ➡️ 9999965857 ➡️ Delhi 🫦 Russian Escorts FULL ENJOY
Call Girls 🫤 Hauz Khas ➡️ 9999965857  ➡️ Delhi 🫦  Russian Escorts FULL ENJOYCall Girls 🫤 Hauz Khas ➡️ 9999965857  ➡️ Delhi 🫦  Russian Escorts FULL ENJOY
Call Girls 🫤 Hauz Khas ➡️ 9999965857 ➡️ Delhi 🫦 Russian Escorts FULL ENJOY
 

Company website presentation november 2015

  • 2. FORWARD-LOOKING STATEMENTS This presentation contains forward-looking statements within the meaning of Section 27A of the Securities Act of 1933 and Section 21E of the Securities Exchange Act of 1934. All statements, other than statements of historical facts, included in this presentation that address activities, events or developments that Antero Resources Corporation and its subsidiaries (collectively, the “Company” or “Antero”) expects, believes or anticipates will or may occur in the future are forward-looking statements. The words “believe,” “expect,” “anticipate,” “plan,” “intend,” “estimate,” “project,” “foresee,” “should,” “would,” “could,” or other similar expressions are intended to identify forward-looking statements. However, the absence of these words does not mean that the statements are not forward-looking. Without limiting the generality of the foregoing, forward- looking statements contained in this presentation specifically include estimates of the Company’s reserves, expectations of plans, strategies, objectives and anticipated financial and operating results of the Company, including as to the Company’s drilling program, production, hedging activities, capital expenditure levels and other guidance included in this presentation. These statements are based on certain assumptions made by the Company based on management’s experience and perception of historical trends, current conditions, anticipated future developments and other factors believed to be appropriate. Such statements are subject to a number of assumptions, risks and uncertainties, many of which are beyond the control of the Company, which may cause actual results to differ materially from those implied or expressed by the forward-looking statements. These include the factors discussed or referenced under the heading “Item 1A. Risk Factors” in our Annual Report on Form 10-K for the year ended December 31, 2014 and in the Company’s subsequent filings with the SEC. The Company cautions you that these forward-looking statements are subject to all of the risks and uncertainties, most of which are difficult to predict and many of which are beyond our control, incident to the exploration for and development, production, gathering and sale of natural gas and oil. These risks include, but are not limited to, commodity price volatility, inflation, lack of availability of drilling and production equipment and services, environmental risks, drilling and other operating risks, regulatory changes, the uncertainty inherent in estimating natural gas and oil reserves and in projecting future rates of production, cash flow and access to capital, the timing of development expenditures, and the other risks described under the heading “Risk Factors” in our Annual Report on Form 10-K for the year ended December 31, 2014 and in the Company’s subsequent filings with the SEC. Any forward-looking statement speaks only as of the date on which such statement is made and the Company undertakes no obligation to correct or update any forward-looking statement, whether as a result of new information, future events or otherwise, except as required by applicable law. 1 Antero Resources Corporation is denoted as “AR” and Antero Midstream Partners LP is denoted as “AM” in the presentation, which are their respective New York Stock Exchange ticker symbols.
  • 3. 2 CHANGES SINCE OCTOBER 2015 PRESENTATION Updated AR and AM standalone leverage and liquidity slides for 9/30/2015 pricing Slide 14 Updated AR slide showing 3Q 2015 natural gas and equivalent realizations Slide 15 Updated AR slide showing liquidity position and debt maturity position as of 9/30/2015 Slide 56 Updated AR slide showing debt position and financial and operating statistics as of 9/30/2015 Slide 45 Updated AM slide showing capitalization table and cash position as of 9/30/2015 Slide 43 Updated EBITDAX reconciliation slide as of 9/30/2015 Slide 66
  • 4. THE BRIDGE TO BETTER OIL & GAS PRICES 2015E 2016E 2017E Large and Growing Production Base Low Development Costs Substantial Long-Term Hedge Position Strong Liquidity Favorable Markets 1.4 Bcfe/d+ 25% - 30% growth target midpoint 1.785 Bcfe/d Peer leading ~$0.90/Mcfe YTD Service costs declining and efficiencies improving 2,400 “high grade” horizontal locations with similar economics Peer leading 1,316 MMcfe/d hedged at $4.43/MMBtu (94% of guidance) 1,793 MMcfe/d hedged at $3.94/MMBtu (≈100% of target midpoint) 1,502 MMcfe/d hedged at $3.83/MMBtu $3.0 billion at 9/30/2015; additional $2.7 billion of liquid AM units Continued improvement with growth in PDP reserves, midstream assets and hedge portfolio Continued improvement with growth in PDP reserves, midstream assets and hedge portfolio 2.3 Bcf/d of FT Expect 71% of sales volumes to favorable markets 3.9 Bcf/d of FT Expect 85% of sales volumes to favorable markets 4.0 Bcf/d of FT Expect 94% of sales volumes to favorable markets  Antero holds a leading position within the lowest cost U.S. basin, a substantial long-term hedge position, $5.7 billion of direct and indirect liquidity, and an increasing % of volumes sold to favorable markets 3
  • 5. 47% 45% 40% 38% 35% 31% 16% 15% 14% 38% 38% 32% 29% 28% 26% 13% 11% 10% 0% 10% 20% 30% 40% 50% Utica Highly- Rich Gas Marcellus Highly-Rich Gas/ Condensate Utica Dry Gas - Ohio Utica Highly- Rich Gas/ Condensate Utica Rich Gas Marcellus Highly-Rich Gas Marcellus Dry Gas Utica Condensate Marcellus Rich Gas ROR ROR @ 6/30/2015 Strip - Spot Well Costs ROR @ 6/30/2015 Strip - Current Well Costs AR WACC ≈ 8.5% Antero Drilling Plan Locations 94 664 289 139 254 1,010 889 248 628 1. 6/30/2015 pre-tax well economics based on a 9,000’ lateral, 6/30/2015 natural gas and WTI strip pricing for 2015-2024, flat thereafter, NGLs at 32.5% of WTI for 2015–2016 and 50% of WTI thereafter, and applicable firm transportation and operating costs . Well cost estimates include $1.2 million assumed for road, pad and production facilities. Current well costs include legacy contracts. Spot well costs are adjusted for current market drilling and completion rates resulting in a $1.2 million cost saving vs. current well costs. Antero will begin to realize spot well costs as the company utilizes incremental completion crews for deferred completions beginning at year end 2015 and as existing drilling rig contracts begin to roll off during 2016. 2. Market data for WACC calculation as of 8/25/2015. HIGH RETURN LOCATIONS DRIVE VALUE CREATION 4  Using the 6/30/2015 strip, 100% of Antero’s 4,200+ fully-engineered undrilled Marcellus/Utica 3P locations exceed Antero’s underlying weighted average cost of capital (WACC) of 8.5% − Well economics on some wells expected to improve further starting in early 2016 as the Company utilizes incremental market based contracts for drilling and completion operations which is expected to reduce well costs by another 10 to 12% over time − These returns are based on all-in well costs which include $1.2 million of road, pad and production facilities costs ANTERO MARCELLUS & UTICA WELL ECONOMICS(1)(2) 2,450 “High Grade” Drilling Locations
  • 6. 5 Most Active Operator in Appalachia Largest Firm Transport and Processing Portfolio in Appalachia Largest Gas Hedge Position in U.S. E&P + Strong Financial Liquidity Highest Growth Large Cap E&P Largest Core Liquids- Rich Position in Appalachia Highest Realizations and Margins Among Large Cap Appalachian Peers Growth Liquids-Rich Hedging & Liquidity Midstream Drilling LEADING UNCONVENTIONAL BUSINESS MODEL MLP (NYSE: AM) Highlights Substantial Value in Midstream Business Realizations Takeaway Well Economics 1 2 3 4 5 67 8 Premier Appalachian E&P Company Run by Co-Founders Low Break-Even Price Economics
  • 7. Note: 2014 SEC prices were $4.07/MMBtu for natural gas and $81.48/Bbl for oil on a weighted average Appalachian index basis. 1. All net acres allocated to the WV/PA Utica Shale Dry Gas and Upper Devonian Shale are included among the net acres allocated to the Marcellus Shale as they are stacked pay formations attributable to the same leasehold. 2. Antero and industry rig locations as of 10/2/2015, and average rig count for 1H 2015, per RigData. DRILLING – MOST ACTIVE OPERATOR IN APPALACHIA 6 COMBINED TOTAL – 12/31/14 RESERVES Assumes Ethane Rejection Net Proved Reserves 12.7 Tcfe Net 3P Reserves 40.7 Tcfe Pre-Tax 3P PV-10 $22.8 Bn Net 3P Reserves & Resource 53 to 57 Tcfe Net 3P Liquids 1,026 MMBbls % Liquids – Net 3P 15% 3Q 2015 Net Production 1,506 MMcfe/d - 3Q 2015 Net Liquids 52,250 Bbl/d Net Acres(1) 565,000 Undrilled 3P Locations 5,331 UTICA SHALE CORE Net Proved Reserves 758 Bcfe Net 3P Reserves 7.6 Tcfe Pre-Tax 3P PV-10 $6.1 Bn Net Acres 147,000 Undrilled 3P Locations 1,024 MARCELLUS SHALE CORE Net Proved Reserves 11.9 Tcfe Net 3P Reserves 28.4 Tcfe Pre-Tax 3P PV-10 $16.8 Bn Net Acres 418,000 Undrilled 3P Locations 3,191 UPPER DEVONIAN SHALE Net Proved Reserves 8 Bcfe Net 3P Reserves 4.6 Tcfe Pre-Tax 3P PV-10 NM Undrilled 3P Locations 1,116 WV/PA UTICA SHALE DRY GAS Net Resource 12.5 to 16 Tcf Net Acres 186,000 Undrilled Locations 1,889 0 2 4 6 8 10 12 14 RigCount Operators 1H 2015 Avg SW Marcellus & Utica(2)
  • 8. 0.25 0.50 0.75 1.00 1.25 1.50 4Q'13 Annualized 2014A 2015E 29% 22% 19% 17% 10% (4%) -10% -5% 0% 5% 10% 15% 20% 25% 30% 35% AR Peer 1 Peer 2 Peer 3 Peer 4 Peer 5 GROWTH – DEBT-ADJUSTED PER SHARE PRODUCTION 7  Based on the strength of its drilling program, and focus on the highly prolific Marcellus and Utica Shale core areas, Antero has delivered 29% compounded annual growth in net debt-adjusted production per share since its IPO in October 2013  Antero’s net debt-adjusted production per share growth rate is seven percentage points higher than the next closest Appalachian peer NOTE: Production/Net Debt-Adjusted Share = total production divided by net debt-adjusted shares outstanding each period. 1. Net debt-adjusted shares = net debt at end of each period/stock price average for each respective period, plus average common shares outstanding each respective period. 2. Peers include CNX, COG, EQT, RRC, SWN. AR Annualized Production / Net Debt-Adjusted Share(1) Mcfe/Share Net Debt-Adjusted Production per Share Growth vs. Peers (2) (Since AR IPO)
  • 9. 0 10,000 20,000 30,000 40,000 2010 2011 2012 2013 2014 2015E NGLs (C3+) Oil 5 246 6,436 23,051 37,000+ 61%+ Growth Guidance1. Assumes ethane rejection. 2. Reflects midpoint of 2016 production growth target of 25%-30%. 1,400 1,785 0 600 1,200 1,800 2010 2011 2012 2013 2014 2015E 2016E Marcellus Utica Guidance 30 124 239 522 1,007 8 AVERAGE NET DAILY PRODUCTION (MMcfe/d) 0 50 100 150 200 2010 2011 2012 2013 2014 2015E Marcellus Utica Deferred Completions 19 38 60 114 177 180 130 GROWTH – STRONG TRACK RECORD OPERATED GROSS WELLS COMPLETED 40%+ Growth Guidance 0 3,000 6,000 9,000 12,000 15,000 2010 2011 2012 2013 2014 Marcellus Utica 677 2,844 4,283 7,632 (1) (1) 12,683 (1) NET PROVED RESERVES (Bcfe) AVERAGE NET DAILY LIQUIDS PRODUCTION (Bbl/d) + 25%-30% Growth Target (2)
  • 10. 9 LIQUIDS-RICH – LARGEST CORE POSITION Source: Core outlines and peer net acreage positions based on investor presentations, news releases and 10-K/10-Qs. Rig information per RigData as of 10/2/2015. 1. Based on company filings and presentations. Peer group includes AEP, CHK, CNX, CVX, ECR, EQT, GPOR, NBL, RRC, STO, SWN. • Antero has the largest core liquids- rich position in Appalachia with ≈371,000 net acres (> 1100 Btu) • Represents over 21% of core liquids- rich acreage in Marcellus and Utica plays combined • 2x its closest competitor  Antero has over 3,000 undeveloped rich gas locations with an average lateral length of 6,800’ in its 3P reserves 0 100 200 300 400 (000s) Core Liquids-Rich Net Acres(1)
  • 11. $39 $42 $44 $51 $53 $54 $60 $64 $65 $68 $69 $72 $83 $86 $0 $20 $40 $60 $80 $100 WTIPrice($/Bbl) Antero 2015 Drilling Plan $1.94 $2.20 $2.20 $2.37 $2.96 $3.13 $3.31 $3.48 $3.50 $3.63 $3.77 $3.85 $3.88 $3.98 $4.33 $4.38 $5.56 $5.62 $5.69 $5.71 $5.74 $0.00 $1.00 $2.00 $3.00 $4.00 $5.00 $6.00 $7.00 NYMEXPrice($/MMBtu) Antero 2015 Drilling Plan Assumes $65/Bbl WTI Oil(3) WELL ECONOMICS – LOW BREAK-EVEN PRICE ECONOMICS North American Gas Resource Play Breakeven Natural Gas Prices ($/MMBtu)(3) 10 North American Breakeven Oil Prices ($/Bbl)(1) 2015 NYMEX Strip: $3.01/MMBtu(2) 2015 WTI Strip: $56.26/Bbl(2)  Marcellus and Utica undeveloped 3P rich-gas locations have the lowest breakeven prices for both oil and natural gas compared to other U.S. shale plays 1. Source: Credit Suisse report dated December 2014 – Break-even WTI oil price to generate 15% after-tax rate of return. Assumes NYMEX gas price of $3.66/MMBtu for 2015-2019; $4.23/MMBtu thereafter. 2. 2015 one year WTI crude oil strip price as of 12/31/2014; NYMEX one year natural gas strip price as of 12/31/2014. 3. Source: Credit Suisse report dated December 2014 – Break-even NYMEX gas price to generate 15% after-tax rate of return. Assumes WTI oil price of $64.74/Bbl for 2015-2019; $70.50/Bbl thereafter; NGLs at 35% of WTI vs. Antero guidance of 30%-35% of WTI for 2015-2016 and 50% of WTI for 2017 and thereafter, driven by completion of Mariner East II project expected by year-end 2016. Antero Projects Assumes $3.66/MMBtu NYMEX Gas(1)
  • 12. Antero Resources Corporation (NYSE: AR) $10.0 Billion Enterprise Value(1) Ba2/BB Corporate Rating Antero Midstream Partners LP (NYSE: AM) $4.1 Billion Valuation(1) 67% Limited Partner Interest E&P Assets Gathering/Compression Assets MIDSTREAM – MLP (NYSE: AM) HIGHLIGHTS SUBSTANTIAL VALUE IN MIDSTREAM BUSINESS 1. AR enterprise value excludes AM minority interest and cash. Market values as of 10/23/2015; balance sheet data as of 9/30/2015. 2. Based on 277.0 million AR shares outstanding and 175.8 million AM units outstanding. 11 Corporate Structure Overview(1) Market Valuation of AR Ownership in AM: • AR ownership: 67% LP Interest = 116.9 million units AM Price per Unit AM Units Owned by AR (MM) AR Value in AM LP Units ($MMs) Value Per AR Share(2) $19 117 $2,221 $8 $20 117 $2,338 $8 $21 117 $2,455 $9 $22 117 $2,572 $9 $23 117 $2,689 $10 $24 117 $2,806 $10 Water Infrastructure Assets = $2.7 Billion Market Valuation(1) MLP Benefits: - Funding vehicle to expand midstream business - Highlights value of Antero Midstream - Liquid asset for Antero Resources
  • 13. TAKEAWAY – LARGEST FIRM TRANSPORTATION AND PROCESSING PORTFOLIO IN APPALACHIA Antero Long Term Firm Processing & Takeaway Position (YE 2018) – Accessing Favorable Markets Mariner East 2 62 MBbl/d Commitment Marcus Hook Export Shell 20 MBbl/d Commitment Beaver County Cracker (Pending FID YE‘15) Sabine Pass (Trains 1-4) 50 MMcf/d per Train Freeport LNG 70 MMcf/d 1. November 2015 and full year 2016 futures basis, respectively, provided by Wells Fargo dated 9/30/2015. Favorable markets shaded in green. Chicago(1) $.22 / $0.04 CGTLA(1) $(0.09) / $(0.08) Dom South(1) $(1.55) / $(1.05) TCO(1) $(0.18) / $(0.22) 12 Cove Point 4.85 Bcf/d Firm Gas Takeaway By YE 2018  4.85 Bcf/d natural gas FT portfolio by YE 2018 with 85% serving favorable markets and an average demand fee of $0.40/MMBtu YE 2018 Gas Market Mix AR 4.85 Bcf/d FT 43% Gulf Coast 16% Midwest 13% Atlantic Seaboard 12% Dom S/TETCO (PA) 15% TCO
  • 14. 13 HEDGING – INTEGRAL TO BUSINESS MODEL 1. 4Q 2015 – 4Q 2021 hedge gains based on current mark-to-market hedge gains. 2. Based on NYMEX strip as of 9/30/2015.  Hedging is a key component of Antero’s business model which includes development of a large, repeatable drilling inventory – Locks in higher returns in a low commodity price environment and reduces well payout thereby enhancing liquidity  Antero has realized $1.5 billion of gains on commodity hedges since 2009 – Gains realized in 26 of last 27 quarters, or 96% of the quarters since 2009 ● Based on Antero’s hedge position and strip pricing as of 9/30/2015(2), a further $2.8 billion in hedge gains are projected to be realized through the end of 2021 ● Significant additional hedge capacity remains under the credit facility hedging covenant for 2017 – 2021 period Quarterly Realized Hedge Gains / (Losses)(1) Realized Hedge Gains Projected Hedge Gains(2) NYMEX Natural Gas Historical Spot Prices ($/Mcf) NYMEX Natural Gas Futures Prices(2) 3.1 Tcfe Hedged at average price of $3.93/Mcfe through 2021 $2.8 Billion in Projected Hedge Gains Through 2021(1) Average Hedge Prices ($/Mcfe) $3.67 Realized $1.5 Billion in Hedge Gains Since 2009 $0.00 $1.00 $2.00 $3.00 $4.00 $5.00 $6.00 $0 $50 $100 $150 $200 $250 $MM $4.51 $3.94 $3.83 $4.06 $3.94 $3.75
  • 15. Liquid non-E&P assets of $5.5 Bn significantly exceeds total debt of $3.9 Bn Liquidity LIQUIDITY – STRONG BALANCE SHEET AND FLEXIBILITY Antero Resources (NYSE:AR) Antero Midstream (NYSE:AM) 9/30/2015 Debt Liquid Non-E&P Assets 9/30/2015 Debt Liquid Assets Debt Type $MM Credit facility $500 6.00% senior notes due 2020 525 5.375% senior notes due 2021 1,000 5.125% senior notes due 2022 1,100 5.625% senior notes due 2023 750 Total $3,875 Asset Type $MM Commodity derivatives(1) $2,842 AM equity ownership(2) 2,694 Cash 10 Total $5,546 Asset Type $MM Cash $10 Credit facility – commitments(3) 4,000 Credit facility – drawn (500) Credit facility – letters of credit (535) Total $2,975 Debt Type $MM Credit facility $525 Total $525 Asset Type $MM Cash $18 Total $18 Liquidity Asset Type $MM Cash $18 Credit facility – capacity(4) 1,500 Credit facility – drawn (525) Credit facility – letters of credit - Total $993 Approximately $3.0 billion of liquidity at AR plus an additional $2.7 billion of liquid AM units Approximately $1 billion of liquidity at AM 14 Only 35% of AM credit facility capacity drawn Note: All balance sheet data as of 9/30/2015, inclusive of water drop down and associated financing. 1. Mark-to-market as of 9/30/2015. 2. Based on AR ownership of AM units (116.9 million common and subordinated units) and AM’s closing price as of 10/23/2015. 3. AR credit facility commitments of $4.0 billion, borrowing base of $4.5 billion. 4. Credit facility increased to $1.5 billion upon water drop down – 3 new banks added to existing bank group of 17 banks.
  • 16. $3.99 $2.63 $2.46 $2.21 $2.02 $0.00 $0.50 $1.00 $1.50 $2.00 $2.50 $3.00 $3.50 $4.00 $4.50 AR Peer 1 Peer 2 Peer 3 Peer 4 $1.97 $1.30 $1.18 $1.17 $0.66 $0.58 $0.85 $0.72 $0.88 $0.75 $3.86 $2.33 $2.34 $2.55 $2.35 $0.00 $0.50 $1.00 $1.50 $2.00 $2.50 $3.00 $3.50 $4.00 $4.50 AR Peer 1 Peer 2 Peer 3 Peer 4 $/Mcfe Noncontrolling Interest of Midstream MLP EBITDA LOE Production Taxes GPT G&A EBITDAX 4-year Avg. All-in F&D Region 3Q 2015 % Sales Average NYMEX Price Average Differential(2) Average BTU Upgrade Hedge Effect Average 3Q 2015 Realized Gas Price(3) NYMEX Premium/ Discount TCO 41% $2.77 $(0.30) $0.22 $0.14 $2.83 $0.06 Dom South/TETCO 32% $2.77 $(1.63) $0.10 $0.77 $2.01 $(0.76) Gulf Coast(1) 7% $2.77 $(0.27) $0.22 $0.68 $3.40 $0.63 Chicago/Michigan 20% $2.77 $0.20 $0.18 $0.04 $3.19 $0.42 Total Wtd. Avg. 100% $2.77 $(0.62) $0.17 $1.67 $3.99 $1.22 1. Gulf Coast differential includes contractual deduct to NYMEX-based sales. 2. Includes firm sales. 3. Includes natural gas hedges. 4. Source: Public data from 3Q 2015 10-Qs. Peers include Cabot Oil & Gas, CONSOL Energy, EQT Corp. and Southwestern. 5. Includes realized hedge gains and losses. Operating costs include lease operating expenses, production taxes, gathering, processing and firm transport costs and general and administrative costs. 4-year proved reserve average all-in F&D from 2011-2014. Calculation = (Development costs + exploration costs + leasehold costs) / Total reserves added (2014 ending reserves – 2011 beginning reserves + 4-year reserve sales – 4-year reserve purchases + 4-year accumulated production). AR price realization includes $0.03 of midstream revenues; EBITDAX excludes AR’s midstream EBITDA not attributable to AR’s ownership. 15 REALIZATIONS – A LEADER IN REALIZATIONS & MARGINS AMONG LARGE-CAP APPALACHIAN PEERS 3Q 2015 Natural Gas Realizations(3)(4) 3Q 2015 Price Realization & EBITDAX Margin vs F&D(4)(5) ($/Mcfe)  Antero continues to be a leader in its peer group in price realizations and EBITDAX unit margins 3Q 2015 Natural Gas Realizations ($/Mcf) 3Q 2015 NYMEX = $2.77/Mcf
  • 17. DOM S 22% DOM S - 9% DOM S - 6% TETCO M2 - 7% TETCO M2 - 6% TCO 24% TCO 16% TCO - 9% NYMEX 8% NYMEX 11% NYMEX 10% Gulf Coast 18% Gulf Coast 38% Gulf Coast 56% Chicago 21% Chicago 20% Chicago 19% 0% 10% 20% 30% 40% 50% 60% 70% 80% 90% 100% ($/Mcf) 2015E NYMEX Strip Price(1) $3.09 Basis Differential to NYMEX(1) $(0.46) BTU Upgrade(5) $0.26 Estimated Realized Hedge Gains $1.35 Realized Gas Price with Hedges $4.24 Premium to NYMEX +$1.15 Liquids Impact +$0.39 Premium to NYMEX w/ Liquids +$1.54 Realized Gas-Equivalent Price $4.63 REALIZATIONS – REALIZED PRICE “ROAD MAP” Note: Hedge volumes as of 9/30/2015. 1. Based on 12/31/2014 strip pricing. 2. Differential represents contractual deduct to NYMEX-based firm sales contract. 3. Represents 120,000 MMBtu/d of TCO index hedges and 390,000 MMBtu/d of TCO basis hedges that are matched with NYMEX hedges for presentation purposes. 4. Represents 60,000 MMBtu/d of TCO index hedges and 130,000 MMBtu/d of TCO basis hedges that are matched with NYMEX hedges for presentation purposes. 5. Assumes ethane rejection resulting in 1100 BTU residue sales gas. 2015 Basis(1) 2016 Basis(1) 2017 Basis(1) 2015 Hedges 2016 Hedges 2017 Hedges Marketed%ofTargetResidueGasProduction +$0.05/MMBtu $(0.25)/MMBtu(2) $(1.28)/MMBtu $(0.24)/MMBtu $(0.07)/MMBtu $(0.25)/MMBtu(2) $(1.11)/MMBtu $(0.41)/MMBtu $(0.20)/MMBtu $(0.25)/MMBtu(2) $(0.83)/MMBtu $(0.50)/MMBtu $(0.09)/MMBtu $(0.07)/MMBtu 1,000,000 MMBtu/d @ $3.58/MMBtu 40,000 MMBtu/d @ $4.00/MMBtu 230,000 MMBtu/d @ $5.74/MMBtu 510,000 MMBtu/d @ $3.87/MMBtu(3) 170,000 MMBtu/d @ $4.09/MMBtu 272,500 MMBtu/d @ $5.35/MMBtu 190,000 MMBtu/d @ $3.66/MMBtu(4) 85% exposure to favorable price indices71% exposure to favorable price indices 94% exposure to favorable price indices  Antero’s exposure to favorable gas price indices like Chicago, Gulf Coast, NYMEX and TCO is expected to increase to 94% by 2017  Driven by expected in-service dates of regional gathering (4Q 2015) and Rover pipeline (1Q 2017) $(1.35)/MMBtu $(1.26)/MMBtu Wtd. Avg. Basis ($0.46) Wtd. Avg. Basis $(0.32) 1,160,000 MMBtu/d @ $4.34/MMBtu Wtd. Avg. Basis $(0.18) 1,612,500 MMBtu/d @ $3.92/MMBtu 420,000 MMBtu/d @ $4.27/MMBtu 2015E 2016E 2017E 16 380,000 MMBtu/d @ $3.88/MMBtu 980,000 MMBtu/d @ $3.49/MMBtu 70,000 MMBtu/d @ $4.57/MMBtu 1,490,000 MMBtu/d @ $3.82/MMBtu $(0.10)/MMBtu
  • 18. $52.07 $54.25 $52.61 $53.71 $46.23 $51.98 $16.10 $24.71 $94.10 $98.01 $93.03 $49.48 $0 $20 $40 $60 $80 $100 $120 AR NGL Pricing Mont Belvieu AR NGL Pricing Mont Belvieu AR NGL Pricing Mont Belvieu AR NGL Pricing Mont Belvieu 2012 2013 2014 2015E Realized NGL C3+ Price $0.63 $0.59 $0.47 $0.53 $0.10 $0.20 $0.30 $0.40 $0.50 $0.60 $0.70 0 5,000 10,000 15,000 20,000 25,000 30,000 4Q 2015 2016 Hedged Volume Average Hedge Price Strip (9/30/2015) REALIZATIONS – NGL REALIZATIONS AND PROPANE HEDGES 171. Based on 2015 NGL and WTI strip prices as of 9/30/2015, net of local transportation. 2. In ethane rejection, a minimal amount of ethane is produced and sold as propane. 3. 2015 NGL% of WTI of 33% represents midpoint of updated 2015 guidance. 4. As of 9/30/2015. Mark-to-market value for 2015 reflects 6 months of hedges from July through December. Realized NGL Prices as % of WTI(1) 2015E NGL Price Road Map(1) 0% 20% 40% 60% 80% 100% 2015E (% of Antero NGL Bbl) 57% Propane 11% Iso-Butane 15% Normal Butane 16% Natural Gasoline 1% Ethane 55% 54% 50% 33% ($/Bbl) ≈ 70% of 2015 NGL  Guidance Hedged NGL Marketing Propane Hedges Mark-to-Market Value(4) (Bbl/d) ($/Gal)  Realized NGL (C3+) price was 50% of WTI in 2014 and Antero is forecasting 30% to 35% of WTI for 2015 − YTD 2015 NGL realizations were 34% of WTI − Including propane hedges, first nine months of 2015 realizations were 40% of WTI  MarkWest is managing NGL volume growth in the northeast by moving 57% of the volumes out of the region, mostly by rail  Antero has hedged significant propane volumes in 2015 and 2016  By year-end 2016, Antero will market a significant portion of its NGL volumes out of Marcus Hook to export markets once Mariner East 2 is in service – 61,500 Bbl/d firm commitment with expansion rights $54 MM$15 MM (3) Wtd. Avg. Mont Belvieu NGL Strip (1) % of C3+ Price Per ($/gal) ($/Bbl) Barrel Barrel Ethane (2) $0.31 $12.86 1% $0.09 Propane $0.31 $12.86 57% $7.33 Iso-Butane $0.41 $17.33 11% $1.87 Normal Butane $0.41 $17.33 15% $2.60 Natural Gasoline $0.63 $26.41 16% $4.21 Wtd. Average NGL Barrel: $16.10 2015 WTI Strip (1) : $49.48 NGL Barrel as %of WTI: 33% (3)
  • 19. NORTHEAST NGLS ARE TRANSPORTATION CHALLENGED 1. As an anchor shipper on Mariner East 2, Antero has the right to expand its NGL commitment with notice to operator. 2. 2015 NGL production assumes ethane rejection. Mariner East 2 61,500 Bbl/d AR Commitment(1) 4Q 2016 In-Service  Not so much a supply problem but more of a logistics problem for NGLs in the northeast today − The majority of northeast NGL production is being transported by expensive rail and trucking − NGLs that are transported “to the water” are also faced with high shipping rates Export 15% Gulf Coast 13% Mid- Atlantic 6% Sarnia 3% Northeast 43% Midwest 10% Edmonton 10% 2015 NGL Marketing by Region 18
  • 20. NORTHEAST NGL GROWTH IS SUPPORTED BY INCREASING TAKEAWAY OPTIONS 1. Chart 10 per BAML research dated 6/5/2015. Pipeline volumes are capacity estimates. Industry NGL Pipelines – Actual (2015) and Projected(1) 19 Shell Beaver County Cracker (Pending FID YE’15) Mariner East 2 62 MBbl/d Commitment Marcus Hook Export AR Has Doubling Rights Gulf Coast Critical to NGL Pricing Appalachia  NGL transportation rates are expected to decline $0.12 to $0.15 per gallon by 2017 as pipeline options to domestic markets and export terminals go in-service (Mariner East 1 and 2, for example) (MMBbl/d)
  • 21. $0.00 $0.10 $0.20 $0.30 $0.40 $0.50 $/Gallon Baltic Exchange LPG Freight Futures Baltic LPG Rate ($/gal) Marcus Hook to Europe ($/gal) Marcus Hook to Far East ($/gal) U.S. EXPORTS ARE SUPPORTED BY EXCESS DOCK CAPACITY AND FLEET GROWTH 0 200 400 600 800 1,000 1,200 1,400 1,600 1,800 2009 2010 2011 2012 2013 2014 2015 2016 2017 2018 2019 2020 2021 2022 2023 2024 2025 MBbl/d Butane Exports Propane Exports Total Export Capacity Excess LPG Export Terminal Capacity vs. Expected Export Volumes(1) Excess dock capacity supports growing LPG export volumes through 2025 Fleet Growth Supports U.S. LPG Export Growth(2) LPG Freight Futures Show Declining Freight Costs(3) Baltic LPG shipping cost declines from $0.14/gal to $0.09-$0.10/gal in early 2017 on fleet supply growth numbers Projected growth in VLGC fleet supports increasing LPG export volumes and lower shipping costs 1. Source: Bentek. 2. Source: Poten & Partners, August 2015. 3. Baltic Rate based on 9/30/2015 Baltic Futures converted to cost per gallon of LPGs, assuming 75/25 propane/butane.  LPG transportation rates from northeast fractionation to Europe and Asia should improve by $0.05 to $0.15 per gallon by YE 2016, driven both by pipelines replacing rail and by lower shipping costs Excess Dock Capacity Current Fleet 168 New builds +85 20
  • 22. POSITIVE OUTLOOK FOR LONG-TERM NGL MARKETS Steady Global LPG Demand Growth Through 2035(1) 1. Source: PIRA NGL Study, September 2015. 2. Source: IHS, Waterborne, SK Gas Analysis; Wood Mackenzie; Wood Mackenzie; PDH C3 capacity based on 25 MBbl/d = 650 Mt/y. Multiple Factors Driving Global LPG Demand Growth Through 2020(2) MMBbl/d 0.0 0.33 0.67  Forecast global LPG demand growth of 800 MBbl/d to 1 MMBbl/d by 2020 to be driven by petrochem projects in Asia and Middle East as well as residential/commercial, alkylate and power generation demand − Naphtha cracker conversion to LPG another potential demand driver that has not yet been factored into analyst estimates ≈1 MMBbl/d China Korea Haiwei (2016) - 21 MBbl/d C3 SK Advanced (2016) - 27 MBbl/d C3 Ningbo Fuji (2016) - 29 MBbl/d C3 Fujian Meide (2016) - 29 MBbl/d C3 Tianjin Bohua 2 (2018) - 29 MBbl/d C3 United States Fujian Meide 2 (2018) - 29 MBbl/d C3 Enterprise (3Q 2016) - 29 MBbl/d C3 Oriental Tangshan (2019) - 25 MBbl/d C3 Formosa (2017) - 25 MBbl/d C3 Firm and Likely PDH Underway (By 2020) Total - 243 MBbl/d C3 Million Tons, Global PDH Capacity 1990 2000 2010 2020 20 10 0 21 14.7 13.0 11.4 9.8 8.2 6.5 4.9 3.3 1.7 U.S. Driven Global LPG Supply Through 2035(1) MMBbl/d MMBbl/d 1.3 1.0 0.7 0.3 -0.3
  • 23. Downstream LNG and NGL Sales Production and Cash Flow Growth 22 Antero recently drilled and cased its first Utica dry gas well; has 186,000 net acres in WV and PA prospective for Utica dry gas – adjacent to current industry activity with highly encouraging initial results CATALYSTS 40%+ production growth guidance for 2015 with 94% hedged at $4.51/MMBtu; targeting 25% to 30% production growth in 2016 with 98% to 102% hedged at $3.94/MMBtu; capital budget flexibility to commodity price changes Large, low unit cost core Marcellus and Utica natural gas drilling inventory with associated liquids generates attractive returns supported by long-term natural gas hedges, takeaway portfolio and downstream LNG and NGL sales agreements Pursuing additional value enhancing long-term LNG and NGL sales agreements, as well as additional NGL firm takeaway Antero owns 67% of Antero Midstream Partners and thereby participates directly in its growth and value creation; acquisition of integrated water business from Antero expected to result in distributable cash flow per unit accretion in 2016 Midstream MLP Growth Sustainability of Antero’s Integrated Business Model 1 2 3 5 4 Utica Dry Gas Activity
  • 24. - 100 200 300 400 500 600 Core Net Acres - Dry Core Net Acres - Liquids-Rich Largest Liquids-Rich Core Position in Appalachia 0 2,000 4,000 6,000 8,000 10,000 12,000 14,000 Largest Proved Reserve Base in Appalachia LEADERSHIP IN APPALACHIAN BASIN Top Producers in Appalachia (Net MMcfe/d) – 2Q 2015(1)(2) Top 12 U.S. Natural Gas Producers (Net MMcf/d) – 2Q 2015(1) Appalachian Producers by Proved Reserves (Bcfe) – YE 2014(1)(2)Appalachian Producers by Core Net Acres (000’s) – August 2015(3)(4) 1. Based on company filings and presentations. 2. Appalachian only production and reserves where available. Excludes companies that do not break out Appalachian production including CHK, CVX, HES and XOM. 3. Based on Antero geologic interpretation supported by state well data, company presentations and public land data. Peer group includes AEP, CHK, CNX, COG, CVX, EQT, NBL, RICE, RRC, STO, SWN. 4. Southwestern leasehold and reserves include the impact from STO and WPX property acquisitions closed in January 2015. 5. Includes proved reserves categorized in “Northern Division” consisting of Utica Shale, Marcellus Shale and Powder River Basin. 0 200 400 600 800 1,000 1,200 1,400 1,600 1,800 0 500 1,000 1,500 2,000 2,500 3,000 3,500 Appalachian Peers 11th Largest U.S. Gas Producer 23 3rd Largest Appalachian Producer  Antero has the largest proved reserve base, the largest core liquids-rich acreage position and is one of the largest producers in the Appalachian Basin
  • 26. 248 139 94 254 289 15% 38% 47% 35% 40% 11% 29% 38% 28% 32% 0 100 200 300 0% 15% 30% 45% 60% Condensate Highly-Rich Gas/ Condensate Highly-Rich Gas Rich Gas Dry Gas Total3PLocations ROR Total 3P Locations ROR @ 6/30/2015 Strip-Spot ROR @ 6/30/2015 Strip-Current 664 1,010 628 889 45% 31% 14% 16% 38% 26% 10% 13% 0 500 1,000 1,500 0% 15% 30% 45% 60% Highly-Rich Gas/ Condensate Highly-Rich Gas Rich Gas Dry Gas Total3PLocations ROR Total 3P Locations ROR @ 6/30/2015 Strip-Spot ROR @ 6/30/2015 Strip-Current MARCELLUS WELL ECONOMICS(1) WELL COST REDUCTIONS SUPPORT SUSTAINABLE BUSINESS MODEL Marcellus Well Cost Improvement(2) 1. 6/30/2015 pre-tax well economics based on a 9,000’ lateral, 6/30/2015 natural gas and WTI strip pricing for 2015-2024, flat thereafter, NGLs at 32.5% of WTI for 2015–2016 and 50% of WTI thereafter, and applicable firm transportation and operating costs . Well cost estimates include $1.2 million assumed for road, pad and production facilities. Current well costs include legacy contracts. Spot well costs are adjusted for current market drilling and completion rates resulting in a $1.2 million cost saving vs. current well costs. Antero will begin to realize spot well costs as the company utilizes incremental completion crews for deferred completions beginning at year end 2015 and as existing drilling rig contracts begin to roll off during 2016. 2. 2015E well costs based on $10.3 million for a 9,000’ lateral Marcellus well and $11.6 million for a 9,000’ lateral Utica well. 25 UTICA WELL ECONOMICS(1)  72% of Marcellus locations are processable (1100-plus Btu)  72% of Utica locations are processable (1100-plus Btu) 2015 Drilling Plan  Antero has reduced average well costs for a 9,000’ lateral by 16% in the Marcellus and 18% in the Utica as compared to 2014 well costs, through a combination of service cost reductions and drilling and completion efficiencies − Well economics on some wells expected to improve further starting in early 2016 as the Company utilizes incremental market based contracts for drilling and completion operations which is expected to reduce well costs by another 10 to 12% over time Utica Well Cost Improvement(2) $1.357 $1.144 $0.000 $0.500 $1.000 $1.500 $2.000 2014 2015E $MM/1,000’Lateral Well Cost ($MM/1,000') 16% Decrease vs. 2014 $1.571 $1.289 $0.000 $0.500 $1.000 $1.500 $2.000 2014 2015E $MM/1,000’Lateral Well Cost ($MM/1,000') 18% Decrease vs. 2014
  • 27. WORLD CLASS MARCELLUS SHALE DEVELOPMENT PROJECT 100% operated Operating 6 drilling rigs including 1 intermediate rigs 418,000 net acres in Southwestern Core (74% includes processable rich gas assuming an 1100 Btu cutoff) – 52% HBP with additional 24% not expiring for 5+ years 419 horizontal wells completed and online – Laterals average 7,500’ – 100% drilling success rate 6 plants in-service at Sherwood Processing Complex capable of processing in excess of 1.2 Bcf/d of rich gas − Over 900 MMcf/d of Antero gas being processed currently Net production of 1,140 MMcfe/d in 3Q 2015, including 33,000 Bbl/d of liquids 3,191 future drilling locations in the Marcellus (2,302 or 72% are processable rich gas) 28.4 Tcfe of net 3P (17% liquids), includes 11.9 Tcfe of proved reserves (assuming ethane rejection) Highly-Rich Gas 137,000 Net Acres 1,010 Gross Locations Rich Gas 90,000 Net Acres 628 Gross Locations Dry Gas 107,000 Net Acres 889 Gross Locations Highly-Rich/Condensate 84,000 Net Acres 664 Gross Locations HEFLIN UNIT 30-Day Rate 2H: 21.4 MMcfe/d (20% liquids) CONSTABLE UNIT 30-Day Rate 1H: 14.3 MMcfe/d (25% liquids) 142 Horizontals Completed 30-Day Rate 8.1 MMcf/d 6,915’ average lateral length Sherwood Processing Complex Source: Company presentations and press releases. Antero acreage position reflects tax districts in which greater than 3,000 net acres are held. Note: Rates in ethane rejection. NERO UNIT 30-Day Rate 1H: 18.2 MMcfe/d (27% liquids) BEE LEWIS PAD 30-Day Rate 4-well combined 30-Day Rate of 67 MMcfe/d (26% liquids) RJ SMITH PAD 30-Day Rate 4-well combined 30-Day Rate of 56 MMcfe/d (21% liquids) 26 HENDERSHOT UNIT 30-Day Rate 1H: 16.3 MMcfe/d 2H: 18.1 MMcfe/d (29% liquids) HORNET UNIT 30-Day Rate 1H: 21.5 MMcfe/d 2H: 17.2 MMcfe/d (26% liquids) CARR UNIT 30-Day Rate 2H: 20.6 MMcfe/d (20% liquids) WAGNER PAD 30-Day Rate 4-well combined 30-Day Rate of 59 MMcfe/d (14% liquids)
  • 28. Antero’s Marcellus well performance has continued to improve over time with a tight statistical range of results across its entire acreage position PROLIFIC PREDICTABLE RESULTS ACROSS ENTIRE MARCELLUS POSITION 27 Marcellus PDP Locations (As of 6/30/2015) (1) 1. Source: IHS; 3rd party producing wells include Consol, EQT, Exxon/XTO, Noble, AEP, PDC, Magnum Hunter, Statoil, Chesapeake / SWN. >1275 BTU 2.2 Bcfe/1,000’ Lateral 7 SSL Wells 1200-1275 BTU 2.0 Bcfe/1,000’ Lateral 99 SSL Wells 1100-1200 BTU 1.8 Bcfe/1,000’ Lateral 110 SSL Wells Average Antero Marcellus Well 2014 Actual 2H 2015 Budget 30-Day Rate (MMcfe/d): 13.1 16.1 Gross EUR (Bcfe): 15.3 19.2 Gross Well Cost ($MM): $11.8 $10.3 Lateral Length (Feet): 8,052 9,000 Net F&D ($/Mcfe): $0.89 $0.63 Btu: 1195 1250
  • 29. 0 5 10 15 20 25 30 1.3 1.4 1.5 1.6 1.7 1.8 1.9 2 2.1 2.2 2.3 2.4 2.5 2.6 2.7 More WellCount Bcfe/1,000' of Lateral 0 5 10 15 20 25 30 MMcfe/d  Antero’s Marcellus average 30-day rates have increased by 67% over the past two years as the Company increased per well lateral lengths by 12% and shortened stage lengths by 45% compared to 1H 2013 INCREASING RECOVERIES AND LOW VARIANCE IN MARCELLUS 1. Processed rates converting C3+ NGLs and condensate at 6:1. Ethane rejected and sold in gas stream. Antero 30-Day Rates – 415 Marcellus Wells(1) 28 Antero SSL Reserves per 1,000’ of Lateral – 223 Marcellus SSL Wells 2014 – 13.0 MMcfe/d 2013 – 9.4 MMcfe/d 2009–2012 – 8.0 MMcfe/d  The Marcellus is a reliable, low risk play as demonstrated by the tight distribution of EURs per 1,000’ and the P10/P90 ratio of only 1.7x for 223 SSL wells P10: 2.35 Bcfe/1,000’ P90: 1.42 Bcfe/1,000’ P10/P90: 1.7x P90 P10 2015 YTD – 14.4 MMcfe/d
  • 30. 411 420 361 283 200 200 14 16 21 27 40 45 - 5 10 15 20 25 30 35 40 45 50 - 50 100 150 200 250 300 350 400 450 2010 2011 2012 2013 2014 2015E AverageFracStagesperWell AverageStageLength(Feet) Increasing Frac Stages per Well Average Stage Length (Feet) Average Frac Stages per Well (1) 1.5 1.6 1.5 1.6 2.0 $0.97 $0.89 $0.98 $1.13 $0.89 $0.00 $0.20 $0.40 $0.60 $0.80 $1.00 $1.20 0.00 0.50 1.00 1.50 2.00 2.50 2010 2011 2012 2013 2014 DevelopmentCost($/Mcfe) EUR/1,000'Lateral(Bcfe) EUR vs. Development Cost per Unit EUR/1,000' Lateral (Bcfe) Development Cost ($/Mcfe) 29 MARCELLUS WELL PERFORMANCE IMPROVEMENTS  Increasing recoveries and efficiencies, through longer laterals, shorter stage lengths and faster drilling  SSL completions drove a 21% decline in development costs in 2014 while lower service costs and efficiencies are driving further development cost reductions in 2015 1. 2015 reflects Antero guidance per 1/20/2015 press release. 5,732 6,717 7,345 7,308 8,052 9,000 19 38 59 103 136 80 0 20 40 60 80 100 120 140 160 0 2,000 4,000 6,000 8,000 10,000 2010 2011 2012 2013 2014 2015E WellsonFirstSales LateralLength(Feet) Increasing Lateral Lengths Average Lateral Length (Feet) Wells on First Sales (1) 37 36 34 32 29 13,181 14,067 14,658 14,607 15,355 - 4,000 8,000 12,000 16,000 20,000 0 10 20 30 40 50 2010 2011 2012 2013 2014 TotalMeasuredDepth(Feet) Spud-to-SpudDays Increasing Drilling Efficiency Avg Spud-to-Spud Days Total Measured Depth (Feet)
  • 31. Note: Antero acreage position reflects townships in which greater than 3,000 net acres are held. Antero 30-day rates in ethane rejection. 1. 30-day rate reflects restricted choke regime.  100% operated  Operating 4 drilling rigs  147,000 net acres in the core rich gas/ condensate window (73% includes processable rich gas assuming an 1100 Btu cutoff) – 27% HBP with additional 63% not expiring for 5+ years  93 operated horizontal wells completed and online in Antero core areas − 100% drilling success rate  4 plants at Seneca Processing Complex capable of processing 800 MMcf/d of rich gas − Over 500 MMcf/d being processed currently, including third party production  Net production of 366 MMcfe/d in 3Q 2015 including 19,250 Bbl/d of liquids  Fifth party compressor station in-service September 2015 with a capacity of 120 MMcf/d  1,024 future gross drilling locations (735 or 72% are processable gas)  7.6 Tcfe of net 3P (15% liquids), includes 758 Bcfe of proved reserves (assuming ethane rejection) WORLD CLASS OHIO UTICA SHALE DEVELOPMENT PROJECT 30 Cadiz Processing Plant NORMAN UNIT 30-Day Rate 2 wells average 16.8 MMcfe/d (15% liquids) RUBEL UNIT 30-Day Rate 3 wells average 17.2 MMcfe/d (20% liquids) Utica Core Area GARY UNIT 30-Day Rate 3 wells average 24.2 MMcfe/d (21% liquids) Highly-Rich/Cond 28,000 Net Acres 139 Gross Locations Highly-Rich Gas 12,000 Net Acres 94 Gross Locations Rich Gas 31,000 Net Acres 254 Gross Locations Dry Gas 40,000 Net Acres 289 Gross Locations NEUHART UNIT 3H 30-Day Rate 16.2 MMcfe/d (57% liquids) Condensate 36,000 Net Acres 248 Gross Locations DOLLISON UNIT 1H 30-Day Rate 19.8 MMcfe/d (40% liquids) MYRON UNIT 1H 30-Day Rate 26.8 MMcfe/d (52% liquids) Seneca Processing Complex LAW UNIT 30-Day Rate 2 wells average 16.1 MMcfe/d (50% liquids) SCHAFER UNIT 30-Day Rate(1) 2 wells average 14.2 MMcfe/d (49% liquids) URBAN PAD 30-Day Rate 4 wells average 18.8 MMcfe/d (15% liquids) GRAVES UNIT 500’ Density Pilot 30-Day Rate 4 wells average 15.5 MMcfe/d (24% liquids) FRANKLIN UNIT 30-Day Rate 3 wells average 17.6 MMcfe/d (16% liquids) FRAKES UNIT 30-Day Rate 2 wells average 18.6 MMcfe/d (42% liquids)
  • 32. 1.4 1.6 $1.64 $1.24 $0.00 $0.30 $0.60 $0.90 $1.20 $1.50 $1.80 0.00 0.20 0.40 0.60 0.80 1.00 1.20 1.40 1.60 2013 2014 DevelopmentCost($/Mcfe) EUR/1,000'Lateral(Bcfe) EUR vs. Development Cost per Unit EUR/1,000' Lateral (Bcfe) Development Cost ($/Mcfe) 31 OHIO UTICA WELL PERFORMANCE IMPROVEMENTS  Increasing recoveries and efficiencies through longer laterals, shorter stage lengths and faster drilling  Lower service costs and efficiencies, and focus on liquids-rich locations, driving development cost reductions in 2015 1. 2015 reflects Antero guidance per 1/20/2015 press release. 6,431 8,021 9,000 11 41 50 0 10 20 30 40 50 60 0 2,000 4,000 6,000 8,000 10,000 2013 2014 2015E WellsonFirstSales LateralLength(Feet) Increasing Lateral Lengths Average Lateral Length Wells on First Sales (1) 289 183 175 26 47 51 - 10 20 30 40 50 60 - 50 100 150 200 250 300 350 2013 2014 2015E AverageFracStagesperWell AverageStageLength(Feet) Increasing Frac Stages per Well Average Stage Length (Feet) Average Frac Stages per Well (1) 32 29 14,643 16,321 - 3,000 6,000 9,000 12,000 15,000 18,000 0 10 20 30 40 2013 2014 TotalMeasuredDepth(Feet) Spud-to-SpudDays Increasing Drilling Efficiency Spud-to-Spud Days Total Measured Depth (Feet)
  • 33. LARGE UTICA SHALE DRY GAS POSITION 32  Antero has the right to build gathering and compression infrastructure to move Antero’s future dry gas Utica production − AM pro forma water business would also serve Antero’s dry gas Utica development  Antero spud its first dry gas Utica well in 3Q 2015  Antero has 226,000 net acres of exposure to Utica dry gas play  Other operators have reported strong Utica Shale dry gas results including the following wells: Chesapeake Hubbard BRK #3H 3,550’ Lateral IP 11.1 MMcf/d Hess Porterfield 1H-17 5,000’ Lateral IP 17.2 MMcf/d Gulfport Irons #1-4H 5,714’ Lateral IP 30.3 MMcf/d Eclipse Tippens #6H 5,858’ Lateral IP 23.2 MMcf/d Magnum Hunter Stalder #3UH 5,050’ Lateral IP 32.5 MMcf/d Antero Utica Well Drilling Well Operator 24-hr IP (MMcf/d) Lateral Length (Ft) IP/1,000’ Lateral (MMcf/d) Scotts Run EQT 72.9 3,221 22.633 Gaut 4IH CNX 61.0 5,840 11.131 CSC #11H RRC 59.0 5,420 10.886 Stewart-Win 1300U MHR 46.5 5,289 8.792 Bigfoot 9H RICE 41.7 6,957 5.994 Blank U-7H GST 36.8 6,617 5.561 Stalder #3UH MHR 32.5 5,050 6.436 Irons #1-4H GPOR 30.3 5,714 5.303 Pribble 6HU SGY 30.0 3,605 8.322 Simms U-5H GST 29.4 4,447 6.611 Conner 6H CVX 25.0 6,451 3.875 Messenger 3H SWN 25.0 5,889 4.245 Tippens #6H ECR 23.2 5,858 3.960 Porterfield 1H-17 HESS 17.2 5,000 3.440 1. Antero acreage position reflects tax districts in which greater than 3,000 net acres are held in OH, WV and PA. Magnum Hunter Stewart Winland 1300U 5,289’ Lateral IP 46.5 MMcf/d Range Claysville SC #11H 5,420’ Lateral IP 59.0 MMcf/d Chevron Conner 6H 6,451’ Lateral IP 25.0 MMcf/d Gastar Simms U-5H 4,447’ Lateral IP 29.4 MMcf/d Utica Shale Dry Gas Acreage in OH/WV/PA(1) Rice Bigfoot 9H 6,957’ Lateral IP 41.7 MMcf/d AR Utica Shale Dry Gas WV/PA Net Resource 12.5 to 16 Tcf 1,889 Gross Locations 186,000 Net Acres AR Utica Shale Dry Gas Ohio 3P Reserves 2.4 Tcf 289 Gross Locations 40,000 Net Acres AR Utica Shale Dry Gas Total OH/WV/PA Net Resource 14.9 to 18.4 Tcf 2,178 Gross Locations 226,000 Net Acres Stone Energy Pribble 6HU 3,605’ Lateral IP 30.0 MMcf/d Southwestern Messenger 3H 5,889’ Lateral IP 25.0 MMcf/d Rice Blue Thunder 10H, 12H ≈9,000’ Lateral Gastar Blake U-7H 6,617’ Lateral IP 36.8 MMcf/d EQT Scotts Run 3,221’ Lateral IP 72.9 MMcf/d CNX Gaut 4IH 5,840’ Lateral IP 61.0 MMcf/d
  • 34. ANTERO’S FIRST UTICA DRY GAS WELL 33  Dry gas fairway extends from the Antero Utica acreage in eastern Ohio to the Antero Marcellus play acreage in northern West Virginia  186,000 net acres in West Virginia and Pennsylvania with net resource of 12.5 to 16 Tcf as of 9/30/2015 (not included in 40.7 Tcfe of net 3P reserves) − 1,889 locations underlying current Marcellus Shale leasehold in West Virginia and Pennsylvania  Antero recently drilled and cased its first dry gas Utica well in Tyler County, WV with results expected in 4Q 2015 (Rymer 4HD) − 6,400’ planned lateral length − 100% working interest  40,000 net acres in Ohio with net 3P reserves of 2.4 Tcf as of 12/31/2014 − 289 locations in Ohio  In total, Antero has 226,000 net acres and 2,178 potential locations in the Point Pleasant high pressure, high porosity dry gas fairway in OH, WV and PA − 10,000’ to 14,500’ TVD − Density log porosity values average > 8.5% − 120’ to 130’ total thickness − 25 MMcf/d to 73 MMcf/d industry 24-hr IP flow rates − 1000 to 1040 BTU expected NOTE: Wellbore diagram for illustrative purposes only. Targeted Pay Zone IP / 1,000’ Lateral (MMcf/d) 5.0 – 10.0 10.0 – 15.0 15.0 – 25.0 Gulfport Irons #1-4H 5,714’ Lateral IP/1,000’: 5.3 MMcf/d Range Claysville SC #11H 5,420’ Lateral IP/1,000’: 10.9 MMcf/d CNX Gaut 4IH 5,840’ Lateral IP/1,000’: 10.4 MMcf/d EQT Scotts Run 3,221’ Lateral IP/1,000’: 22.6 MMcf/d Gastar Blake U-7H 6,617’ Lateral IP/1,000’: 5.6 MMcf/d Gastar Sims U-5H 4,447’ Lateral IP/1,000’: 6.6 MMcf/d Stone Energy Pribble 6HU 3,605’ Lateral IP/1,000’: 8.3 MMcf/d Magnum Hunter Stalder #3UH 5,050’ Lateral IP/1,000’: 6.4 MMcf/d Magnum Hunter Stewart Winland 1300U 5,280’ Lateral IP/1,000’: 8.8 MMcf/d Antero Utica Well Drilling Rymer 4HD Utica Dry Gas Fairway
  • 35. - 500,000 1,000,000 1,500,000 2,000,000 2,500,000 3,000,000 3,500,000 4,000,000 4,500,000 5,000,000 FIRM TRANSPORTATION AND FIRM SALES PORTFOLIO 34 MMBtu/d Columbia 7/26/2009 – 9/30/2025 Firm Sales #1 10/1/2011– 10/31/2019 Firm Sales #2 10/1/2011 – 5/31/2017 Firm Sales #3 1/1/2013 – 5/31/2022 Momentum III 9/1/2012 – 12/31/2023 EQT 8/1/2012 – 6/30/2025 REX/MGT/ANR 7/1/2014 – 12/31/2034 Tennessee 11/1/2015– 9/30/2030 (WGL) Mid-Atlantic/NYMEX (Tennessee) Gulf Coast (TCO) Appalachia or Gulf Coast Appalachia Appalachia ANR 3/1/2015– 2/28/2045 (REX/ANR/NGPL/MGT) Midwest Local Distribution 11/1/2015 – 9/30/2037 (ANR) Gulf Coast Antero Transportation Portfolio 1,280 BBtu/d 790 BBtu/d 375 BBtu/d 250 BBtu/d 800 BBtu/d 600 BBtu/d 630 BBtu/d 40 BBtu/d 80 BBtu/d
  • 36. Keys to Execution Local Presence  Antero has more than 3,500 employees and contract personnel working full-time for Antero in West Virginia. 79% of these personnel are West Virginia residents.  District office in Marietta, OH  District office in Bridgeport, WV  237 (49%) of Antero’s 482 employees are located in West Virginia and Ohio Safety & Environmental  Five company safety representatives and 57 safety consultants cover all material field operations 24/7 including drilling, completion, construction and pipelining  37 person environmental staff plus outside consultants monitor all operations and perform baseline water well testing Central Fresh Water System & Water Recycling  Numerous sources of water – built central water system to source fresh water for completions  Antero recycled over 74% of its flowback and produced water through 2014  Antero Midstream building 60,000 Bbl/d advanced wastewater treatment facility (in-service 4Q 2017) Natural Gas Vehicles (NGV)  Antero supported the first natural gas fueling station in West Virginia  Antero has 30 NGV trucks and plans to continue to convert its truck fleet to NGV Pad Impact Mitigation  Closed loop mud system – no mud pits  Protective liners or mats on all well pads in addition to berms Natural Gas Powered Drilling Rigs & Frac Equipment  8 of Antero’s contracted drilling rigs are currently running on natural gas  First natural gas powered clean fleet frac crew began operations summer 2014 Green Completion Units  All Antero well completions use green completion units for completion flowback, essentially eliminating methane emissions (full compliance with EPA 2015 requirements) LEED Gold Headquarters Building  Corporate headquarters in Denver, Colorado LEED Gold Certified HEALTH, SAFETY, ENVIRONMENT & COMMUNITY Antero Core Values: Protect Our People, Communities And The Environment Strong West Virginia Presence  79% of all Antero Marcellus employees and contract workers are West Virginia residents  Antero named Business of the Year for 2013 in Harrison County, West Virginia “For outstanding corporate citizenship and community involvement”  Antero representatives recently participated in a ribbon cutting with the Governor of West Virginia for the grand opening of the first natural gas fueling station in the state; Antero supported the station with volume commitments for its NGV truck fleet 35
  • 37. CLEAN FLEET & CNG TECHNOLOGY LEADER ● Antero has contracted for two clean completion fleets to enhance the economics of its completion operations and reduce the environmental impact ● Replaces diesel engines (for pressure pumping) with electric motors powered by natural gas-fired electric generators ● A clean fleet allows Antero to fuel part of its completion operations from field gas instead of more expensive diesel fuel. Benefits of using a clean fleet include: − Reduce fuel costs by up to 80% representing cost savings of up to $40,000/day − Reduces NOx and CO emissions by 99% − Eliminates 25 diesel truckloads from the roads for an average well completion − Reduces silica dust to levels 90% below OSHA permissible exposure limits resulting in a safer and cleaner work environment − Significantly reduces noise pollution from a well site − Is the most environmentally responsible completion solution in the oil and gas industry • Additionally, Antero utilizes compressed natural gas (CNG) to fuel its truck fleet in Appalachia − Antero supported the first natural gas fueling station in West Virginia − Antero has 30 NGV trucks and plans to continue to convert its truck fleet to NGV 36
  • 38. 37 Antero Midstream (NYSE: AM) Asset Overview
  • 39. Regional Gas Pipelines Miles Capacity In-Service Regional Gathering Pipeline(2) 50 1.4 Bcf/d 4Q 2015 381. Acquired by AM from AR for a $1.05 billion upfront payment and a $125 million earn out in each of 2019 and 2020. 2. AM holds option to purchase 15% of regional gathering pipeline at cost plus cost of carry. End Users End Users Gas Processing Y-Grade Pipeline Long-Haul Interstate Pipeline Inter Connect NGL Product Pipelines Fractionation Compression Low Pressure Gathering Well Pad Terminals and Storage (Miles) YE 2014 YE 2015E Marcellus 91 108 Utica 45 56 Total 136 164 AM has option to participate in processing, fractionation, terminaling and storage projects offered to AR (Miles) YE 2014 YE 2015E Marcellus 62 76 Utica 35 36 Total 97 112 (MMcf/d) YE 2014 YE 2015E Marcellus 375 800 Utica 0 120 Total 375 920 AM Owned Assets Condensate Gathering Stabilization (Miles) YE 2014 YE 2015E Utica 16 19 End Users AM Option Assets (Ethane, Propane, Butane, etc.) AM’S FULL VALUE CHAIN BUSINESS MODEL Water Drop Down Completed
  • 40. 1. Represents inception to date actuals as of 12/31/2014 and 2015 midpoint guidance. 2. Pro forma for water drop down. Includes $15.0 million of maintenance capex at 2015 midpoint guidance. 39 Utica Shale Marcellus Shale Projected Midstream Infrastructure(1) Marcellus Shale Utica Shale Total YE 2014 Cumulative Gathering/ Compression Capex ($MM) $836 $345 $1,181 Gathering Pipelines (Miles) 153 80 233 Compression Capacity (MMcf/d) 375 - 375 Condensate Gathering Pipelines (Miles) - 16 16 2015E Capex Budget ($MM)(2) $256 $182 $438 Gathering Pipelines (Miles) 31 12 43 Compression Capacity (MMcf/d) 425 120 545 Condensate Gathering Pipelines (Miles) - 3 3 Midstream Assets ANTERO MIDSTREAM ASSET OVERVIEW • Gathering and compression assets in core of rapidly growing Marcellus and Utica Shale plays – Acreage dedication of ~434,000 net leasehold acres for gathering and compression services – Additional stacked pay potential with dedication on 186,000 acres of Utica deep rights underlying the Marcellus in WV and PA – 100% fixed fee long term contracts • AR owns 67% of AM units (NYSE: AM) pro forma
  • 41. ANTERO INTEGRATED WATER BUSINESS 40 Marcellus Fresh Water System(2) • Provides fresh water to support Marcellus well completions • Year-round water supply sources: Ohio River and local rivers • Ozone Water treatment facility to be in-service by 3Q 2015 • Significant asset growth in 2015 as summarized below: Note: Antero acreage position reflects tax districts in which greater than 3,000 net acres are owned. 1. Represents inception to date actuals as of 06/30/2015 and 2015 guidance. 2. All Antero water withdrawal sites are fully permitted under long-term state regulatory permits both in WV and OH. 3. Assumes fee of $3.685 per barrel subject to annual inflation and 250,000 barrels of water per well that utilize the fresh water delivery system based on 9,000 foot lateral. Operating margin excludes G&A. 4. Assumes fee of $3.635 per barrel subject to annual inflation and 275,000 barrels of water per well that utilize the fresh water delivery system based on 9,000 foot lateral. Operating margin excludes G&A. Utica Fresh Water System(2) • Provides fresh water to support Utica well completions • Year-round water supply sources: local reservoirs and rivers • Significant asset growth in 2015 as summarized below: Marcellus Water System YE 2014 YE 2015E Water Pipeline (Miles) 177 226 Fresh Water Storage Impoundments 22 24 Cash Operating Margin per Well ($)(3) $700K - $750K Utica Water System YE 2014 YE 2015E Water Pipeline (Miles) 61 90 Fresh Water Storage Impoundments 8 14 Cash Operating Margin per Well ($)(4) $775K - $825K Projected Fresh Water Delivery Infrastructure(1) Marcellus Shale Utica Shale Total YE 2015E Cumulative Water System Capex ($MM) $340 $113 $453 Water Pipelines (Miles) 226 90 316 Water Storage Facilities 24 14 38  AM has acquired AR’s integrated water business for $1.05 billion plus earn out payments of $125 million at year-end in each of 2019 and 2020 − The acquired business includes Antero’s Marcellus and Utica freshwater delivery business, the fully-contracted future advanced wastewater treatment complex and all fluid handling and disposal services for Antero Antero advanced wastewater treatment facility to be constructed – connects to Antero freshwater delivery system
  • 42. 0 10,000 20,000 30,000 40,000 50,000 60,000 70,000 80,000 Antero Clearwater Advanced Wastewater Treatment Capacity (Bbl/d) Produced/Flowback Volumes (Bbl/d) ADVANCED WASTEWATER TREATMENT Illustrative Produced & Flowback Water VolumesAdvanced Wastewater Treatment Antero Produced Water Services and Freshwater Delivery Business Antero Advanced Wastewater Treatment 3rd Party Recycling and Well Disposal (Bbl/d) Advanced Wastewater Treatment Complex Estimated capital expenditures ($ million)(1) ~$275 Standalone EBITDA at 100% utilization(2) ~$55 – $65 Implied investment to standalone EBITDA build-out multiple ~4x – 5x Estimated per well savings to Antero Resources ~$150,000 Estimated in-service date Late 2017 Operating capacity (Bbl/d) 60,000 Operating agreement •Antero has contracted with Veolia to integrate an advanced wastewater treatment complex into its water business • Veolia will build and operate, and Antero will own largest advanced wastewater treatment complex in Appalachia − Will treat and recycle AR produced and flowback water − Creates additional year-round water source for completions − Will have capacity for third party business over first two years 1. Includes capital to construct pipeline to connect facility to freshwater delivery system. Includes $10 million that AR agreed to fund in the drop down transaction. 2. Standalone EBITDA projection assumes inter-company fixed fee for recycling of $4.00 per barrel and 60,000 barrels per day of capacity. Does not include potential sales of marketable byproducts. 20 Years, Extendable 41Integrated Water Business
  • 43. $1 $5 $7 $8 $11 $19 $28 $36 $41 $55 $0 $10 $20 $30 $40 $50 $60 26 31 40 36 41 116 222 358 454 435 0 100 200 300 400 500 600 700 Marcellus 10 38 80 126 266 531 908 1,134 1,197 1,216 0 200 400 600 800 1,000 1,200 1,400 1,600 Utica Marcellus 108 216 281 331 386 531 738 935 965 1,038 0 200 400 600 800 1,000 1,200 1,400 Utica Marcellus Low Pressure Gathering (MMcf/d) Compression (MMcf/d) High Pressure Gathering (MMcf/d) EBITDA ($MM)(1) 42 $185 HIGH GROWTH MIDSTREAM THROUGHPUT 1. 2015E EBITDA guidance updated per 10/13/2015 Partnership press release based on 10/1/2015 effective date for water drop down. Y-O-Y growth based on 3Q’14 to 3Q’15. $175
  • 44. 0.0x 1.0x 2.0x 3.0x 4.0x 5.0x 6.0x Peer 1 Peer 2 Peer 3 Peer 4 Peer 5 Peer 6 Peer 7 Peer 8 TotalDebt/LQAEBITDA • $1.5 billion revolver in place to fund future growth capital (5x Debt/EBITDA Cap) • Liquidity of $993 million at 9/30/2015 • Sponsor (NYSE: AR) has Ba2/BB corporate ratings AM Liquidity (9/30/2015) AM Peer Leverage Comparison(1) ($ in millions) Revolver Capacity $1,500 Less: Borrowings 525 Plus: Cash 18 Liquidity $993 1. As of 9/30/2015. Peers include TEP, EQM, MWE, WES, RMP, SHLX, DM, and CNNX. 2. AM pro forma for water drop down; LQA EBITDA for water based on 2016E midpoint of 8.5x – 9.0x purchase price multiple announced. Financial Flexibility SIGNIFICANT FINANCIAL FLEXIBILITY 43 (2)
  • 46. ($ in millions) 9/30/2015 Cash $27 Senior Secured Revolving Credit Facility 500 Midstream Bank Credit Facility 525 6.00% Senior Notes Due 2020 525 5.375% Senior Notes Due 2021 1,000 5.125% Senior Notes Due 2022 1,100 5.625% Senior Notes Due 2023 750 Net Unamortized Premium 7 Total Debt $4,407 Net Debt $4,380 Financial & Operating Statistics LTM EBITDAX(1) $1,246 LTM Interest Expense(2) $219 Proved Reserves (Bcfe) (12/31/2014) 12,683 Proved Developed Reserves (Bcfe) (12/31/2014) 3,803 Credit Statistics Net Debt / LTM EBITDAX 3.5x Net Debt / Net Book Capitalization 38% Net Debt / Proved Developed Reserves ($/Mcfe) $1.15 Net Debt / Proved Reserves ($/Mcfe) $0.35 Liquidity Credit Facility Commitments(3) $5,500 Less: Borrowings (1,025) Less: Letters of Credit (535) Plus: Cash 27 Liquidity (Credit Facility + Cash) $3,968 ANTERO CAPITALIZATION – CONSOLIDATED 1. LTM and 9/30/2015 EBITDAX reconciliation provided below. 2. LTM interest expense adjusted for all capital market transactions since 1/1/2014. 3. AR lender commitments under the facility increased to $4.0 billion from $3.0 billion on 2/17/2015; borrowing base capacity increased to $4.5 billion from $4.0 billion on 10/26/2015. AM credit facility increased to $1.5 billion concurrent with water drop down on 9/23/2015. 45
  • 47. ANTERO RESOURCES – UPDATED 2015 GUIDANCE Key Variable 2015 Guidance Net Daily Production (MMcfe/d) 1,400 Net Residue Natural Gas Production (MMcf/d) 1,175 Net Liquids Production (Bbl/d) 33,000 Net Oil Production (Bbl/d) 4,000 Natural Gas Realized Price Differential to NYMEX Henry Hub Before Hedging ($/Mcf) $(0.20) - $(0.30) Oil Realized Price Differential to NYMEX WTI Before Hedging ($/Bbl) $(12.00) - $(14.00) NGL Realized Price (% of WTI) 30% - 35% Cash Production Expense ($/Mcfe)(1) $1.50 - $1.60 Marketing Expense, Net of Marketing Revenue ($/Mcfe) $0.20 - $0.30 G&A Expense ($/Mcfe) $0.23 - $0.27 Net Income Attributable to Non-Controlling Interest ($MM) $23 - $27 Operated Wells Completed 130 Average Operated Drilling Rigs 14 Capital Expenditures ($MM) Drilling & Completion $1,600 Water Infrastructure $50 Land $150 Total Capital Expenditures ($MM) $1,800 1. Includes lease operating expenses, gathering, compression and transportation expenses and production taxes. Excludes net marketing expense. Key Operating & Financial Assumptions 46
  • 48. ANTERO MIDSTREAM – 2015 GUIDANCE Key Variable Initial Guidance(1) Updated Guidance(2) Adjusted EBITDA ($MM) $150 - $160 $180 - $190 Distributable Cash Flow ($MM) $135 - $145 $160 - $170 Year-over-Year Distribution Growth(3) 28% - 30% 28% - 30% Low Pressure Pipelines Added (Miles) 44 27 High Pressure Pipelines Added (Miles) 20 15 Compression Capacity Added (MMcf/d) 545 545 Capital Expenditures ($MM) Low Pressure Gathering $165 - $170 $90 - $95 High Pressure Gathering $85 - $90 $70 - $75 Compression $160 - $165 $165 - $170 Condensate Gathering $5 - $10 $5 Water Infrastructure(4) - $80 - $90 Maintenance Capital $10 - $15 $15 Total Capital Expenditures ($MM) $425 - $450 $425 - $450 1. Financial guidance per Partnership press release dated 1/20/2015. 2. Updated financial guidance per Partnership press release dated 10/13/2015. 3. Reflects the expected distribution growth associated with the fourth quarter 2015 over the fourth quarter 2014. 4. Includes fresh water delivery system plus waste water treatment capital expenditures. Key Operating & Financial Assumptions 47
  • 49. $2,477 $197 $841 Drilling & Completion Water Infrastructure Land 65% 35% Marcellus Utica 2015 CAPITAL BUDGET By Area 48 $3.5 Billion - 2014 By Segment ($MM) $1,600 $50 $150 Drilling & Completion Water Infrastructure Land 59%41% Marcellus Utica By Area $1.8 Billion – 2015 By Segment ($MM)  Antero’s 2015 capital budget is $1.8 billion, a 49% decrease from 2014 capital expenditures of $3.5 billion 49% 177 Completions 130 Completions
  • 50. $0.00 $0.50 $1.00 $1.50 $2.00 $2.50 $3.00 $3.50 $4.00 2015 2015 2016 2016 2017 GasPrice$/MMBtu Completion Deferral Impact on Realized Gas Price TETCO CGTLA TETCO Cal 2015: $1.88/MMBtu CGTLA Cal 2016: $3.27/MMBtu BTAX IRR: 57% 49  Plan to defer 50 Marcellus well completions into 2016 to achieve higher gas price realizations − Regional gathering pipeline expected in-service late 2015 will connect incremental Marcellus production to CGTLA (Gulf Coast) and TCO pricing − Results in estimated pre-tax IRR of 57% vs. 39% from 2015 TETCO pricing in first year, excluding sunk drilling costs COMPLETION DEFERRALS – OPTIMIZING PRICING 0 50 100 150 200 250 300 350 400 450 500 Jan-16 Mar-16 May-16 GrossWellheadProduction(MMcf/d) Completion Deferral Impact on 2016 Production Production From 50 Deferred Completions +$1.39/MMBtu Pickup in Price = 18% BTAX IRR Increase BTAX IRR: 39%
  • 51. 12.7 Tcfe Proved 21.8 Tcfe Probable 6.3 Tcfe Possible Proved Probable Possible 40.7 Tcfe 3P 85% 2P Reserves OUTSTANDING RESERVE GROWTH 1. 2012, 2013 and 2014 reserves assuming ethane rejection. 2014 SEC prices were $4.07/MMBtu for natural gas and $81.48/Bbl for oil on a weighted average Appalachian index basis. 50 3P RESERVES BY VOLUME – 2014(1)3P RESERVE GROWTH(1) 25.0 28.4 5.8 7.64.2 4.6 0 5 10 15 20 25 30 35 40 45 2013 2014 (Tcfe) Marcellus Utica Upper Devonian Key Drivers 4.2 NET PROVED RESERVES (Tcfe)(1) 2014 RESERVE ADDITIONS 35.0 40.7 • 93,000 net acres added in 2014 • SSL results • Utica results • 3P reserves increased 16% to 40.7 Tcfe at 12/31/14 with a PV-10 of $22.8 billion − Estimated 10% well cost reduction since YE 2014 results in $2.0 billion increase in 3P PV-10 • All-in finding and development cost of $0.61/Mcfe for 2014 (includes land) • “Bottoms-up” development cost of $0.98/Mcfe for 2014 • Only 66% of 3P Marcellus locations booked as SSL (1.7 Bcf/1,000’ type curve) at 12/31/2014 • No Utica Shale WV/PA dry gas reserves booked – estimated net resource of 11.1 Tcf 0.0 2.0 4.0 6.0 8.0 10.0 12.0 14.0 2010 2011 2012 2013 2014 Marcellus Utica 0.7 2.8 4.3 7.6 12.7 (Tcfe)
  • 52. CONSIDERABLE RESERVE BASE WITH ETHANE OPTIONALITY  35 year proved reserve life based on 2014 production annualized  Reserve base provides significant exposure to liquids-rich projects – 3P reserves of over 2.5 BBbl of NGLs and condensate in ethane recovery mode; 32% liquids 1. Ethane rejection occurs when ethane is left in the wellhead gas stream as the gas is processed, rather than being separated out and sold as a liquid after fractionation. When ethane is left in the gas stream, the BTU content of the residue gas at the outlet of the processing plant is higher. Producers will elect to “reject” ethane when the price received for the higher BTU residue gas is greater than the price received for the ethane being sold as a liquid after fractionation. When ethane is recovered, the BTU content of the residue gas is lower, but a producer is then able to recover the value of the ethane sold as a separate NGL product. ETHANE REJECTION(1) ETHANE RECOVERY(1) 51 Marcellus – 28.4 Tcfe Utica – 7.6 Tcfe Upper Devonian – 4.6 Tcfe 40.7 Tcfe Gas – 34.5 Tcf Oil – 102 MMBbls NGLs – 924 MMBbls Marcellus – 33.7 Tcfe Utica – 8.6 Tcfe Upper Devonian – 5.1 Tcfe 47.4 Tcfe Gas – 32.0 Tcf Oil – 102 MMBbls NGLs – 2,459 MMBbls 15% Liquids 32% Liquids
  • 53. 664 1,010 628 889 45% 31% 14% 16% 38% 26% 10% 13% 0 200 400 600 800 1,000 1,200 0% 15% 30% 45% 60% Highly-Rich Gas/ Condensate Highly-Rich Gas Rich Gas Dry Gas Total3PLocations ROR Total 3P Locations ROR @ 6/30/2015 Strip-Spot ROR @ 6/30/2015 Strip-Current MARCELLUS SINGLE WELL ECONOMICS – IN ETHANE REJECTION 52 DRY GAS LOCATIONS RICH GAS LOCATIONS HIGHLY RICH GAS LOCATIONS Assumptions  Natural Gas – 6/30/2015 strip  Oil – 6/30/2015 strip  NGLs – 32.5% of Oil Price 2015-2016; 50% of Oil Price 2017+ NYMEX ($/MMBtu) WTI ($/Bbl) C3+ NGL(2) ($/Bbl) 2015 $2.87 $61 $20 2016 $3.14 $62 $20 2017 $3.32 $64 $32 2018 $3.40 $65 $32 2019 $3.47 $66 $33 2020-24 $3.61-$4.09 $66-$69 $34-$35 Marcellus Well Economics and Total Gross Locations(1) Classification Highly-Rich Gas/ Condensate Highly-Rich Gas Rich Gas Dry Gas Modeled BTU 1313 1250 1150 1050 EUR (Bcfe): 20.8 18.8 16.8 15.3 EUR (MMBoe): 3.5 3.1 2.8 2.6 % Liquids: 33% 24% 12% 0% Lateral Length (ft): 9,000 9,000 9,000 9,000 Well Cost ($MM): $10.3 $10.3 $10.3 $10.3 Bcfe/1,000’: 2.3 2.1 1.9 1.7 Pre-Tax NPV10 ($MM): $11.2 $5.8 $0.0 $0.8 Pre-Tax ROR: 38% 26% 10% 13% Net F&D ($/Mcfe): $0.58 $0.64 $0.72 $0.79 Payout (Years): 2.4 3.4 7.8 6.8 Gross 3P Locations(3): 664 1,010 628 889 1. 6/30/2015 well economics based on 6/30/2015 strip pricing less basis differential and related transportation cost. Well economics include gathering, compression and processing fees, where applicable. Well cost estimates are all-in and include $1.2 million assumed for road, pad and production facilities. Current well costs include legacy contracts. Spot well costs are adjusted for current market drilling and completion rates resulting in a $1.2 million cost saving vs. current well costs. Antero will begin to realize spot well costs as the company utilizes incremental completion crews for deferred completions beginning at year end 2015 and as existing drilling rig contracts begin to roll off during 2016. 2. Pricing for a 1225 BTU y-grade ethane rejection barrel. NGLs at 32.5% of WTI for 2015-2016 and 50% of WTI for 2017 and thereafter. NGL prices are forecast to increase in 2017 relative to WTI due to projected in-service date of Mariner East II project allowing for a significant increase in AR NGL exports via ship. 3. Undeveloped well locations as of 12/31/2014. 2015 Drilling Plan
  • 54. 248 139 94 254 289 15% 38% 47% 35% 40% 11% 29% 38% 28% 32% 0 50 100 150 200 250 300 0% 15% 30% 45% 60% Condensate Highly-Rich Gas/ Condensate Highly-Rich Gas Rich Gas Dry Gas Total3PLocations ROR Total 3P Locations ROR @ 6/30/2015 Strip-Spot ROR @ 6/30/2015 Strip-Current UTICA SINGLE WELL ECONOMICS – IN ETHANE REJECTION 53 DRY GAS LOCATIONS RICH GAS LOCATIONS HIGHLY RICH GAS LOCATIONS Utica Well Economics and Gross Locations(1) Classification Condensate Highly-Rich Gas/ Condensate Highly-Rich Gas Rich Gas Dry Gas Modeled BTU 1275 1235 1215 1175 1050 EUR (Bcfe): 9.4 17.0 25.3 23.8 21.4 EUR (MMBoe): 1.6 2.8 4.2 4.0 3.6 % Liquids 35% 26% 21% 14% 0% Lateral Length (ft): 9,000 9,000 9,000 9,000 9,000 Well Cost ($MM): $11.6 $11.6 $11.6 $11.6 $11.6 Bcfe/1,000’: 1.0 1.9 2.8 2.7 2.4 Pre-Tax NPV10 ($MM): $0.3 $7.0 $11.2 $7.8 $8.6 Pre-Tax ROR: 11% 29% 38% 28% 32% Net F&D ($/Mcfe): $1.52 $0.84 $0.57 $0.60 $0.67 Payout (Years): 7.0 2.6 2.2 2.9 2.4 Gross 3P Locations(3): 248 139 94 254 289 1. 6/30/2015 well economics based on 6/30/2015 strip pricing less basis differential and related transportation cost. Well economics include gathering, compression and processing fees, where applicable. Well cost estimates are all-in and include $1.2 million assumed for road, pad and production facilities. Current well costs include legacy contracts. Spot well costs are adjusted for current market drilling and completion rates resulting in a $1.2 million cost saving vs. current well costs. Antero will begin to realize spot well costs as the company utilizes incremental completion crews for deferred completions beginning at year end 2015 and as existing drilling rig contracts begin to roll off during 2016. 2. Pricing for a 1225 BTU y-grade ethane rejection barrel. NGLs at 32.5% of WTI for 2015-2016 and 50% of WTI for 2017 and thereafter. NGL prices are forecast to increase in 2017 relative to WTI due to projected in-service date of Mariner East II project allowing for a significant increase in AR NGL exports via ship. 3. Undeveloped well locations as of 12/31/2014. 3P locations representative of BTU regime; EUR and economics within regime will vary based on BTU content. 2015 Drilling Plan Assumptions  Natural Gas – 6/30/2015 strip  Oil – 6/30/2015 strip  NGLs – 32.5% of Oil Price 2015-2016; 50% of Oil Price 2017+ NYMEX ($/MMBtu) WTI ($/Bbl) C3+ NGL(2) ($/Bbl) 2015 $2.87 $61 $20 2016 $3.14 $62 $20 2017 $3.32 $64 $32 2018 $3.40 $65 $32 2019 $3.47 $66 $33 2020-24 $3.61-$4.09 $66-$69 $34-$35
  • 55. 1,316 1,793 1,502 1,745 1,800 1,213 235 $4.51 $3.94 $3.83 $4.06 $3.94 $3.75 $3.67 $2.57 $2.77 $2.95 $3.01 $3.06 $3.17 $3.31 $0.00 $1.00 $2.00 $3.00 $4.00 $5.00 $6.00 0 200 400 600 800 1,000 1,200 1,400 1,600 1,800 6 Mths 2015 2016 2017 2018 2019 2020 2021 BBtu/d $/MMBtu 54 Average Index Hedge Price(1)Hedged Volume Current NYMEX Strip(2) COMMODITY HEDGE POSITION  ~$2.8 billion mark-to-market unrealized gain based on 9/30/2015 prices  3.1 Tcfe hedged from October 1, 2015 through year-end 2021 and 83 Bcf of TCO basis hedged from 2015 to 2017 $235 MM $838 MM $494 MM $664 MM $575 MM $257 MM Mark-to-Market Value(2) LARGEST GAS HEDGE POSITION IN U.S. E&P ≈ 94% of 2015  Guidance  Hedged 541. Weighted average index price based on volumes hedged assuming 6:1 gas to liquids ratio; excludes impact of TCO basis hedges. 3,000 Bbl/d of oil and 23,000 Bbl/d of propane hedged for 2015. 2. As of 9/30/2015; 2015 mark-to-market value reflects October-December hedges.  Hedging is a key component of Antero’s business model due to the large, repeatable drilling inventory  Antero has realized almost $1.5 billion of gains on commodity hedges since 2008 – Gains realized in 29 of last 31 quarters $MM $/Mcfe $31 MM $4 -$8 $5 $25 $34 $29 $28 $26 $12 $16 $17 $28 $29 $19 $25 $43 $80 $83 $59 $49 $48 $14 $47 $54 -$1 $1 $58 $78 $185 $196 $183 ($2.00) ($1.00) $0.00 $1.00 $2.00 $3.00 $4.00 ($20.0) $30.0 $80.0 $130.0 $180.0 $230.0 Quarterly Realized Gains/(Losses) 1Q '08 - 3Q '15 ≈ 100% of 2016  Target  Midpoint
  • 56. $0.14 $0.17 $0.23 $0.33 $0.11 $0.11 $0.12 $0.13 $0.00 $0.10 $0.20 $0.30 $0.40 $0.50 $0.60 $0.70 2013A 2014A 2015E 2016E ($/MMBtu) Wtd. Avg. FT Demand ($/MMBtu) Wtd. Avg. FT Commodity/Fuel ($/MMBtu) All-in Firm Transportation Costs(1) FIRM TRANSPORTATION REDUCES APPALACHIAN BASIS EXPOSURE Appalachia 49% Gulf Coast 51% 2013 Firm Transportation(1)(2) 2013 Firm Transportation – 647 MMcf/d Average All-in FT Cost $0.25/MMBtu 2016 Firm Transportation – 3.1 Bcf/d Average All-in FT Cost $0.46/MMBtu + $0.18/MMBtu  Antero’s firm transportation (FT) portfolio increases visibility on production growth and increases exposure to Gulf Coast and Midwest pricing, with little incremental cost per Mcf  Reduces weighted average basis by $0.35 per MMBtu compared to 2014 basis – while significantly reducing Appalachian basis exposure Utilized portion included in cash production expense (fixed cost) 1. Assumes full utilization of firm transportation capacity. 2. Represents accessible firm transportation and sales agreements. 3. Based on current strip pricing as at 9/30/2015. Included in cash production expense (variable cost) $0.25 $0.28 $0.35 $0.46 2016 Basis(3) TCO – $(0.22)/MMBtu DOM S – $(1.05)/MMBtu 2016 Basis(3) Chicago – $0.04/MMBtu 2016 Basis(3) CGTLA – $(0.08)/MMBtu 55 Appalachia 35% Midwest 20% Gulf Coast 45%
  • 57. $525 $1,000 $1,100 $750 $0 $200 $400 $600 $800 $1,000 $1,200 2015 2016 2017 2018 2019 2020 2021 2022 2023 ($inMillions) $1,500 $993 ($525) $0 $18 $0 $250 $500 $750 $1,000 $1,250 $1,500 Credit Facility 9/30/2015 Bank Debt 9/30/2015 L/Cs Outstanding 9/30/2015 Cash 9/30/2015 Liquidity 9/30/2015 56 STRONG FINANCIAL LIQUIDITY AND DEBT TERM STRUCTURE 56 $4,000 $2,975 ($500) ($535) $10 $0 $1,000 $2,000 $3,000 $4,000 Credit Facility 9/30/2015 Bank Debt 9/30/2015 L/Cs Outstanding 9/30/2015 Cash 9/30/2015 Liquidity 9/30/2015 AR LIQUIDITY POSITION ($MM) AM LIQUIDITY POSITION ($MM)  Over $3.9 billion of combined AR and AM financial liquidity as of 9/30/2015  No leverage covenant in AR bank facility, only interest coverage and working capital covenants AR Credit Facility AR Senior Notes DEBT MATURITY PROFILE  Recent credit facility increases and equity offerings have allowed Antero to reduce its cost of debt to 4.4% and significantly enhance liquidity while the average debt maturity is April 2021 AM Credit Facility
  • 58. Moody's S&P POSITIVE RATINGS MOMENTUM Moody’s / S&P Historical Corporate Credit Ratings “We could raise the ratings due to our assessment of an improvement in the company's financial profile. An improvement in the financial profile would include maintaining FFO to debt of greater than 45% and narrowing the amount that the company outspends its cash flows by.” - S&P Credit Research, September 2014 "The upgrade reflects Moody's expectation that Antero will continue to report strong production growth and increasing reserves despite challenging market conditions and without a significant increase in leverage. Antero's low finding and development costs and significant commodity hedge position should allow the company to continue to prosper despite today's low commodity price environment.“ - Moody’s Credit Research, February 2015 Corporate Credit Rating (Moody’s / S&P) Ba3 / BB- B1 / B+ B2 / B B3 / B- 2/24/2011 10/21/2013 9/4/20145/31/13 Ba2 / BB Ba1 / BB+ Caa1 / CCC+ (1) 1. Represents corporate credit rating of Antero Resources Corporation / Antero Resources LLC. Baa3 / BBB- Moody’s Upgrade Rationale S&P Upgrade Criteria 57 3/31/2015 Ba2/BB 9/30/20159/1/2010
  • 59. LNG Exports 48% Mexico/Canada Exports 18% Power Generation 17% Transportation 1% Industrial 16% 20 BCF/D OF INCREMENTAL GAS DEMAND BY 2020  Significant demand growth expected for U.S. natural gas  More than 65% of the 20 Bcf/d in incremental gas demand forecast by 2020 is expected to be generated from exports: − LNG: 9.5 Bcf/d (~48%) − Mexico/Canada: 3.5 Bcf/d (~18%)  Of the 9.5 Bcf/d of expected incremental demand from LNG export projects, 6.7 Bcf/d (or 70%) of the projects have secured the necessary DOE and FERC permits 58 Incremental Demand Growth Through 2020 by Category Projected Incremental Natural Gas Demand Through 2020 Source: Simmons & Company International, “2015 US Natural Gas Outlook and Updated Long Term Demand Forecast,” September 2014. Sherwood 7 2 5 9 13 17 20 0 4 8 12 16 20 2015 2016 2017 2018 2019 2020 Mexico/Canada Exports Power Generation Transportation Petrochem LNG Exports 9.5 Bcf/d of the 20 Bcf/d of incremental demand is expected to come from LNG exports (Bcf/d) LNG Exports Power Gen Petrochem
  • 60. LNG Exports by Project (in Bcf/d) 2015 2016 2017 2018 2019 2020 Total Sabine Pass 1 - 0.6 - - - - Sabine Pass 2 - 0.6 - - - - Sabine Pass 3 - - 0.6 - - - Sabine Pass 4 - - 0.6 - - - Sabine Pass 5 - - - - 0.6 - 3.0 Cove Point 1 - - 0.4 - - - Cove Point 2 - - - 0.4 - - 0.8 Cameron 1 - - - 0.6 - - Cameron 2 - - - 0.6 - - Cameron 3 - - - - 0.6 - 1.8 Freeport 1 - - - 0.5 - - Freeport 2 - - - - 0.5 - Freeport 3 - - - - 0.5 - Freeport 4 - - - - - 0.4 2.1 Corpus Christi 1 - - - - 0.6 - Corpus Christi 2 - - - - - 0.6 1.2 Lake Charles 1 - - - - - 0.6 0.6 LNG Incremental Exports - 1.2 1.6 2.2 2.9 1.7 LNG Cumulative Exports - 1.2 2.8 5.0 7.9 9.5 LNG EXPORTS BY PROJECT – EXPECTED START UP  Assuming 9.5 Bcf/d of LNG exports by 2020, the U.S. will be the world’s 3rd largest LNG exporter behind Qatar and Australia − 7.7 Bcf/d (81%) of the 9.5 Bcf/d of expected LNG exports have secured US DOE non-FTA (Free Trade Agreement) permit approval − 6.7 Bcf/d (four projects, 70%) have been awarded FERC construction permits  The first LNG export project, Sabine Pass LNG Train 1, is expected to commence operations in early 2016 − Antero has committed to 200 MMcf/d on Sabine Pass Trains 1-4  The second LNG export project, Cove Point LNG, is expected to commence operations in mid-2017 − Antero has committed to 330 MMcf/d on Cove Point 1 & 2 59 LNG Exports by Project Through 2020 Antero Supply Agreements for Portion of Capacity Source: Simmons & Company International, “2015 US Natural Gas Outlook and Updated Long Term Demand Forecast,” September 2014. Note: Data updated for recent announcements subsequent to Simmons report. Antero Supplied
  • 61. 2015 GLOBAL LPG DEMAND  Global LPG demand is 8.5 MMBbl/d and growing 60
  • 62. GLOBAL LPG DEMAND DRIVEN BY PETCHEM AND RES/COMM  Largest end-use sectors for LPG are residential/commercial, which tends to grow with population and improvement in living standards in the emerging markets − PIRA forecasting >1.0 MMBbl/d over next 5 years and >4.5 MMBbl/d of global LPG demand growth over next 20 years 611. PIRA NGL Study, September 2015. MMBbl/d 14.7 13.0 11.4 9.8 8.2 6.5 4.9 3.3 1.6
  • 63. GLOBAL LPG TRADE DRIVEN BY U.S. SHALE  The U.S. is the largest single driver of the rapid expansion in LPG trade accounting for over 90% in trade growth 621. PIRA NGL Study, September 2015. MMBbl/d 5.2 4.6 3.9 3.3 2.6 2.0 1.3 0.7 United States
  • 64. U.S. SHALE NGL EURS SUPPORT LPG TRADE GROWTH 631. PIRA NGL Study, September 2015. • U.S. shale play NGL reserves are 50.8 billion barrels • Eagle Ford, Marcellus, Utica, Bakken and Permian are the work horses of U.S. shale production growth • Marcellus/Utica NGL resource estimate by PIRA is 9.7 billion barrels, in line with Antero estimate of ≈ 11.1 billion barrels • The growth curve of each basin will ultimately be a function of downstream solutions and investment (1) (1) (1)
  • 65. POSITIVE OUTLOOK FOR LONG-TERM ETHANE MARKETS AS WELL U.S. Ethane Supply/Demand Balance Through 2020(1) 1. Source: Bentek, August 2015. 2. Source: Citi research dated 7/15/2015. U.S. Ethane Exports Through 2020(2)  U.S. ethane demand is projected to increase at an annual 3.5% CAGR through 2020, primarily based on an ≈8% CAGR for U.S. petrochem demand and a 30% growth in exports primarily to Europe − The growth in shipping exports in 2016 and 2017 is driven by Enterprise Products’ 200 MBbl/d export facility on the Gulf Coast - 0.5 1.0 1.5 2.0 2.5 2012 2013 2014 2015 2016 2017 2018 2019 2020 MMBb/d Petchem Exports Rejection Total Supply (Net Stock Change) U.S. Seaborne Ethane Exports Through 2020(2) - 50 100 150 200 250 300 350 2013 2014 2015 2016 2017 2018 2019 2020 MBbl/d Ship Pipeline 250 200 150 100 50 MBbl/d U.S. exports increase significantly into 2016 and 2017 as EPD’s Morgan Point Facility comes in-service U.S. Ethane Rejection by Region Through 2020(1) Access to both Marcus Hook and the Gulf Coast is critical to optimizing ethane netbacks Rejection declines significantly into 2018 Unlike LPG, 80% of ethane will be consumed in the U.S. Petrochem demand increases at ≈8% CAGR through 2020 - 100 200 300 400 500 600 2012 2013 2014 2015 2016 2017 2018 2019 2020 MBbl/d Williston PADD 4 PADD 1 (East Coast) PADD 2 PADD 3 No Northeast rejection after 2017 64 Northeast Ethane Rejection Exports U.S. PetChem
  • 66. Europe Mariner East II Shipping $0.25/Gal NGL EXPORTS AND NETBACKS STEP-UP BY 4Q 2016 1. Source: Intercontinental exchange as of 6/30/2015. 2. Source of graphic: Tudor Pickering Holt & Co. research presentation dated June 16, 2015 3. As an anchor shipper on Mariner East II, Antero has the right to expand its NGL commitment with notice to operator. 4. Shipping rates based on benchmark Baltic shipping rate of $129/ton as of 6/30/15, adjusted for number of shipping days to NWE. 5. Pipeline fee equal to $0.0725/gal, per Mariner East I tariff. Terminal fee equal to $0.12/gal, per TPH report dated June 16, 2015.  Upon in-service of Mariner East II, Antero will have the ability to market its propane and n-butane to international buyers, which we expect will provide uplifts of $0.14/Gal and $0.12/Gal, respectively, to the current netbacks received from propane and n-butane volumes shipped to Mont Belvieu today − In the meantime, Antero has 23,000 Bbl/d of propane hedged at $0.63/Bbl in 2015 and 30,000 Bbl/d hedged at $0.59/Bbl in 2016  Commitment to Mariner East II results in over $100 million in combined incremental annualized cash flow from sales of propane and n-butane (~$75 MM from propane and ~$28 MM from n-butane) Pricing Propane: $0.43/Gal N-Butane: $0.60/Gal Pricing Propane: $0.69/Gal N-Butane: $0.87/Gal Mariner East II 61,500 Bbl/d AR Commitment (see table below) (3) 4Q 2016 In-Service Shipping Propane: $0.18/Gal N-Butane: $0.21/Gal Mont Belvieu Netback ($/Gal) Propane N-Butane August Mont Belvieu (1) : $0.43 $0.60 Less: Shipping Costs to Mont Belvieu (2) : (0.25) (0.25) Appalachia Netback to AR: $0.18 $0.35 AR Mariner East II Commitment (Bbl/d) Product Base Option (3) Total Ethane (C2) 11,500 - 11,500 Propane (C3) 35,000 35,000 70,000 Butane (C4) 15,000 15,000 30,000 Total 61,500 50,000 111,500 NWE Netback ($/Gal) Propane N-Butane August NWE Price (1) : $0.69 $0.87 Less: Spot Freight (4) : (0.18) (0.21) FOB Margin at Marcus Hook: $0.51 $0.66 Less: Pipeline & Terminal Fee (5) : (0.19) (0.19) NWE Netback to AR: $0.32 $0.47 Upside to Appalachia Netback: $0.14 $0.12 65
  • 67. ANTERO EBITDAX RECONCILIATION 66 EBITDAX Reconciliation ($ in millions) Quarter Ended LTM Ended 9/30/2015 9/30/2015 EBITDAX: Net income (loss) including noncontrolling interest $544.7 $1,413.4 Commodity derivative fair value (gains) (1,079.1) (2,768.3) Net cash receipts (payments) on settled derivatives instruments 205.9 665.1 (Gain) loss on sale of assets - (40.0) Interest expense 60.9 222.9 Loss on early extinguishment of debt - - Income tax expense (benefit) 335.5 868.5 Depreciation, depletion, amortization and accretion 189.1 706.5 Impairment of unproved properties 8.8 51.0 Exploration expense 1.1 9.8 Equity-based compensation expense 23.9 105.6 State franchise taxes - 0.6 Contract termination and rig stacking - 10.9 Consolidated Adjusted EBITDAX $290.8 $1,245.9 EBITDAX: Net income from discontinued operations - - (Gain) on sale of assets - - Provision for income taxes - - Adjusted EBITDAX from discontinued operations - - Total Adjusted EBITDAX $290.8 $1,245.9
  • 68. CAUTIONARY NOTE The SEC permits oil and gas companies, in their filings with the SEC, to disclose only proved, probable and possible reserve estimates (collectively, “3P”). Antero has provided internally generated estimates for proved, probable and possible reserves in this presentation in accordance with SEC guidelines and definitions. The estimates of proved, probable and possible reserves as of December 31, 2014 included in this presentation have been audited by Antero’s third-party engineers. Unless otherwise noted, reserve estimates as of December 31, 2014 assume ethane rejection and strip pricing. Actual quantities that may be ultimately recovered from Antero’s interests may differ substantially from the estimates in this presentation. Factors affecting ultimate recovery include the scope of Antero’s ongoing drilling program, which will be directly affected by commodity prices, the availability of capital, drilling and production costs, availability of drilling services and equipment, drilling results, lease expirations, transportation constraints, regulatory approvals and other factors; and actual drilling results, including geological and mechanical factors affecting recovery rates. In this presentation:  “3P reserves” refer to Antero’s estimated aggregate proved, probable and possible reserves as of December 31, 2014. The SEC prohibits companies from aggregating proved, probable and possible reserves in filings with the SEC due to the different levels of certainty associated with each reserve category.  “EUR,” or “Estimated Ultimate Recovery,” refers to Antero’s internal estimates of per well hydrocarbon quantities that may be potentially recovered from a hypothetical future well completed as a producer in the area. These quantities do not necessarily constitute or represent reserves within the meaning of the Society of Petroleum Engineer’s Petroleum Resource Management System or the SEC’s oil and natural gas disclosure rules.  “Condensate” refers to gas having a heat content between 1250 BTU and 1300 BTU in the Utica Shale.  “Highly-Rich Gas/Condensate” refers to gas having a heat content between 1275 BTU and 1350 BTU in the Marcellus Shale and 1225 BTU and 1250 BTU in the Utica Shale.  “Highly-Rich Gas” refers to gas having a heat content between 1200 BTU and 1275 BTU in the Marcellus Shale and 1200 BTU and 1225 BTU in the Utica Shale.  “Rich Gas” refers to gas having a heat content of between 1100 BTU and 1200 BTU.  “Dry Gas” refers to gas containing insufficient quantities of hydrocarbons heavier than methane to allow their commercial extraction or to require their removal in order to render the gas suitable for fuel use. Regarding Hydrocarbon Quantities 67