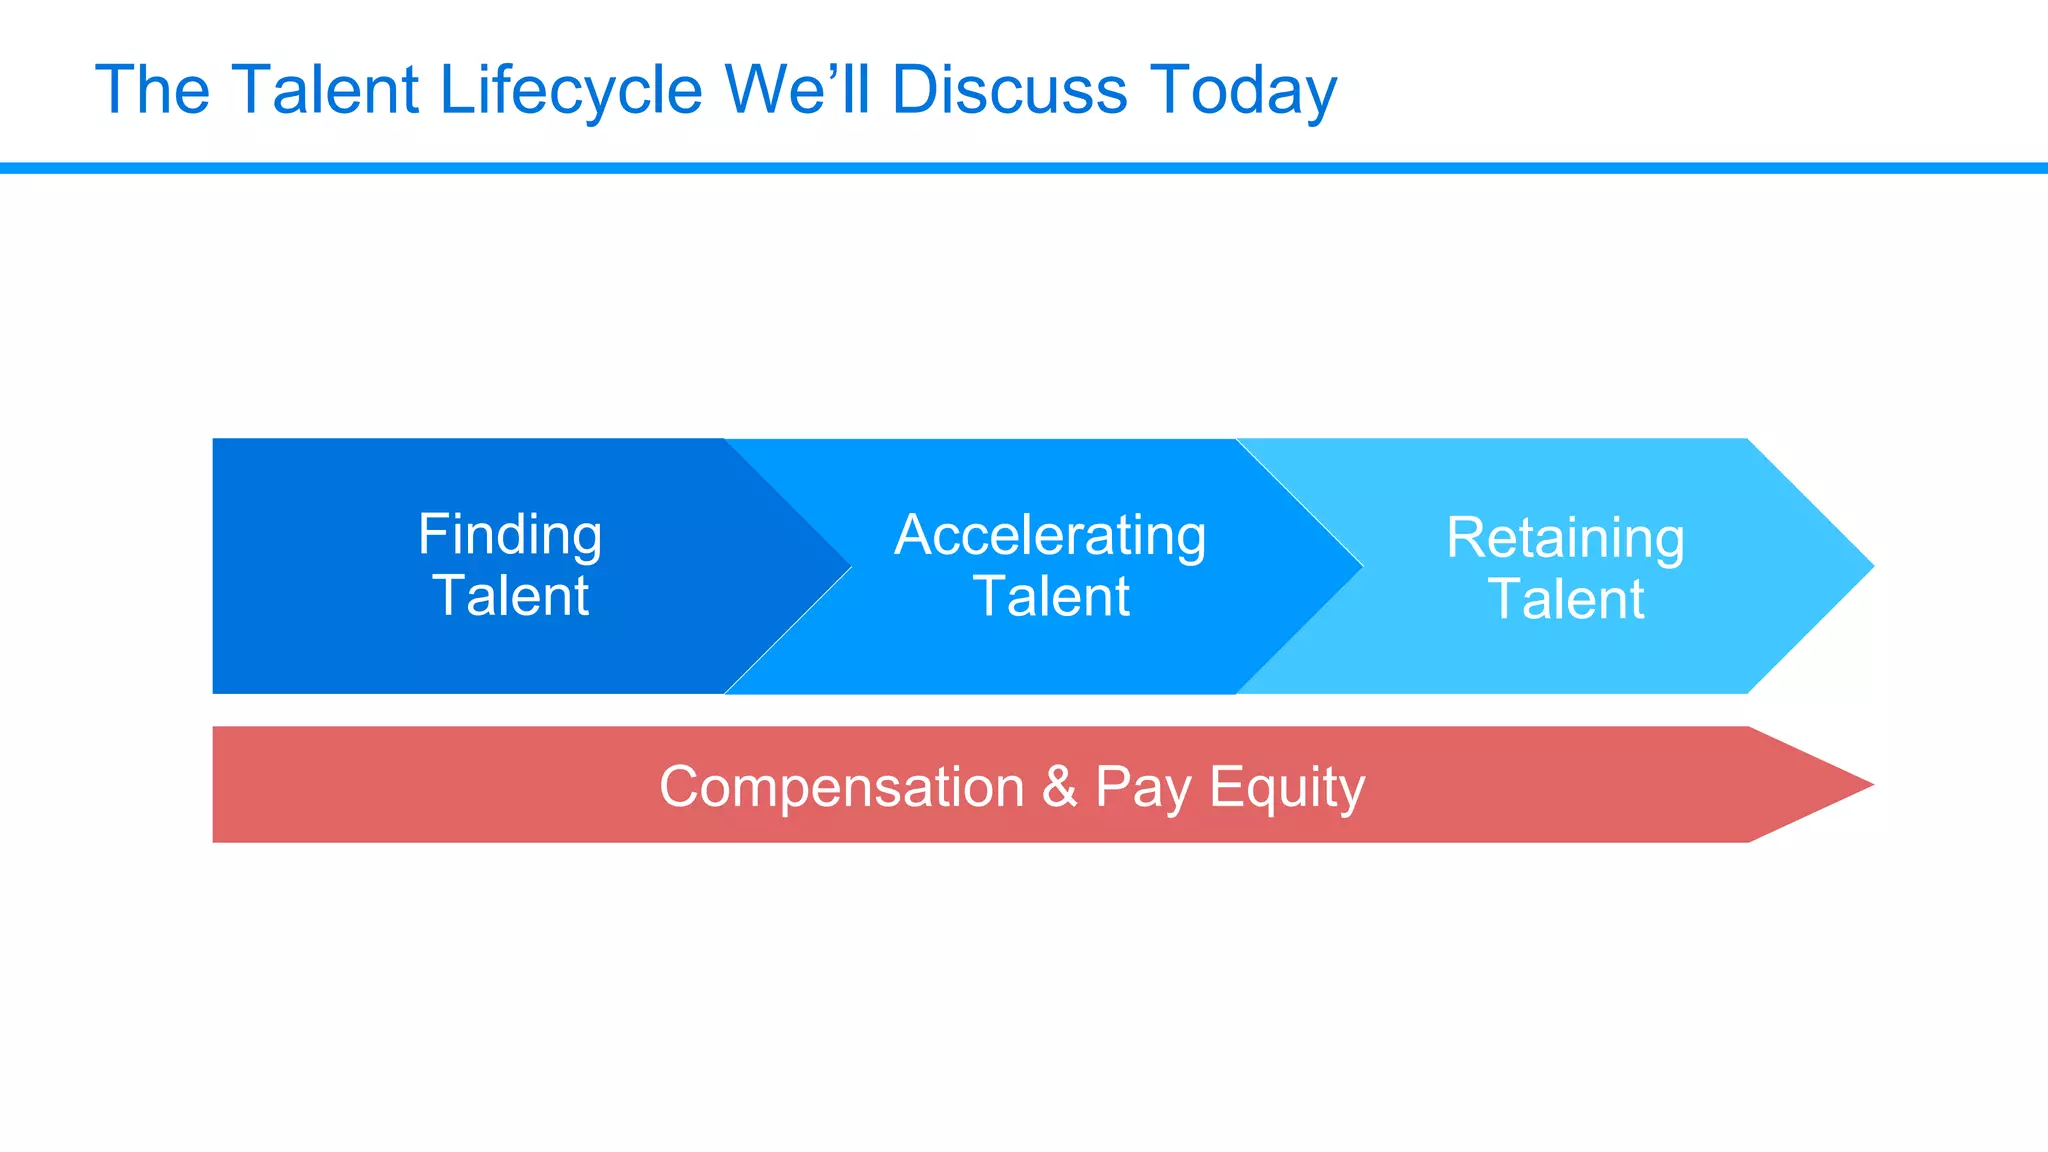
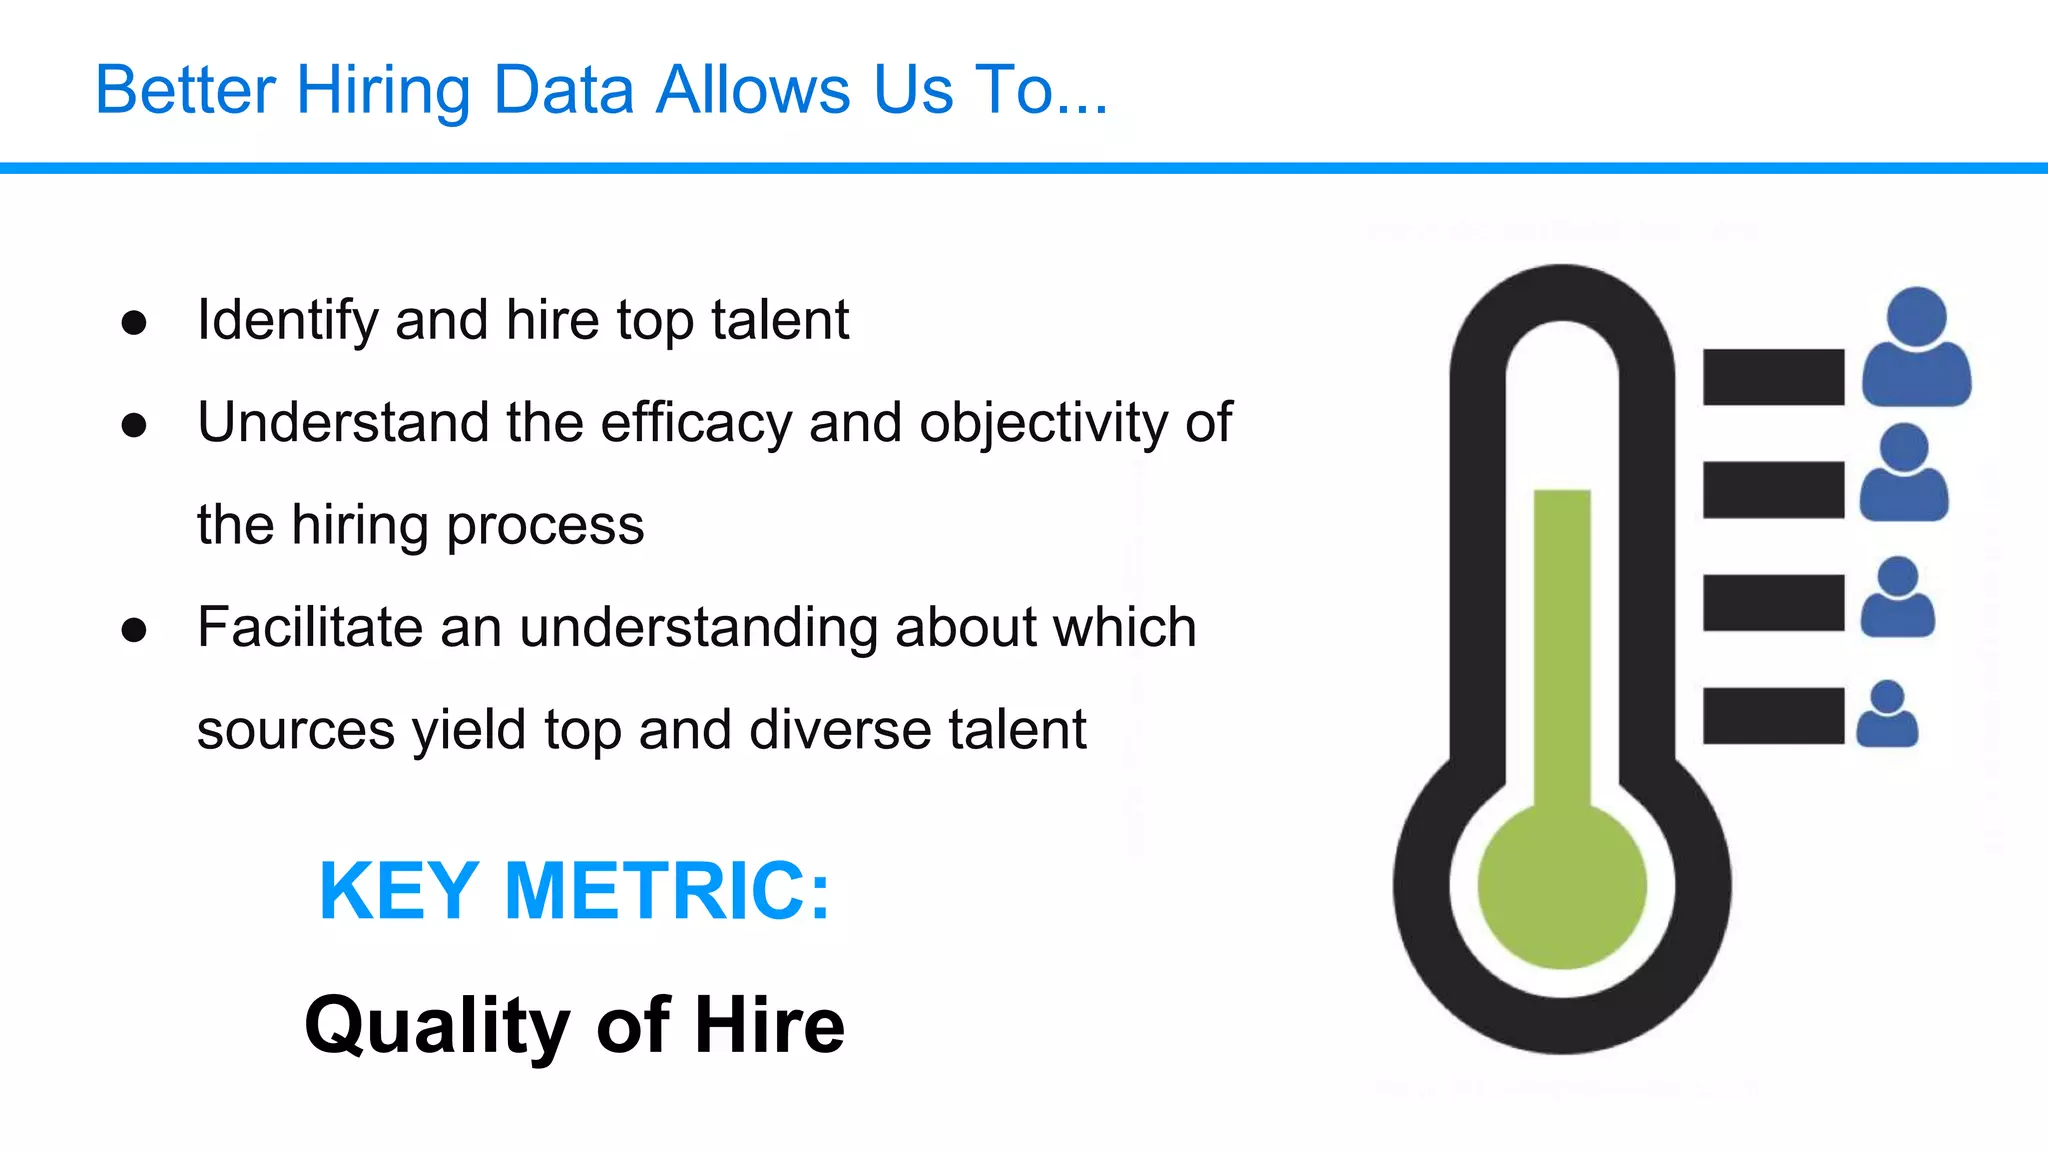
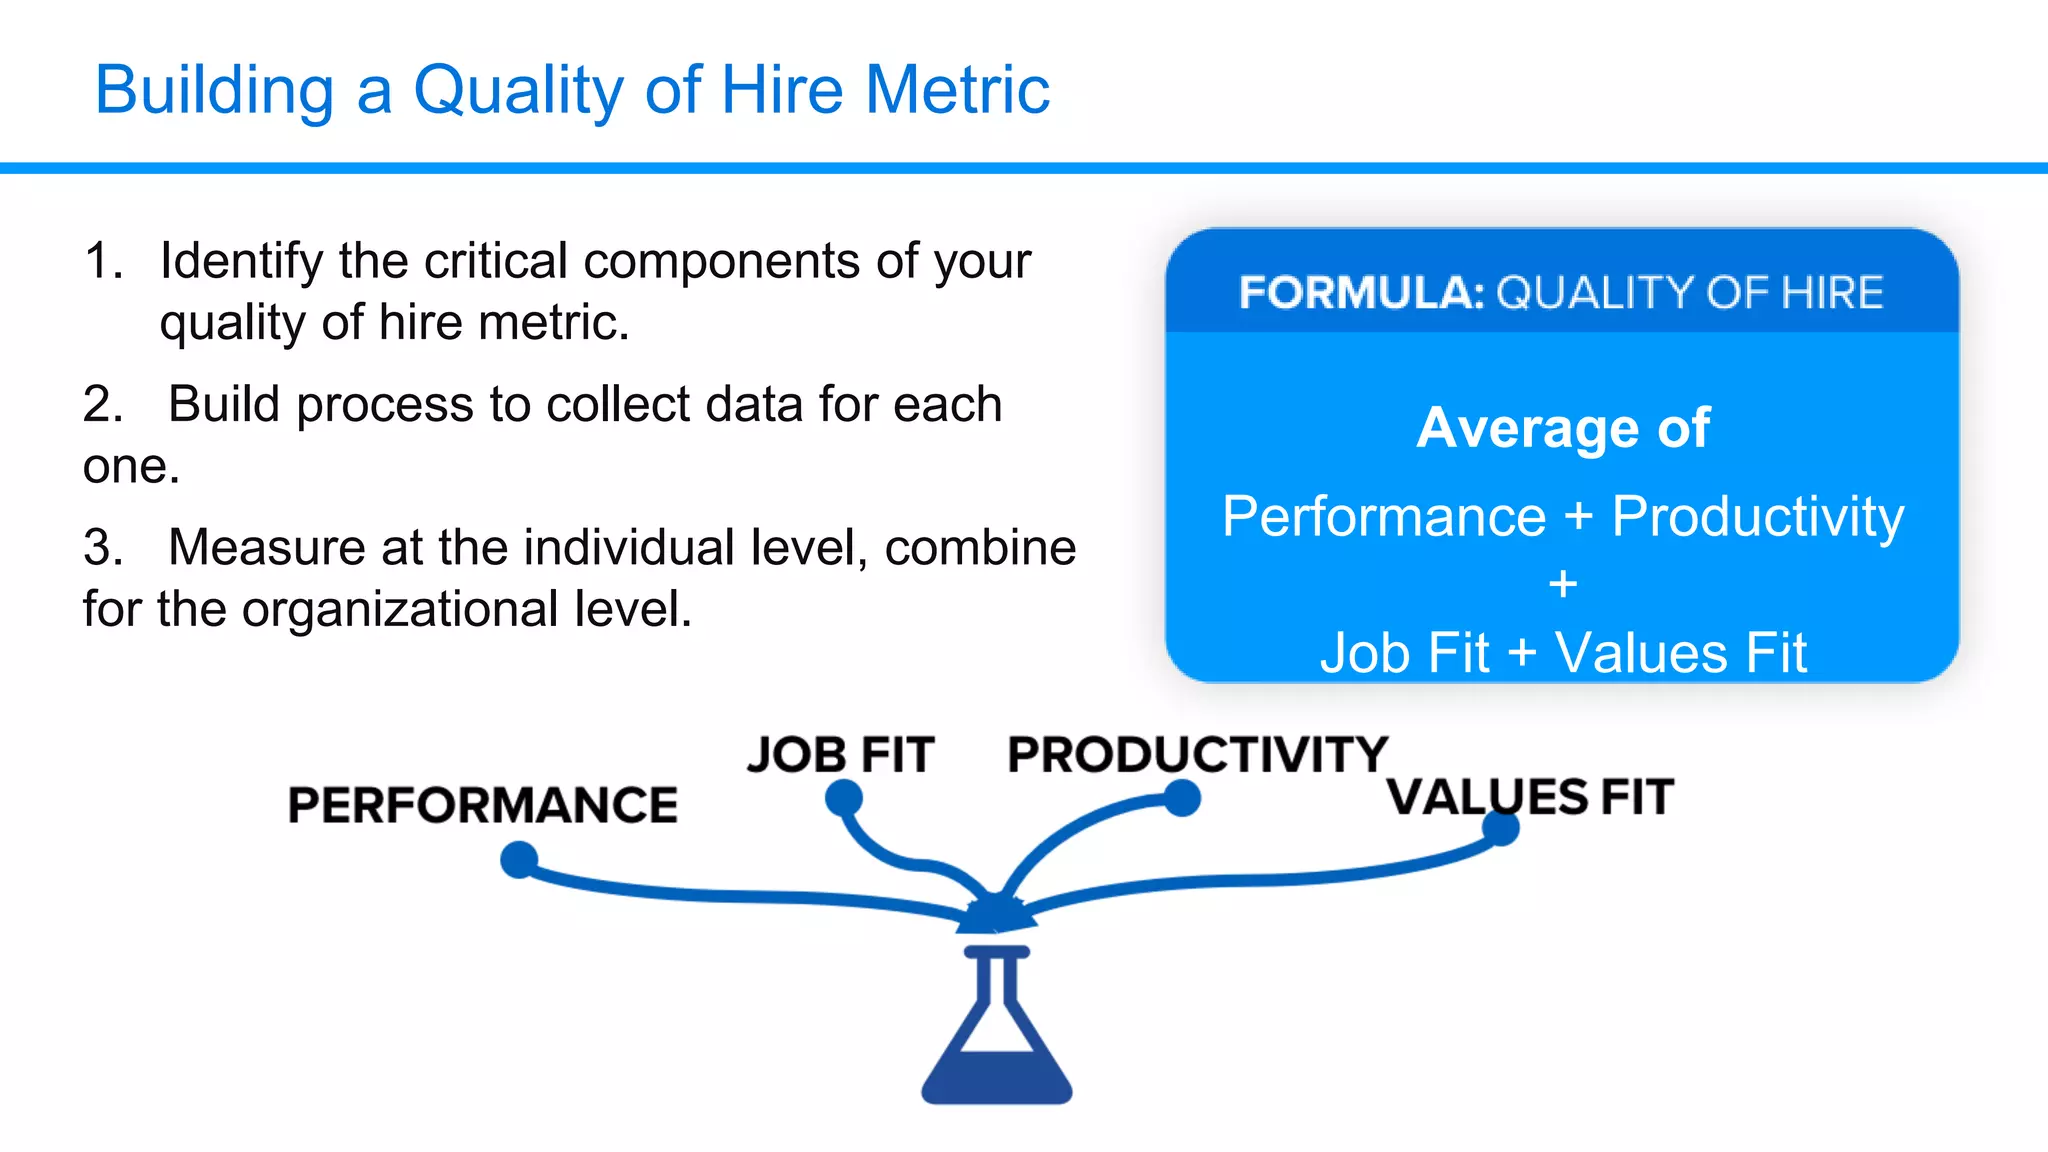
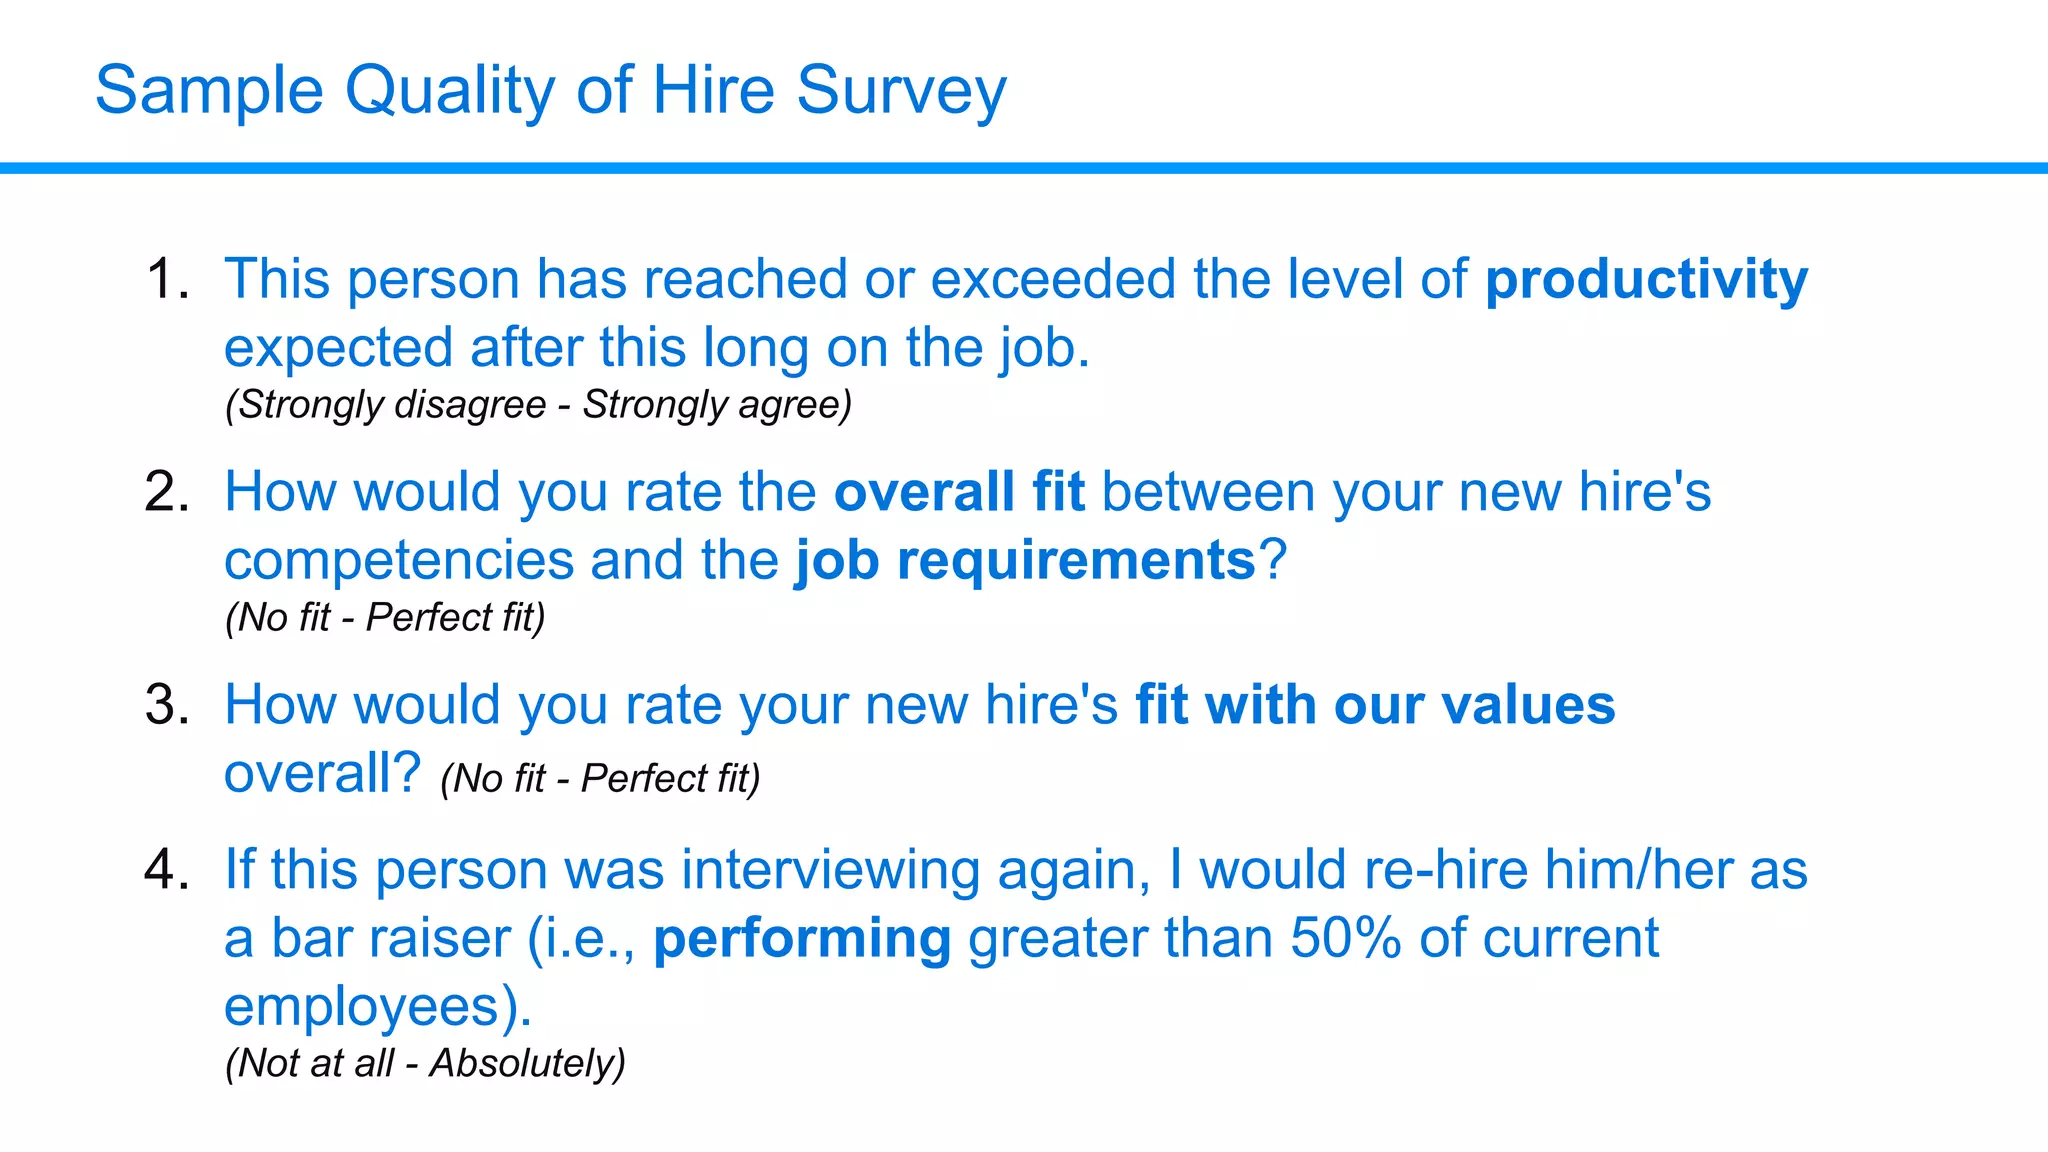
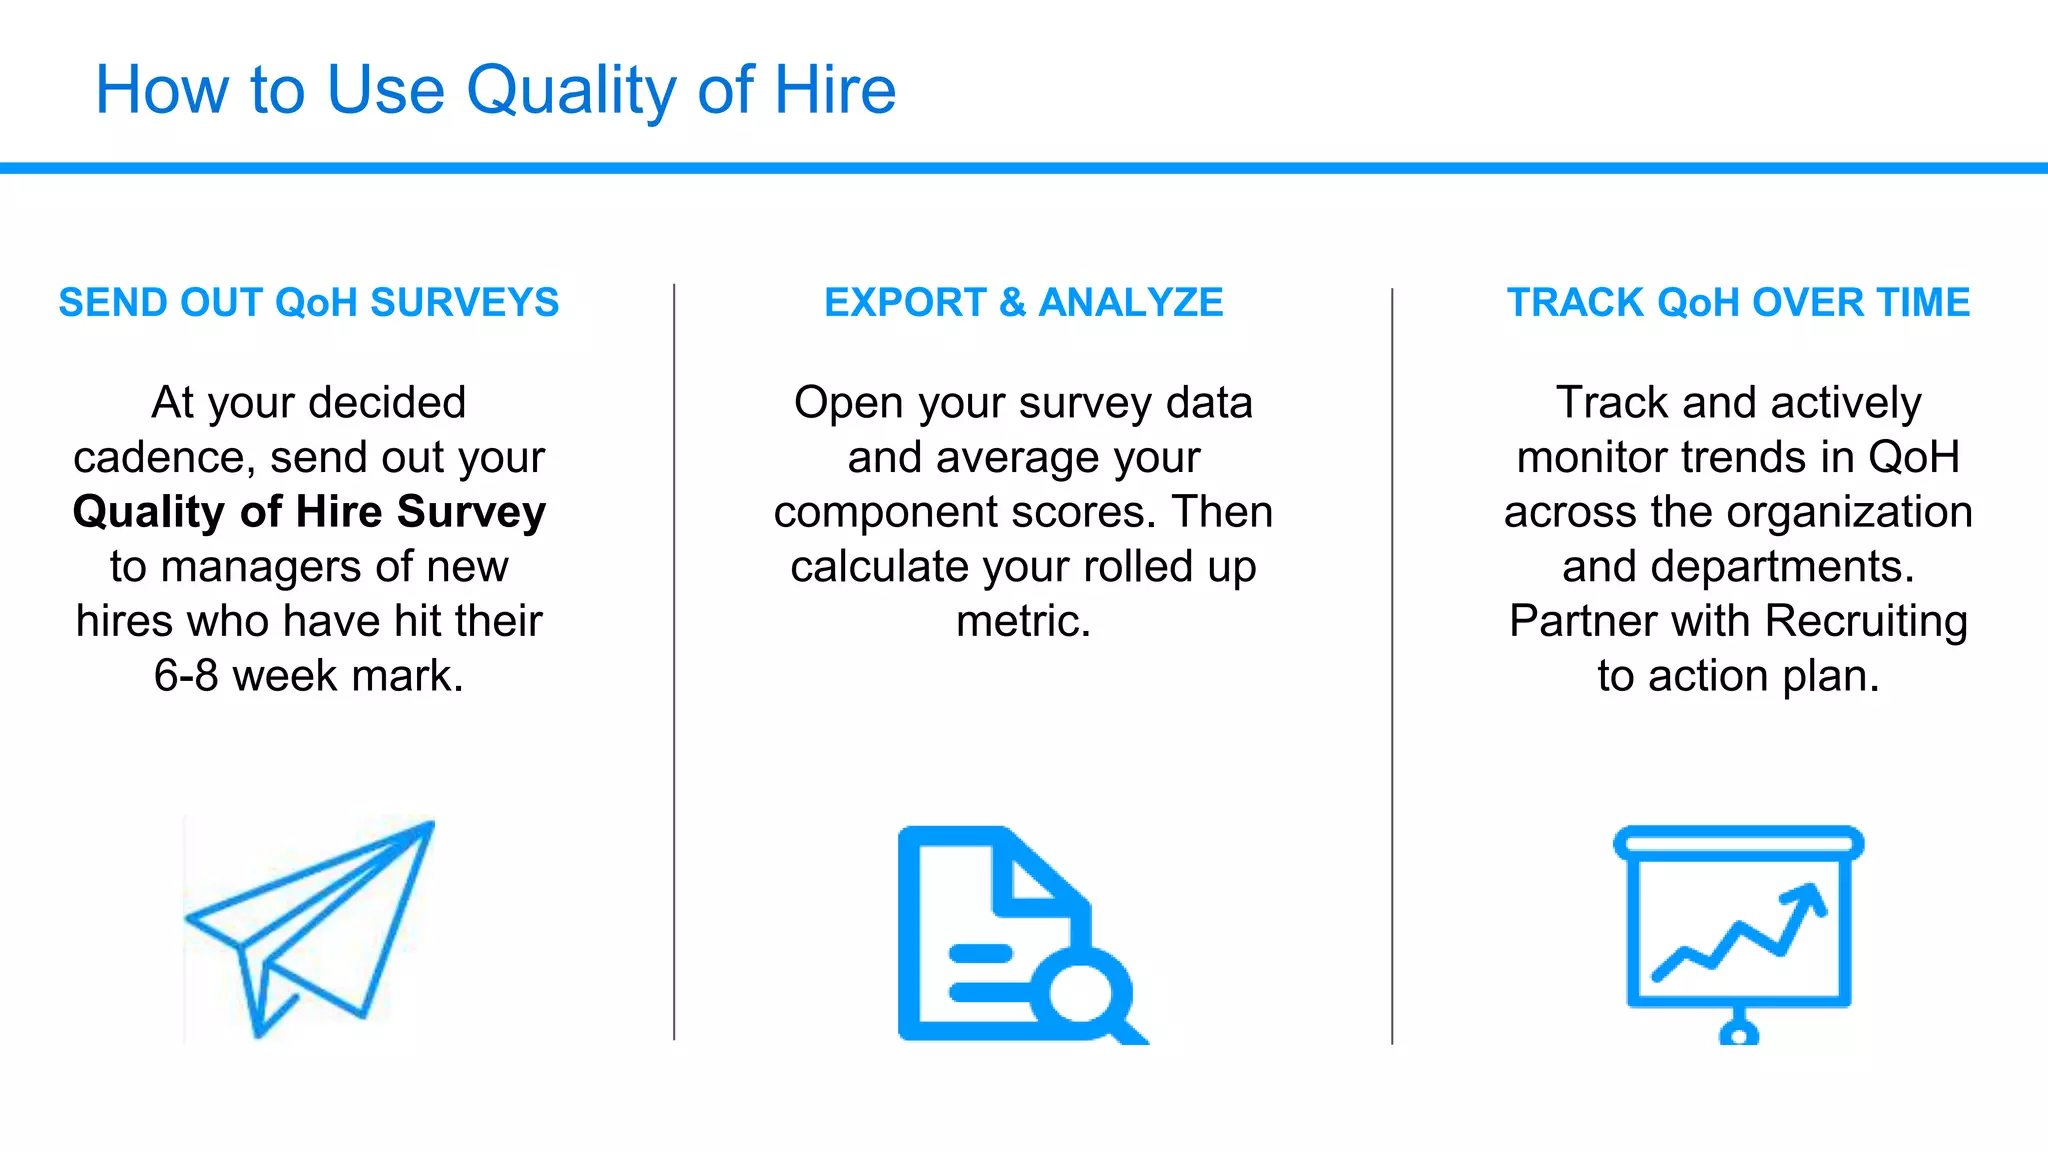
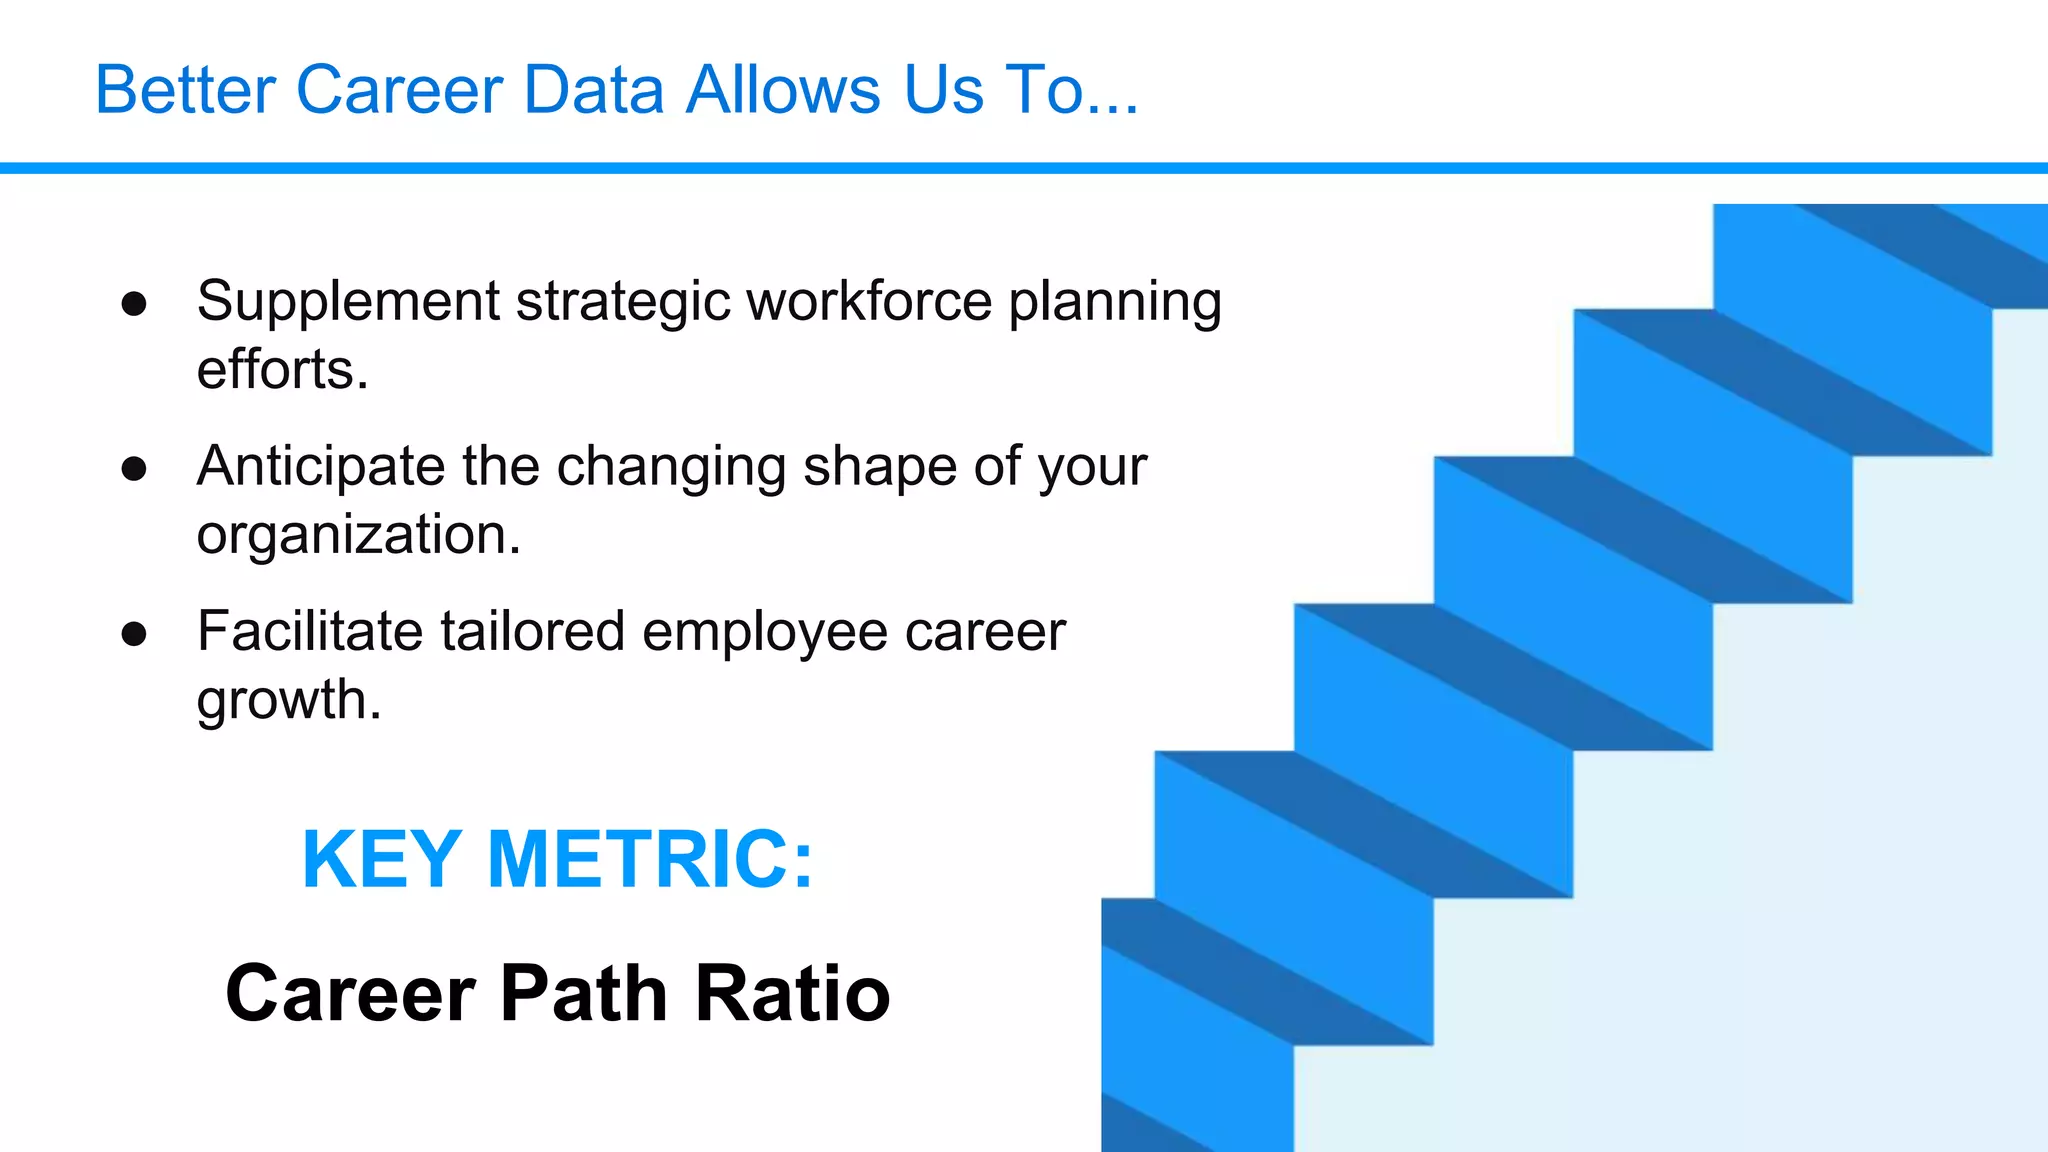
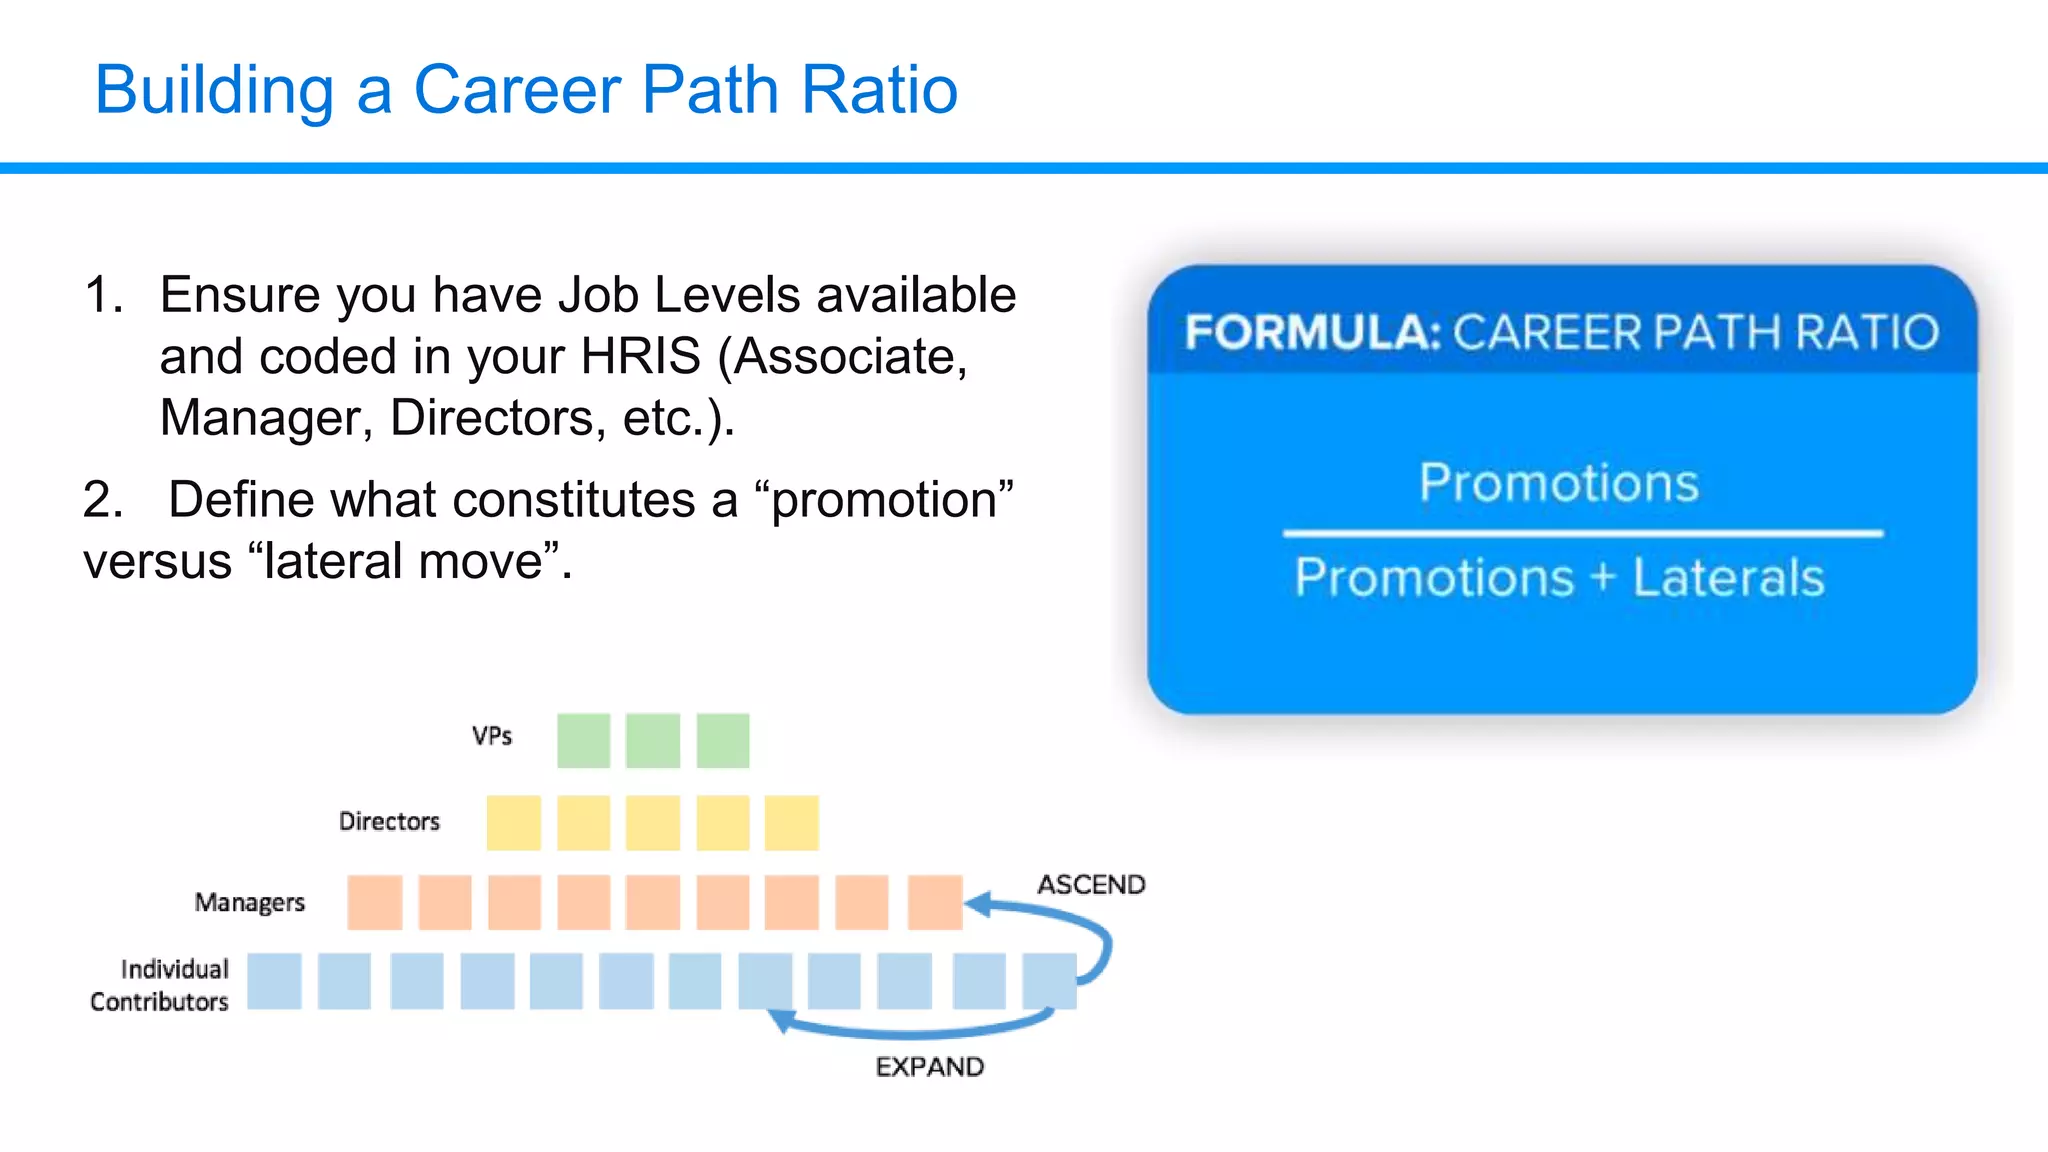
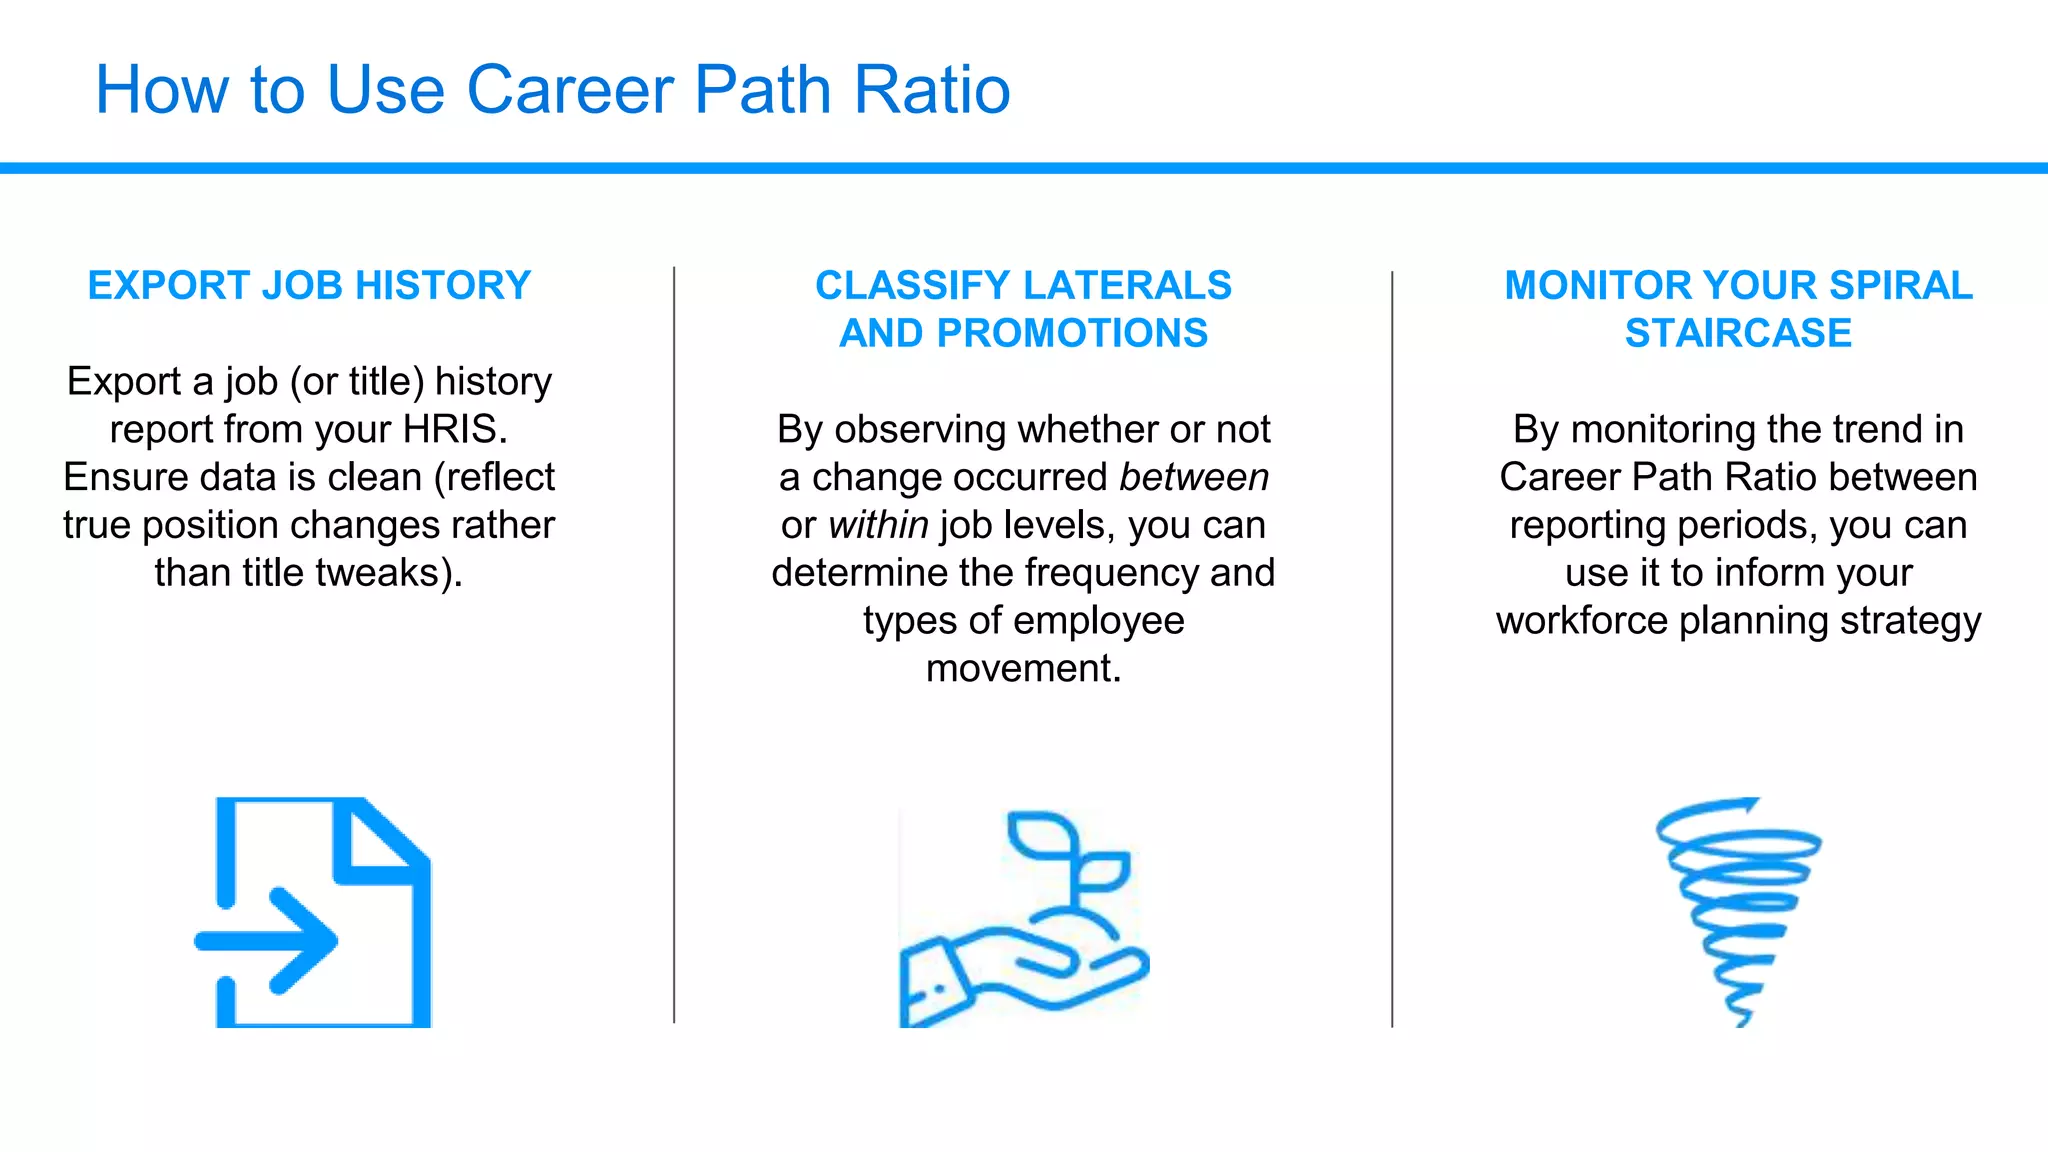
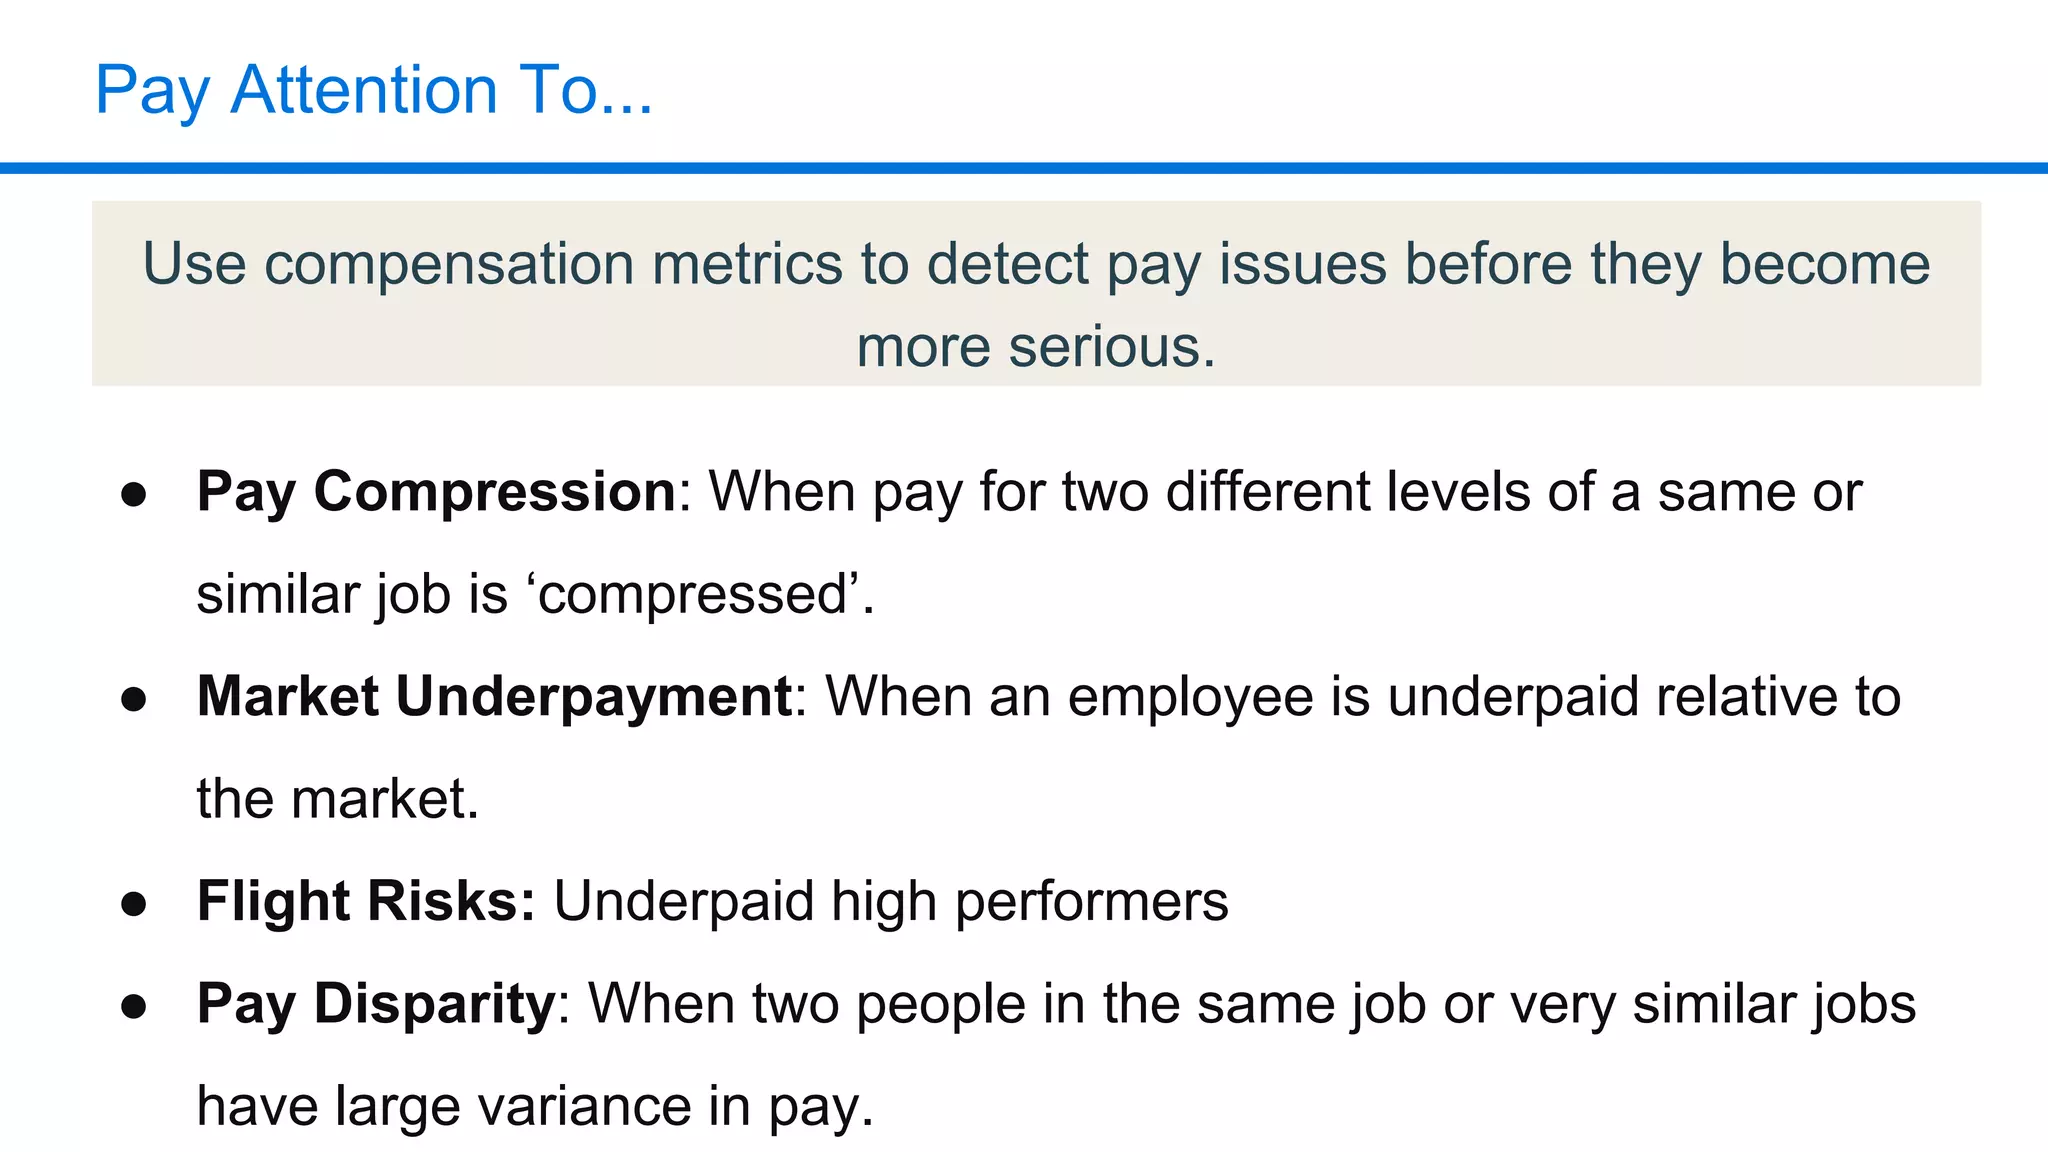
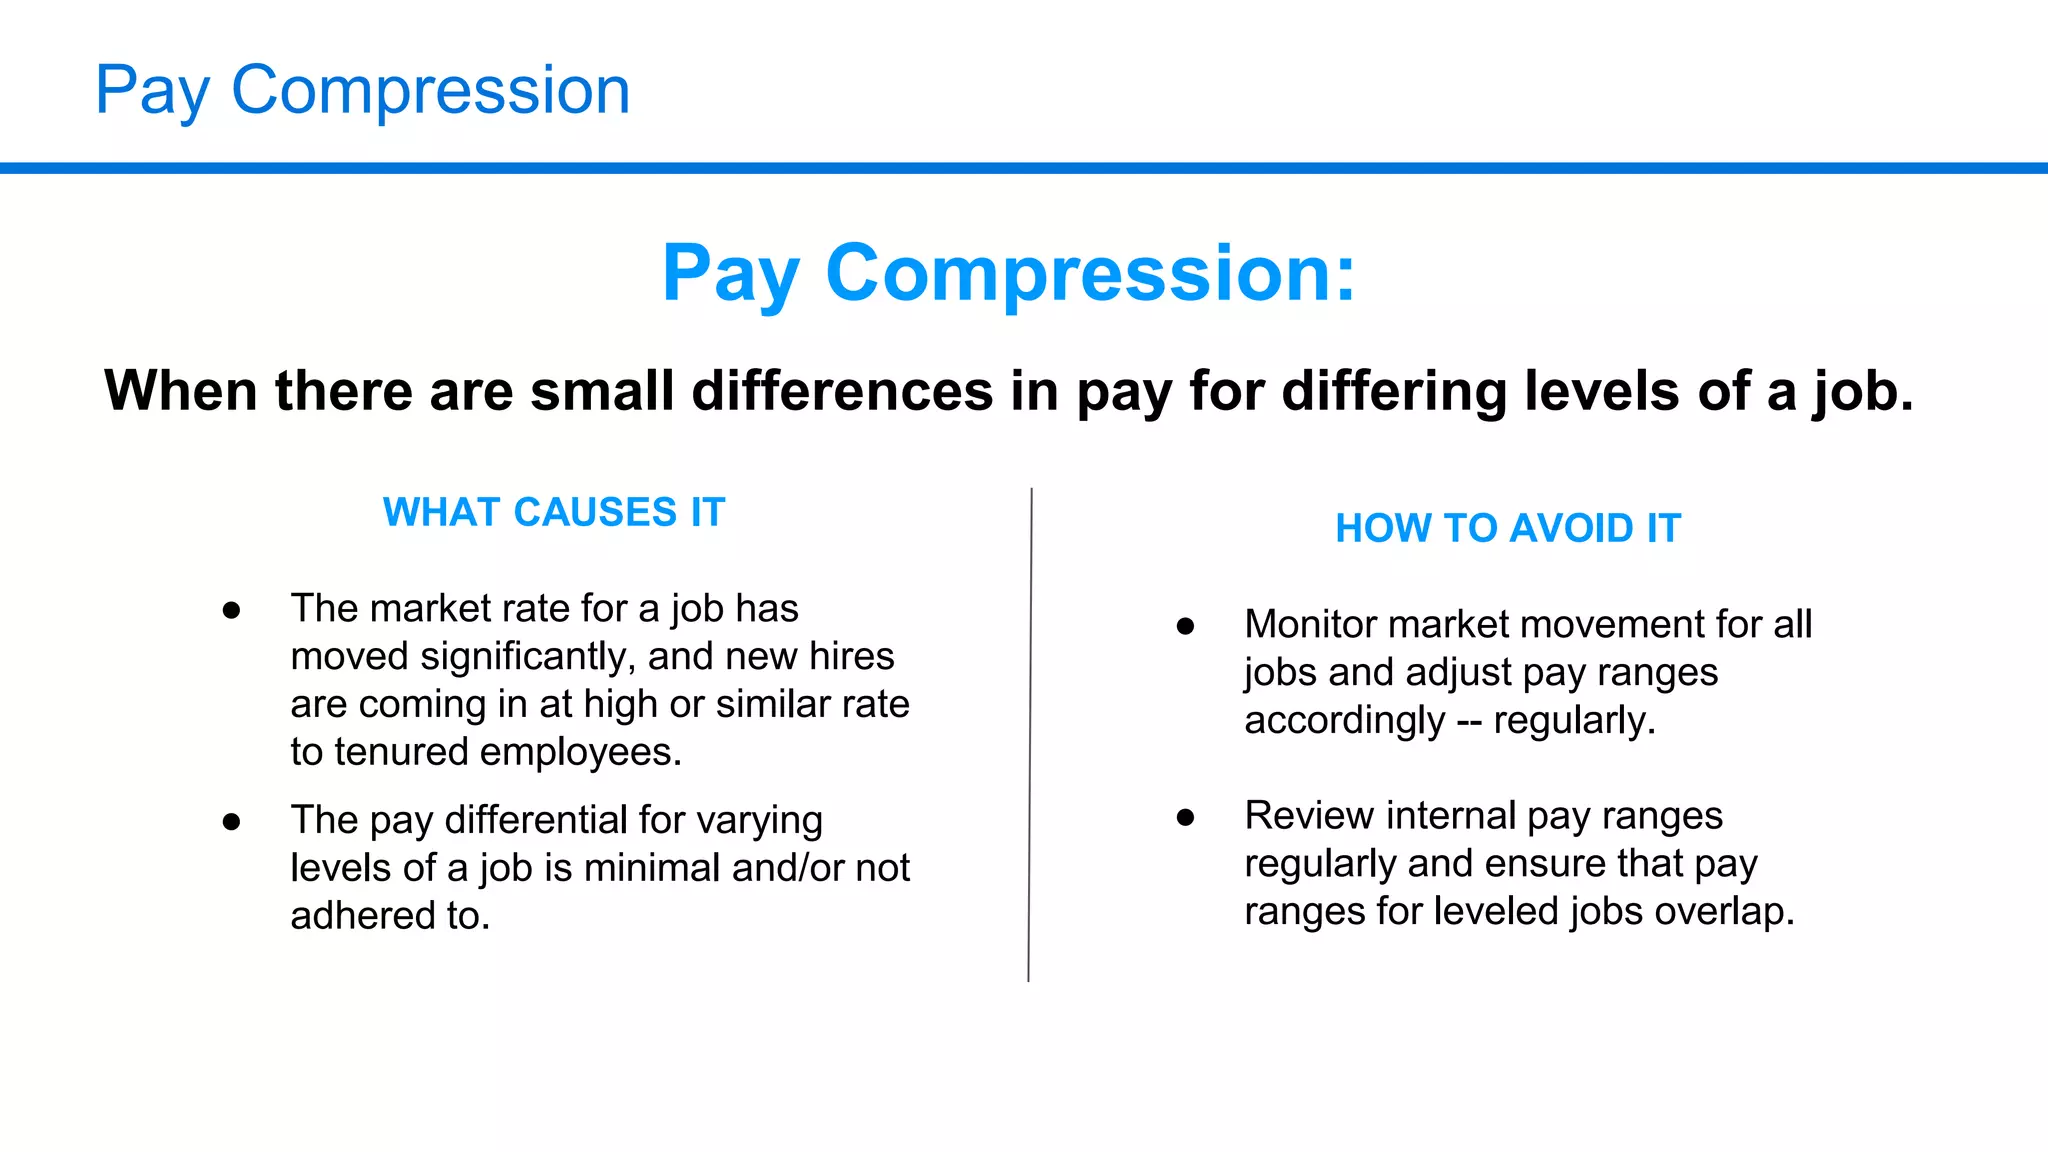
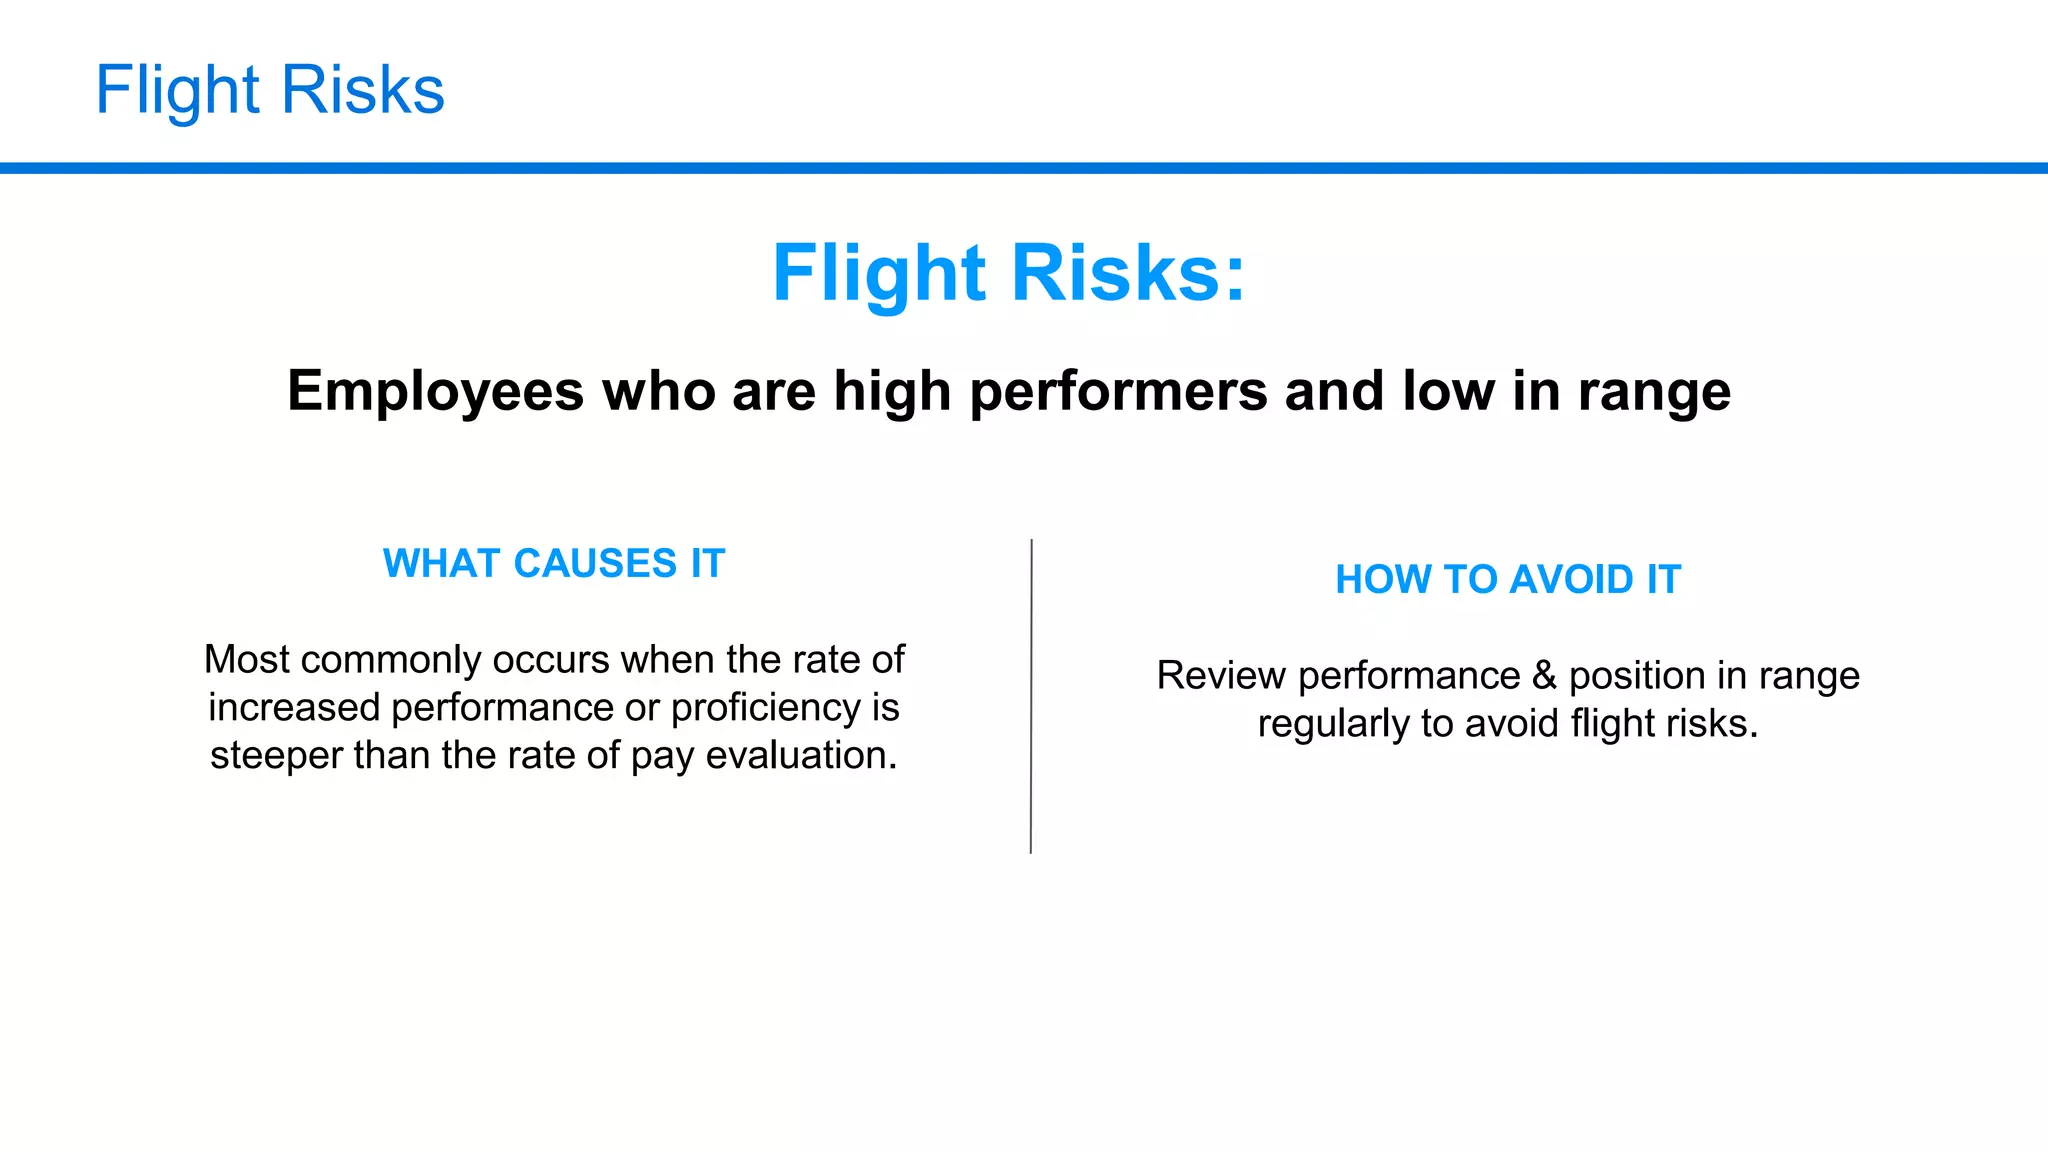
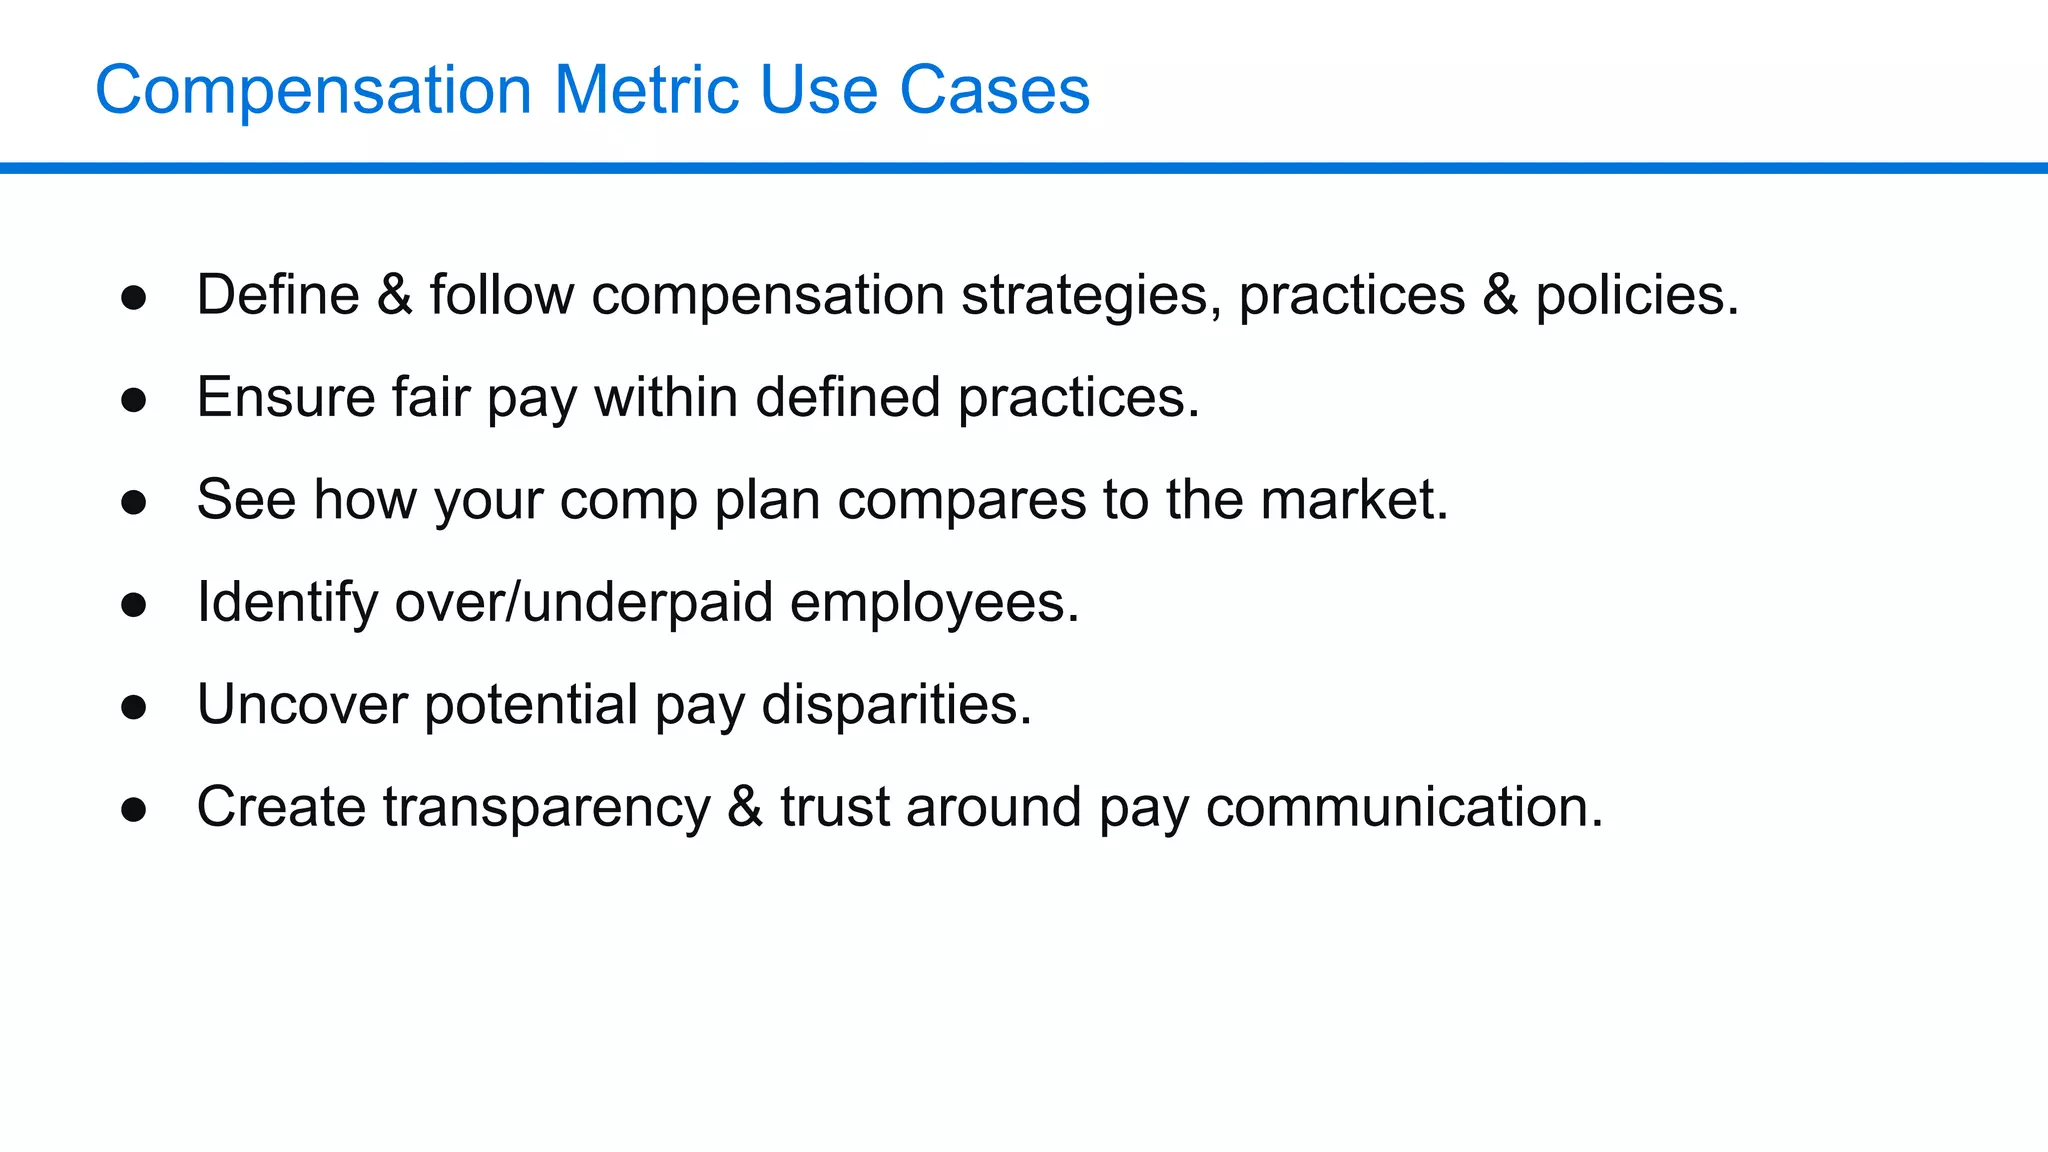
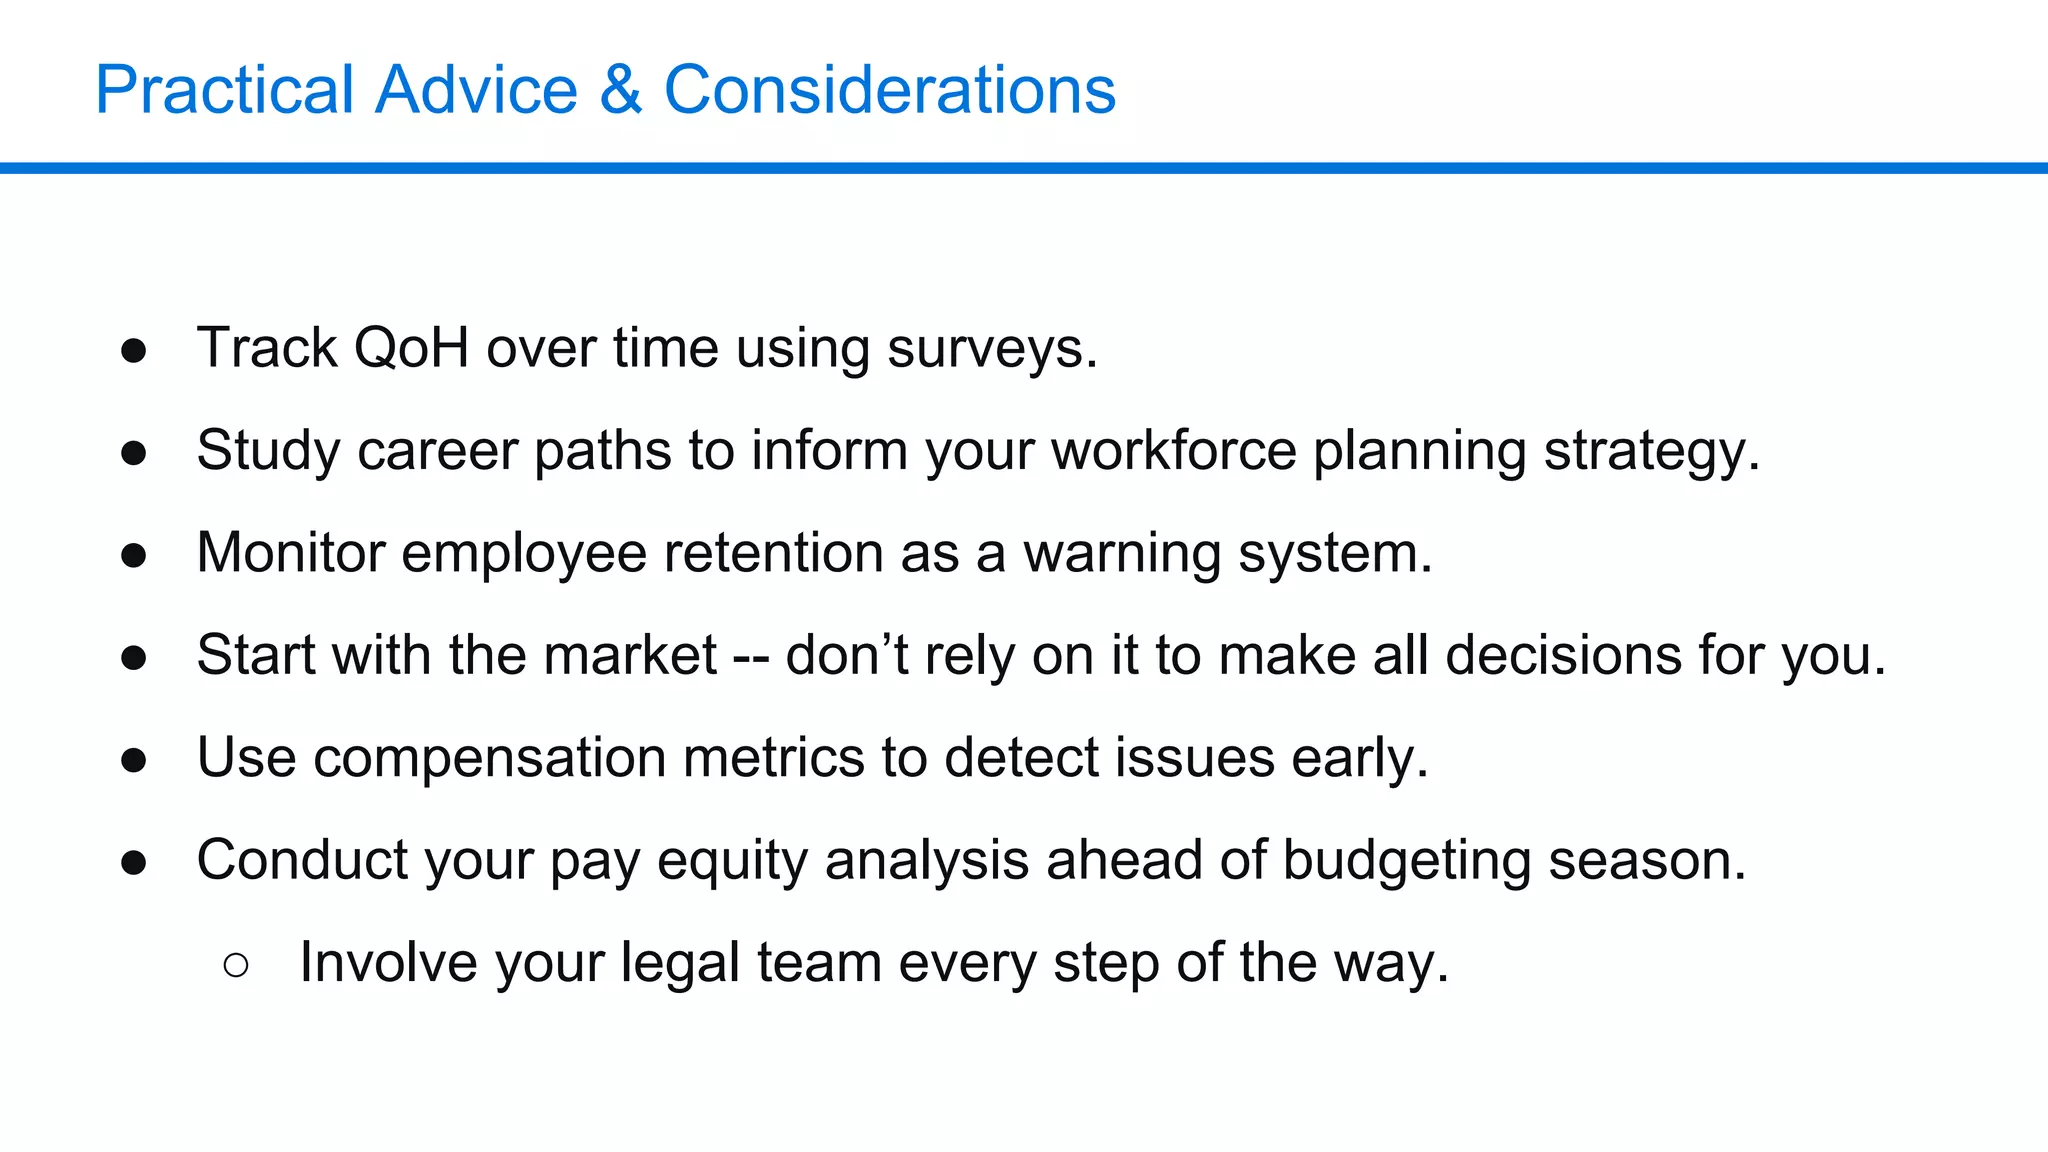
6 Cutting-Edge HR Metrics to
Measure in 2019
January 23, 2019
Agenda
1. People Analytics Maturity
2. Quality of Hire
3. Career Path Ratio
4. Top Performer Retention Rate
5. Comp Ratio
6. Range Penetration
7. Pay Equity
8. Q&A
9. SHRM / HRCI Codes
Presenters
Eric Knudsen
Manager of People
Analytics, Namely
Rita Patterson
Sr. Manager of Product
Implementation, PayScale
People Analytics Maturity
People Analytics Maturity Model
As companies mature, data
becomes increasingly important
to HR teams.
Many teams are taking steps to
make their talent practices more
analytics-driven.
What is People Analytics?
Data vs. Metrics vs. Analytics
People Analytics: Utilizing analytical process across the talent lifecycle
and leveraging data to drive strategic talent decisions.
The Talent Lifecycle We’ll Discuss Today
Finding
Talent
Accelerating
Talent
Retaining
Talent
Compensation & Pay Equity
Finding Talent
Better Hiring Data Allows Us To...
● Identify and hire top talent
● Understand the efficacy and objectivity of
the hiring process
● Facilitate an understanding about which
sources yield top and diverse talent
KEY METRIC:
Quality of Hire
Building a Quality of Hire Metric
1. Identify the critical components of your
quality of hire metric.
2. Build process to collect data for each
one.
3. Measure at the individual level, combine
for the organizational level.
Average of
Performance + Productivity
+
Job Fit + Values Fit
Sample Quality of Hire Survey
1. This person has reached or exceeded the level of productivity
expected after this long on the job.
(Strongly disagree - Strongly agree)
2. How would you rate the overall fit between your new hire's
competencies and the job requirements?
(No fit - Perfect fit)
3. How would you rate your new hire's fit with our values
overall? (No fit - Perfect fit)
4. If this person was interviewing again, I would re-hire him/her as
a bar raiser (i.e., performing greater than 50% of current
employees).
(Not at all - Absolutely)
How to Use Quality of Hire
SEND OUT QoH SURVEYS
At your decided
cadence, send out your
Quality of Hire Survey
to managers of new
hires who have hit their
6-8 week mark.
EXPORT & ANALYZE
Open your survey data
and average your
component scores. Then
calculate your rolled up
metric.
TRACK QoH OVER TIME
Track and actively
monitor trends in QoH
across the organization
and departments.
Partner with Recruiting
to action plan.
Accelerating Talent
Better Career Data Allows Us To...
● Supplement strategic workforce planning
efforts.
● Anticipate the changing shape of your
organization.
● Facilitate tailored employee career
growth.
KEY METRIC:
Career Path Ratio
Building a Career Path Ratio
1. Ensure you have Job Levels available
and coded in your HRIS (Associate,
Manager, Directors, etc.).
2. Define what constitutes a “promotion”
versus “lateral move”.
How to Use Career Path Ratio
EXPORT JOB HISTORY
Export a job (or title) history
report from your HRIS.
Ensure data is clean (reflect
true position changes rather
than title tweaks).
CLASSIFY LATERALS
AND PROMOTIONS
By observing whether or not
a change occurred between
or within job levels, you can
determine the frequency and
types of employee
movement.
MONITOR YOUR SPIRAL
STAIRCASE
By monitoring the trend in
Career Path Ratio between
reporting periods, you can
use it to inform your
workforce planning strategy
Retaining Talent
Better Retention Data Allows Us To...
● Target efforts to engage and retain top
talent.
● Inform HR planning efforts (workforce
planning, compensation, development).
● Balance focus between who’s leaving
and who’s staying.
KEY METRIC:
Top Performer Retention
Rate
Calculating Top Performer Retention
1. Define what it means to be a “top
performer” in your organization.
2. Establish company and department
baselines for top performer retention.
3. Equip managers with retention date, and
help facilitate discussion.
Promotions
Promotions + Laterals
How to Use Top Performer Retention
GATHER PERFORMANCE
AND TERMINATION DATA
Be sure to include Start and
Termination date fields, as
well as any segments of
interest (department).
Supplement with start-of-
period performance ratings.
COMPARE OVERALL &
TOP PERF. RETENTION
Calculate company-wide
retention, then filter to top
performers and re-calculate.
Compare these numbers to
identify gaps in retention
strategy.
USE RETENTION AS A
WARNING SYSTEM
If top performers have lower
or declining retention, drill
down for insight. Act fast,
but thoughtfully and
meaningfully.
Compensation Metrics
Pay Attention To...
Use compensation metrics to detect pay issues before they become
more serious.
● Pay Compression: When pay for two different levels of a same or
similar job is ‘compressed’.
● Market Underpayment: When an employee is underpaid relative to
the market.
● Flight Risks: Underpaid high performers
● Pay Disparity: When two people in the same job or very similar jobs
have large variance in pay.
Pay Compression
Pay Compression:
When there are small differences in pay for differing levels of a job.
WHAT CAUSES IT
● The market rate for a job has
moved significantly, and new hires
are coming in at high or similar rate
to tenured employees.
● The pay differential for varying
levels of a job is minimal and/or not
adhered to.
HOW TO AVOID IT
● Monitor market movement for all
jobs and adjust pay ranges
accordingly -- regularly.
● Review internal pay ranges
regularly and ensure that pay
ranges for leveled jobs overlap.
Market Underpayment
● Define your “competitive” set (location, industry, org type and org
size).
● Benchmark your jobs to other similar roles in the market to identify the
“going rate” for a position.
● Create pay ranges based on market rate & internal value of a role.
● Align pay for all employees in the same or similar job within the
market base pay range.
To avoid market underpayment, regularly benchmark your
positions to the market.
Flight Risks
WHAT CAUSES IT
Most commonly occurs when the rate of
increased performance or proficiency is
steeper than the rate of pay evaluation.
HOW TO AVOID IT
Review performance & position in range
regularly to avoid flight risks.
Flight Risks:
Employees who are high performers and low in range
Comp Ratio and Range
Penetration
Measuring Position in Range
Employee’s current salary
The current mid point of the
internal pay range
(Employee salary - range min.)
(Range max. - range min.)
Comp Ratio
Comp Ratio by Job Family
Range Penetration
How to Use Comp Ratio and Range Penetration
PICK ONE METRIC AND
CREATE FAMILIARITY
AROUND IT
Range penetration is going to land
more simply with managers &
employees.
Stick with comp ratio if its how your
finance & comp teams regularly talk
about it.
HAVE GUIDELINES FOR
HOW TO MOVE
EMPLOYEES THROUGH
THE RANGE
Be realistic about the financial
implications of these
guidelines.
EMPLOYEES LOW AND
HIGH IN RANGE
Evaluate whether this is
indicative of pay inequality, or
relevant based on the employee’s
tenure or performance.
Confirm and acknowledge the
reasoning for their higher pay.
Pay Equity
Pay Equity Can Make (Or Break) Your Brand
Pay Disparity
THINGS TO CONSIDER:
● Is the variance of pay reasonable?
○ Are tenure, performance, or other factors tied to pay
differences?
● Are these employees really in the same job?
○ Is one more senior than the other?
○ Is one in a newly created role that needs to be defined and
benchmarked?
Pay Disparity:
When two people in the same job or very similar jobs have large
variance in pay.
Conducting Pay Equity Analysis
IDENTIFY GAPS IN PAY
Identify pay gaps hidden
within certain job titles or
departments.
Identify underpaid high
performers and overpaid low
performers.
ASSESS SIGNIFICANT
DIFFERENCES
Take a look at major
differences in promotion
rates, raise frequencies,
amounts, and/or bonus
eligibility for similar
employees doing similar
work.
REVIEW THE GENDER
GAP
Review men and women
who do similar work at
different levels or pay rates.
Gender Equity Report
Job Group Gender Equity Report
Communicating Pay
Share compensation reports with employees to facilitate open and honest conversations about
pay and career trajectory.
Compensation Metric Use Cases
● Define & follow compensation strategies, practices & policies.
● Ensure fair pay within defined practices.
● See how your comp plan compares to the market.
● Identify over/underpaid employees.
● Uncover potential pay disparities.
● Create transparency & trust around pay communication.
Practical Advice & Considerations
● Track QoH over time using surveys.
● Study career paths to inform your workforce planning strategy.
● Monitor employee retention as a warning system.
● Start with the market -- don’t rely on it to make all decisions for you.
● Use compensation metrics to detect issues early.
● Conduct your pay equity analysis ahead of budgeting season.
○ Involve your legal team every step of the way.
NAMELY QUARTERLY
UPDATE
NAMELY QUARTERLY
UPDATE
Questions

6 Cutting-Edge HR Metrics to Measure in 2019

  • 1.
    6 Cutting-Edge HRMetrics to Measure in 2019 January 23, 2019
  • 2.
    Agenda 1. People AnalyticsMaturity 2. Quality of Hire 3. Career Path Ratio 4. Top Performer Retention Rate 5. Comp Ratio 6. Range Penetration 7. Pay Equity 8. Q&A 9. SHRM / HRCI Codes
  • 3.
    Presenters Eric Knudsen Manager ofPeople Analytics, Namely Rita Patterson Sr. Manager of Product Implementation, PayScale
  • 4.
  • 5.
    People Analytics MaturityModel As companies mature, data becomes increasingly important to HR teams. Many teams are taking steps to make their talent practices more analytics-driven.
  • 6.
    What is PeopleAnalytics?
  • 7.
    Data vs. Metricsvs. Analytics People Analytics: Utilizing analytical process across the talent lifecycle and leveraging data to drive strategic talent decisions.
  • 8.
    The Talent LifecycleWe’ll Discuss Today Finding Talent Accelerating Talent Retaining Talent Compensation & Pay Equity
  • 9.
  • 10.
    Better Hiring DataAllows Us To... ● Identify and hire top talent ● Understand the efficacy and objectivity of the hiring process ● Facilitate an understanding about which sources yield top and diverse talent KEY METRIC: Quality of Hire
  • 11.
    Building a Qualityof Hire Metric 1. Identify the critical components of your quality of hire metric. 2. Build process to collect data for each one. 3. Measure at the individual level, combine for the organizational level. Average of Performance + Productivity + Job Fit + Values Fit
  • 12.
    Sample Quality ofHire Survey 1. This person has reached or exceeded the level of productivity expected after this long on the job. (Strongly disagree - Strongly agree) 2. How would you rate the overall fit between your new hire's competencies and the job requirements? (No fit - Perfect fit) 3. How would you rate your new hire's fit with our values overall? (No fit - Perfect fit) 4. If this person was interviewing again, I would re-hire him/her as a bar raiser (i.e., performing greater than 50% of current employees). (Not at all - Absolutely)
  • 13.
    How to UseQuality of Hire SEND OUT QoH SURVEYS At your decided cadence, send out your Quality of Hire Survey to managers of new hires who have hit their 6-8 week mark. EXPORT & ANALYZE Open your survey data and average your component scores. Then calculate your rolled up metric. TRACK QoH OVER TIME Track and actively monitor trends in QoH across the organization and departments. Partner with Recruiting to action plan.
  • 14.
  • 15.
    Better Career DataAllows Us To... ● Supplement strategic workforce planning efforts. ● Anticipate the changing shape of your organization. ● Facilitate tailored employee career growth. KEY METRIC: Career Path Ratio
  • 16.
    Building a CareerPath Ratio 1. Ensure you have Job Levels available and coded in your HRIS (Associate, Manager, Directors, etc.). 2. Define what constitutes a “promotion” versus “lateral move”.
  • 17.
    How to UseCareer Path Ratio EXPORT JOB HISTORY Export a job (or title) history report from your HRIS. Ensure data is clean (reflect true position changes rather than title tweaks). CLASSIFY LATERALS AND PROMOTIONS By observing whether or not a change occurred between or within job levels, you can determine the frequency and types of employee movement. MONITOR YOUR SPIRAL STAIRCASE By monitoring the trend in Career Path Ratio between reporting periods, you can use it to inform your workforce planning strategy
  • 18.
  • 19.
    Better Retention DataAllows Us To... ● Target efforts to engage and retain top talent. ● Inform HR planning efforts (workforce planning, compensation, development). ● Balance focus between who’s leaving and who’s staying. KEY METRIC: Top Performer Retention Rate
  • 20.
    Calculating Top PerformerRetention 1. Define what it means to be a “top performer” in your organization. 2. Establish company and department baselines for top performer retention. 3. Equip managers with retention date, and help facilitate discussion. Promotions Promotions + Laterals
  • 21.
    How to UseTop Performer Retention GATHER PERFORMANCE AND TERMINATION DATA Be sure to include Start and Termination date fields, as well as any segments of interest (department). Supplement with start-of- period performance ratings. COMPARE OVERALL & TOP PERF. RETENTION Calculate company-wide retention, then filter to top performers and re-calculate. Compare these numbers to identify gaps in retention strategy. USE RETENTION AS A WARNING SYSTEM If top performers have lower or declining retention, drill down for insight. Act fast, but thoughtfully and meaningfully.
  • 22.
  • 23.
    Pay Attention To... Usecompensation metrics to detect pay issues before they become more serious. ● Pay Compression: When pay for two different levels of a same or similar job is ‘compressed’. ● Market Underpayment: When an employee is underpaid relative to the market. ● Flight Risks: Underpaid high performers ● Pay Disparity: When two people in the same job or very similar jobs have large variance in pay.
  • 24.
    Pay Compression Pay Compression: Whenthere are small differences in pay for differing levels of a job. WHAT CAUSES IT ● The market rate for a job has moved significantly, and new hires are coming in at high or similar rate to tenured employees. ● The pay differential for varying levels of a job is minimal and/or not adhered to. HOW TO AVOID IT ● Monitor market movement for all jobs and adjust pay ranges accordingly -- regularly. ● Review internal pay ranges regularly and ensure that pay ranges for leveled jobs overlap.
  • 25.
    Market Underpayment ● Defineyour “competitive” set (location, industry, org type and org size). ● Benchmark your jobs to other similar roles in the market to identify the “going rate” for a position. ● Create pay ranges based on market rate & internal value of a role. ● Align pay for all employees in the same or similar job within the market base pay range. To avoid market underpayment, regularly benchmark your positions to the market.
  • 26.
    Flight Risks WHAT CAUSESIT Most commonly occurs when the rate of increased performance or proficiency is steeper than the rate of pay evaluation. HOW TO AVOID IT Review performance & position in range regularly to avoid flight risks. Flight Risks: Employees who are high performers and low in range
  • 27.
    Comp Ratio andRange Penetration
  • 28.
    Measuring Position inRange Employee’s current salary The current mid point of the internal pay range (Employee salary - range min.) (Range max. - range min.)
  • 29.
  • 30.
    Comp Ratio byJob Family
  • 31.
  • 32.
    How to UseComp Ratio and Range Penetration PICK ONE METRIC AND CREATE FAMILIARITY AROUND IT Range penetration is going to land more simply with managers & employees. Stick with comp ratio if its how your finance & comp teams regularly talk about it. HAVE GUIDELINES FOR HOW TO MOVE EMPLOYEES THROUGH THE RANGE Be realistic about the financial implications of these guidelines. EMPLOYEES LOW AND HIGH IN RANGE Evaluate whether this is indicative of pay inequality, or relevant based on the employee’s tenure or performance. Confirm and acknowledge the reasoning for their higher pay.
  • 33.
  • 34.
    Pay Equity CanMake (Or Break) Your Brand
  • 35.
    Pay Disparity THINGS TOCONSIDER: ● Is the variance of pay reasonable? ○ Are tenure, performance, or other factors tied to pay differences? ● Are these employees really in the same job? ○ Is one more senior than the other? ○ Is one in a newly created role that needs to be defined and benchmarked? Pay Disparity: When two people in the same job or very similar jobs have large variance in pay.
  • 36.
    Conducting Pay EquityAnalysis IDENTIFY GAPS IN PAY Identify pay gaps hidden within certain job titles or departments. Identify underpaid high performers and overpaid low performers. ASSESS SIGNIFICANT DIFFERENCES Take a look at major differences in promotion rates, raise frequencies, amounts, and/or bonus eligibility for similar employees doing similar work. REVIEW THE GENDER GAP Review men and women who do similar work at different levels or pay rates.
  • 37.
  • 38.
    Job Group GenderEquity Report
  • 39.
    Communicating Pay Share compensationreports with employees to facilitate open and honest conversations about pay and career trajectory.
  • 40.
    Compensation Metric UseCases ● Define & follow compensation strategies, practices & policies. ● Ensure fair pay within defined practices. ● See how your comp plan compares to the market. ● Identify over/underpaid employees. ● Uncover potential pay disparities. ● Create transparency & trust around pay communication.
  • 41.
    Practical Advice &Considerations ● Track QoH over time using surveys. ● Study career paths to inform your workforce planning strategy. ● Monitor employee retention as a warning system. ● Start with the market -- don’t rely on it to make all decisions for you. ● Use compensation metrics to detect issues early. ● Conduct your pay equity analysis ahead of budgeting season. ○ Involve your legal team every step of the way.
  • 42.
  • 43.