Download as PDF, PPTX


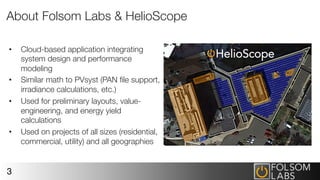
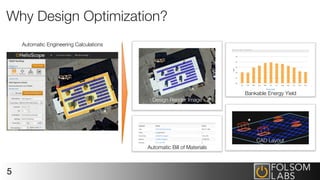


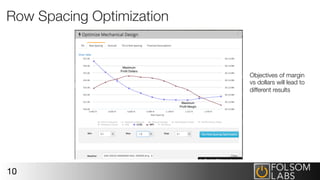
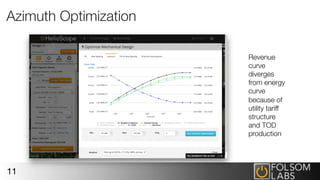
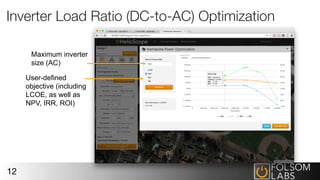
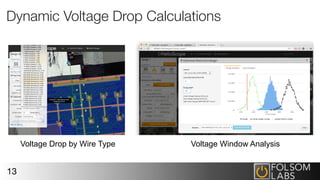
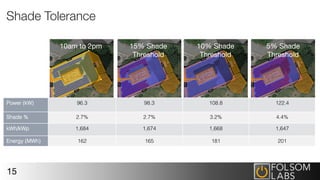


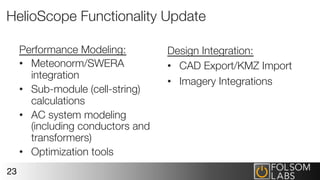
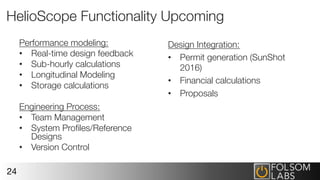
This document discusses design optimization in HelioScope, a cloud-based solar design and modeling tool. It begins with an overview of HelioScope and its capabilities for layout, energy yield calculation, and financial analysis. Various design optimization techniques in HelioScope are then described, including shading analysis, row spacing optimization, azimuth optimization, and wiring optimization. Research results are also presented on topics like shade tolerance, effects of tilt angle, and east-west racking. The document concludes with an update on new and upcoming functionality in HelioScope.