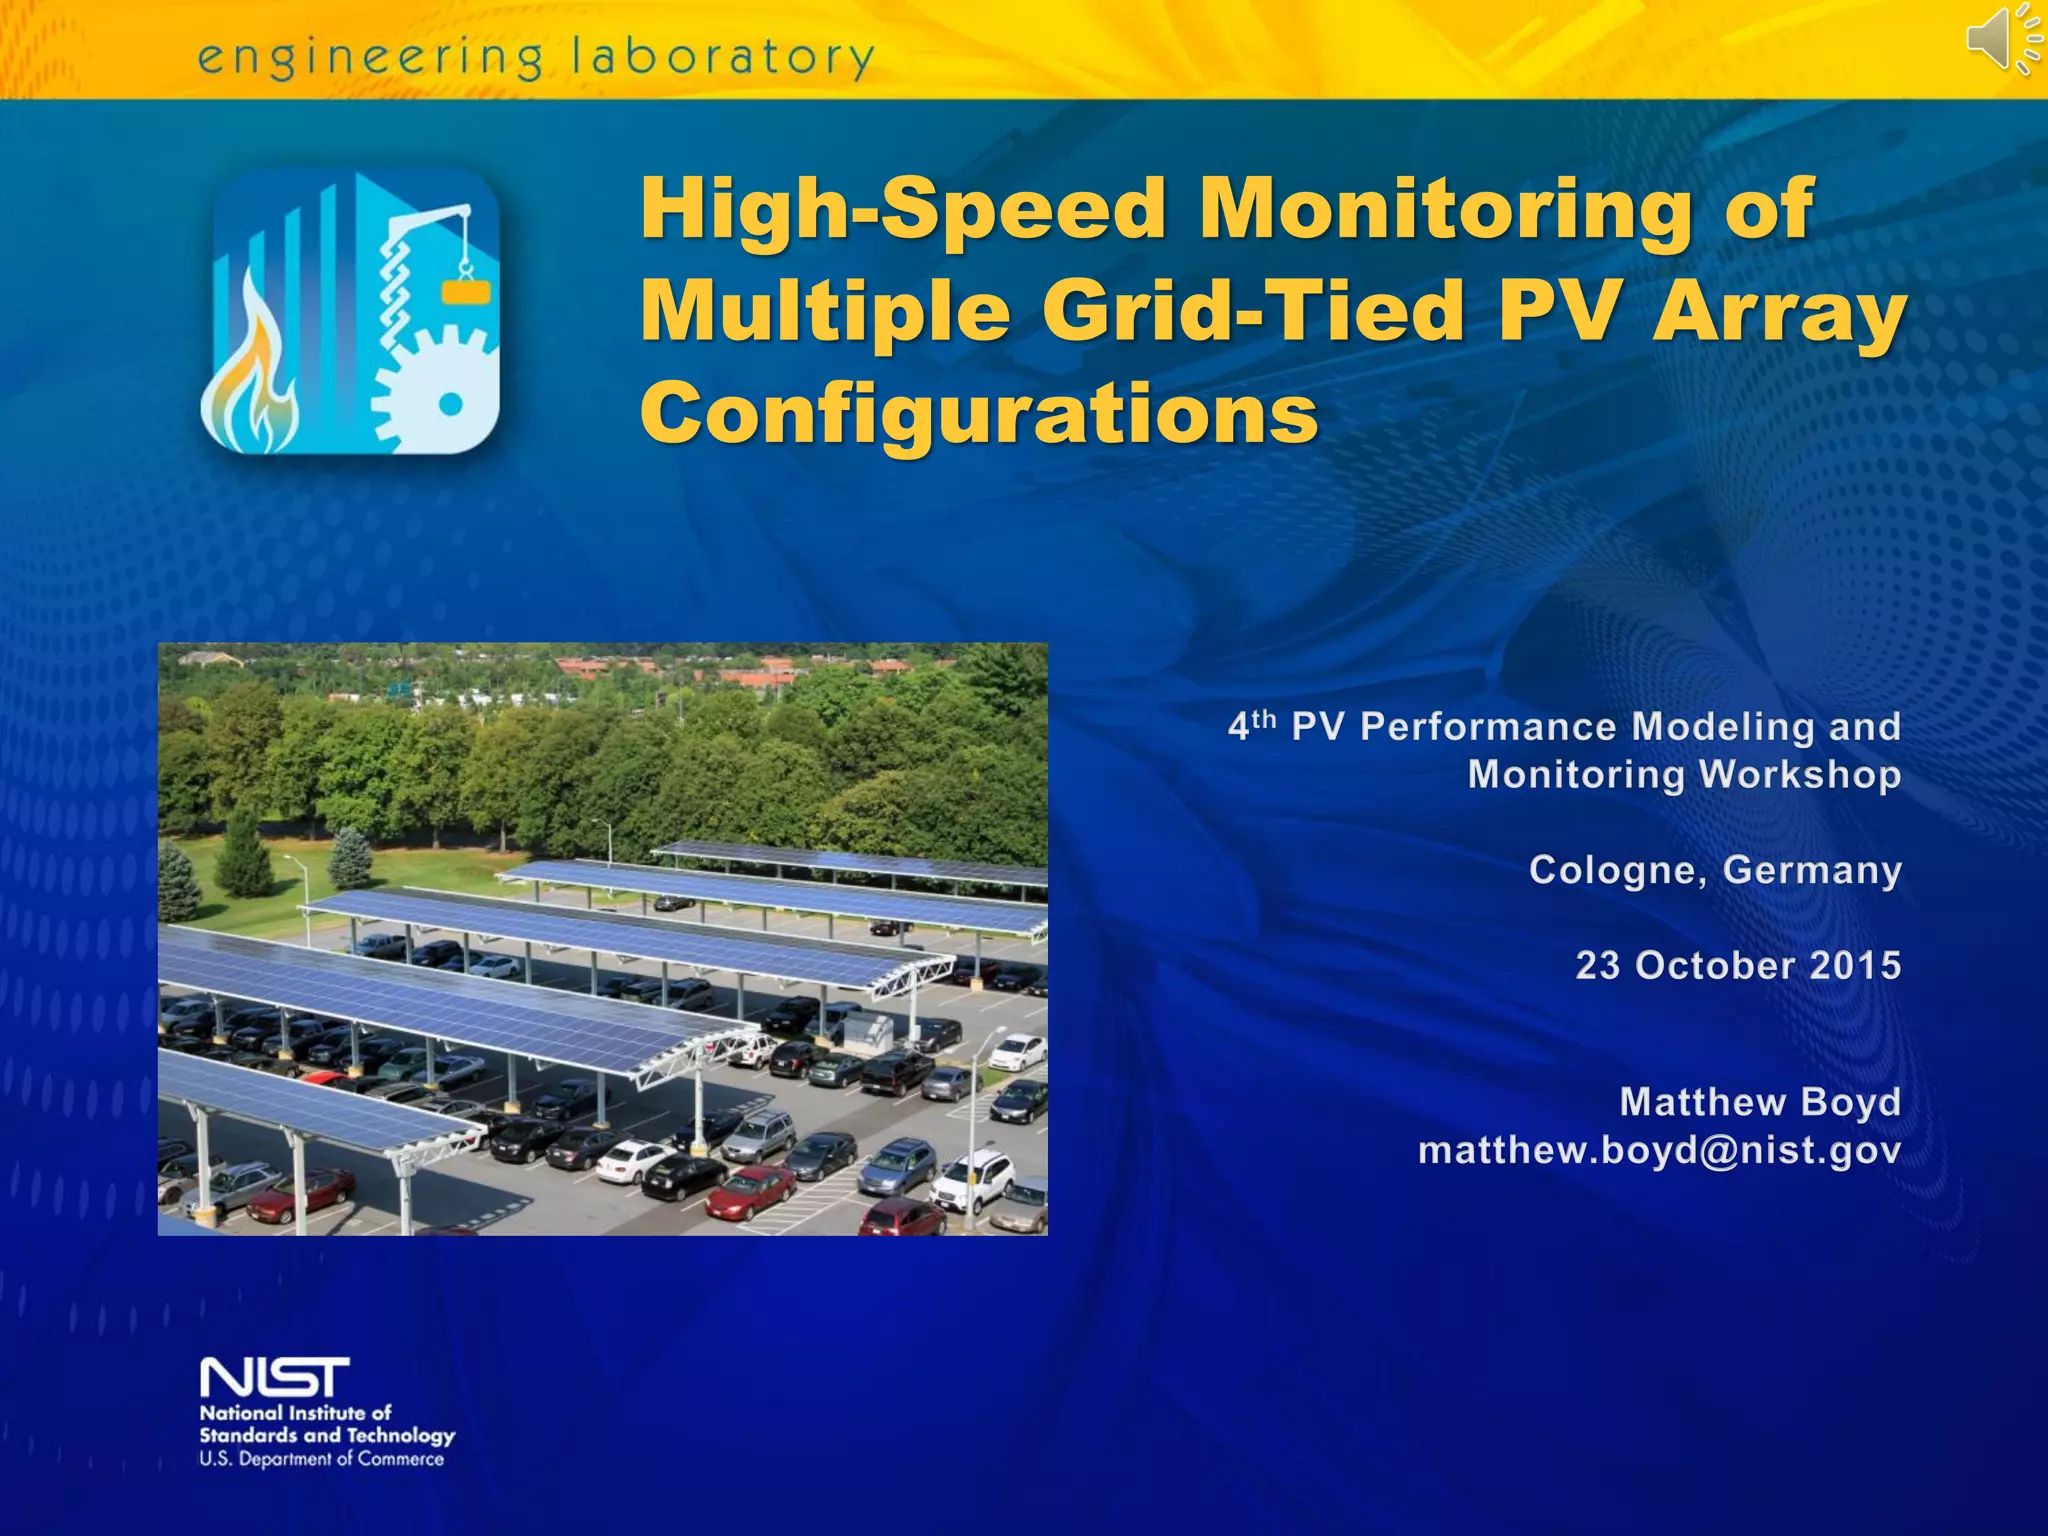
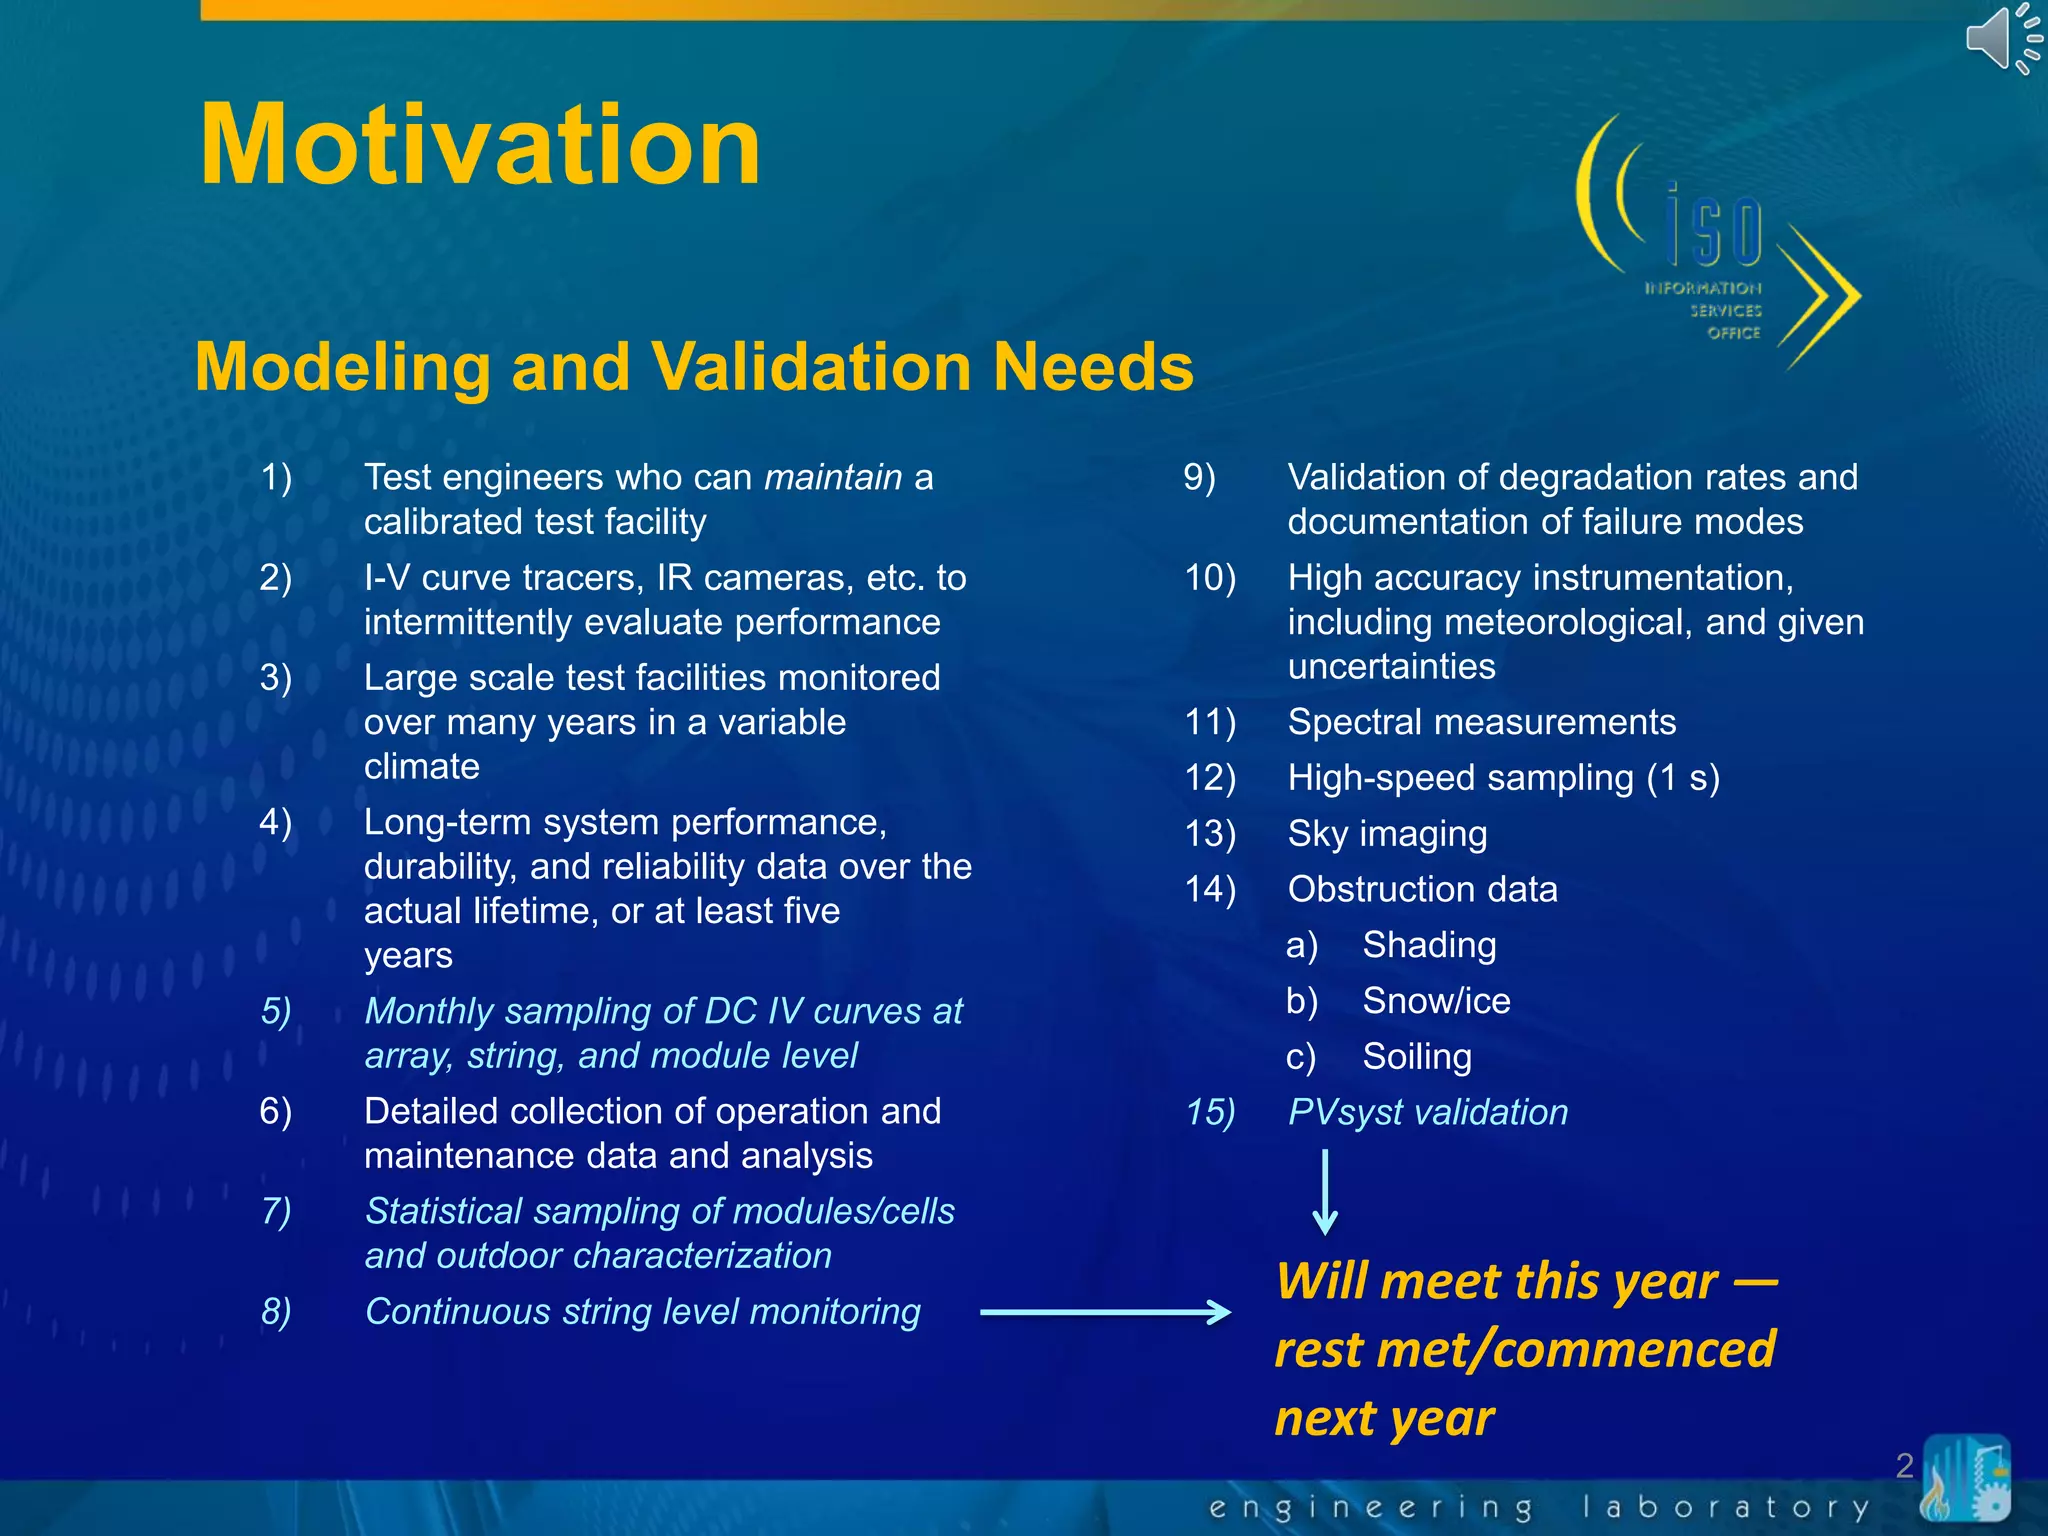
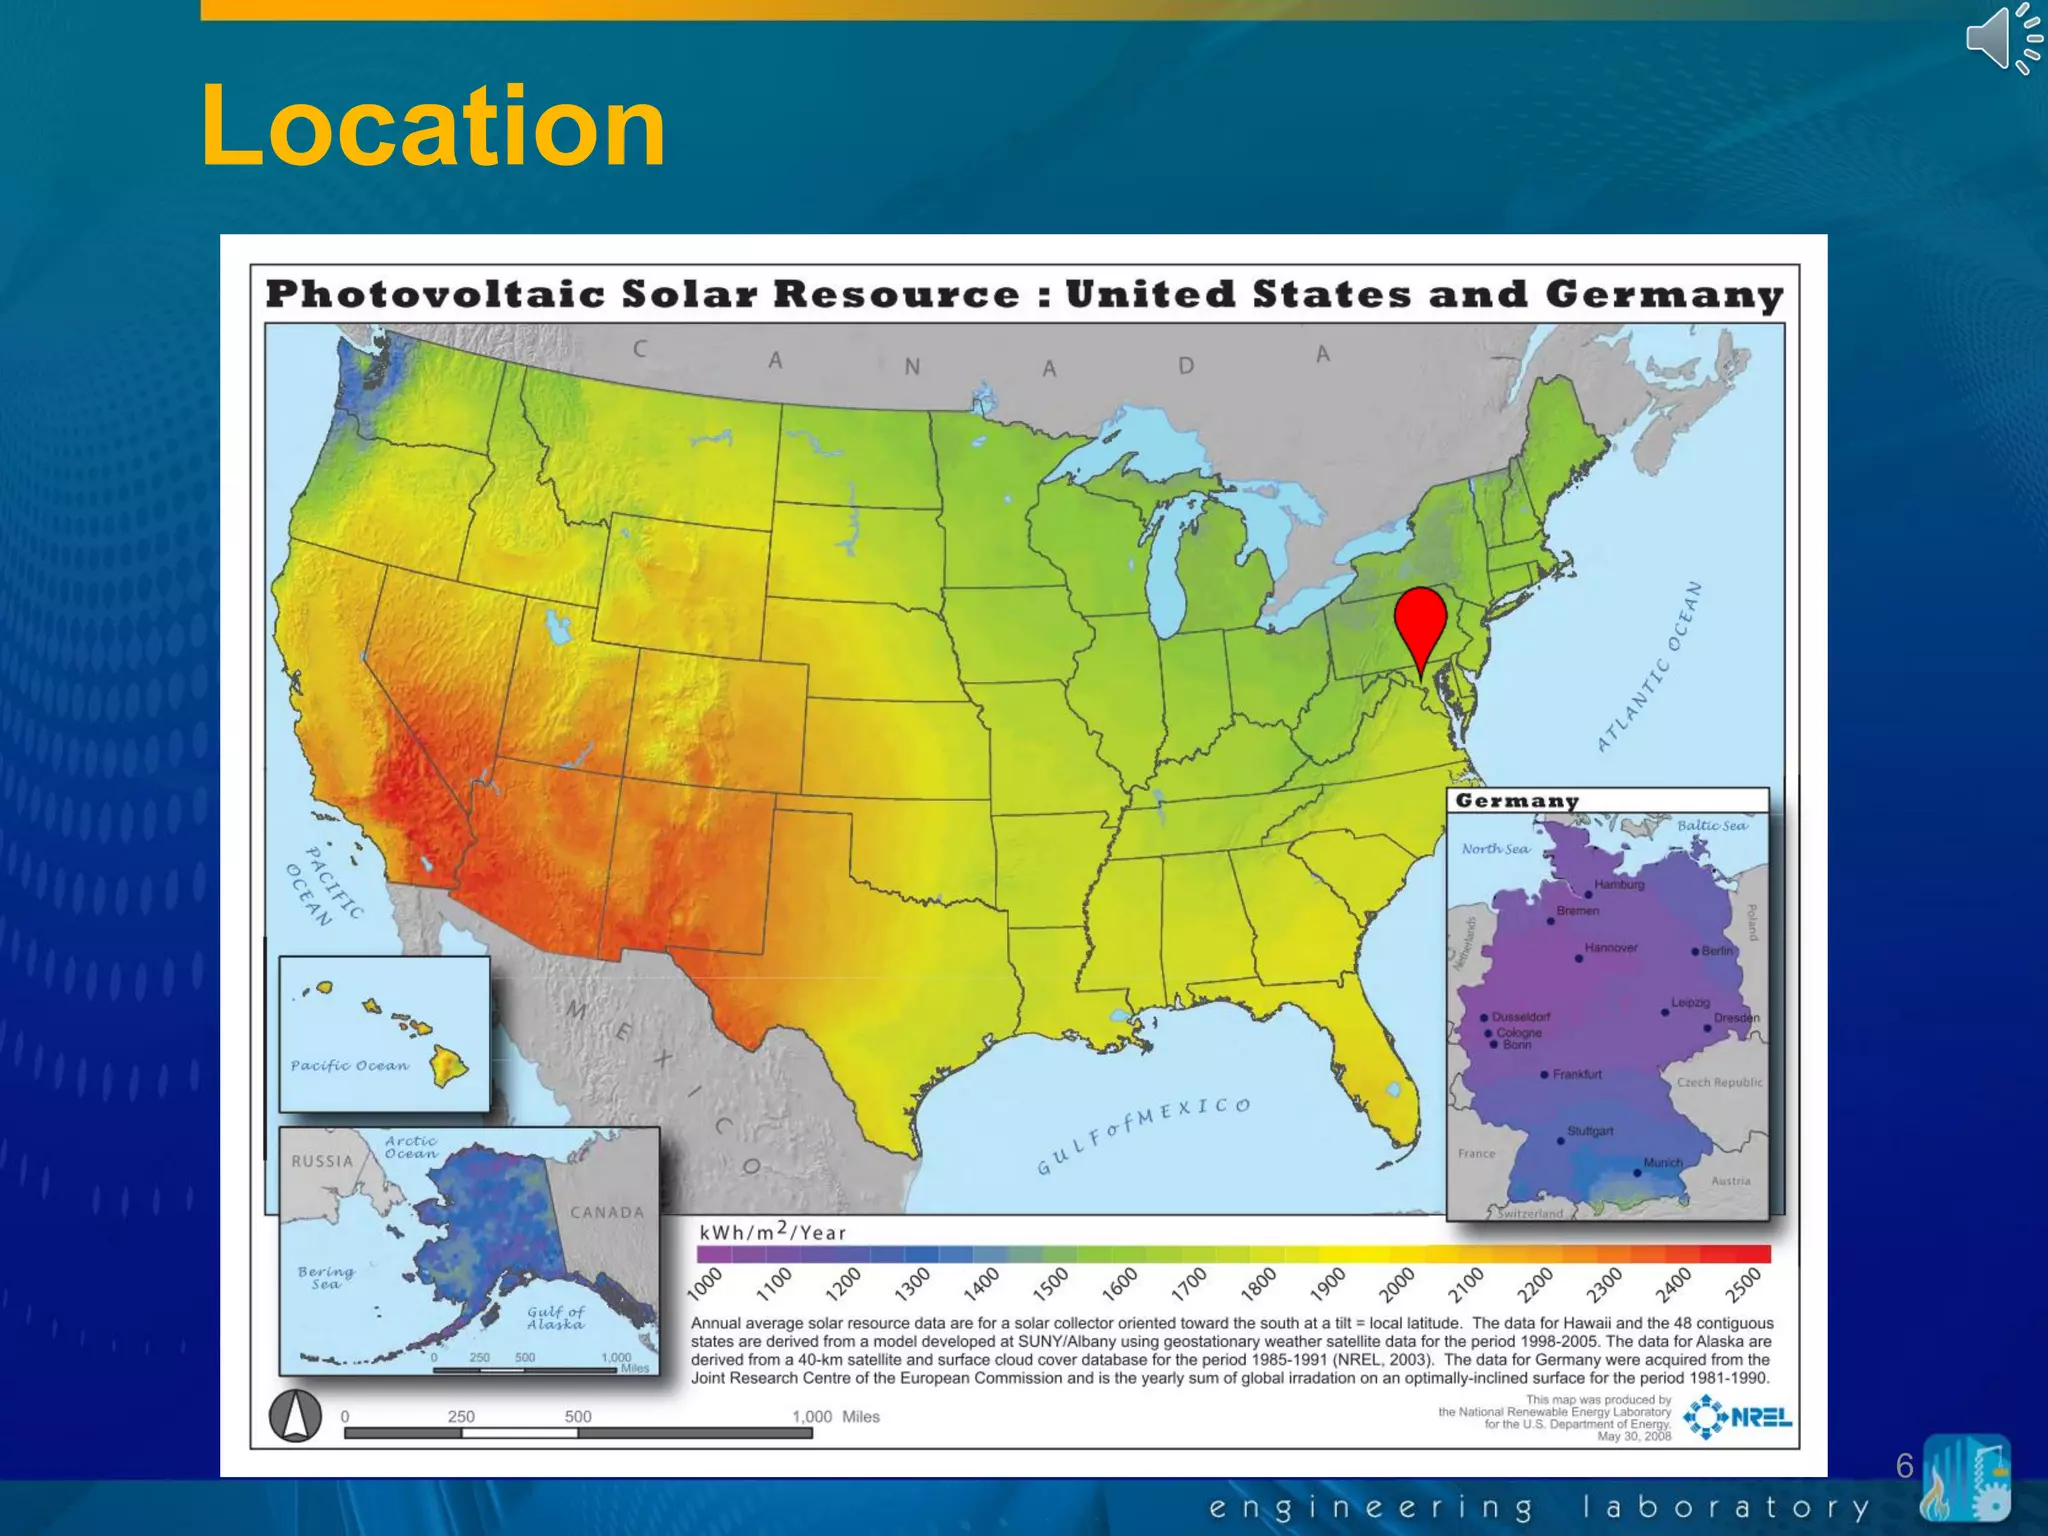
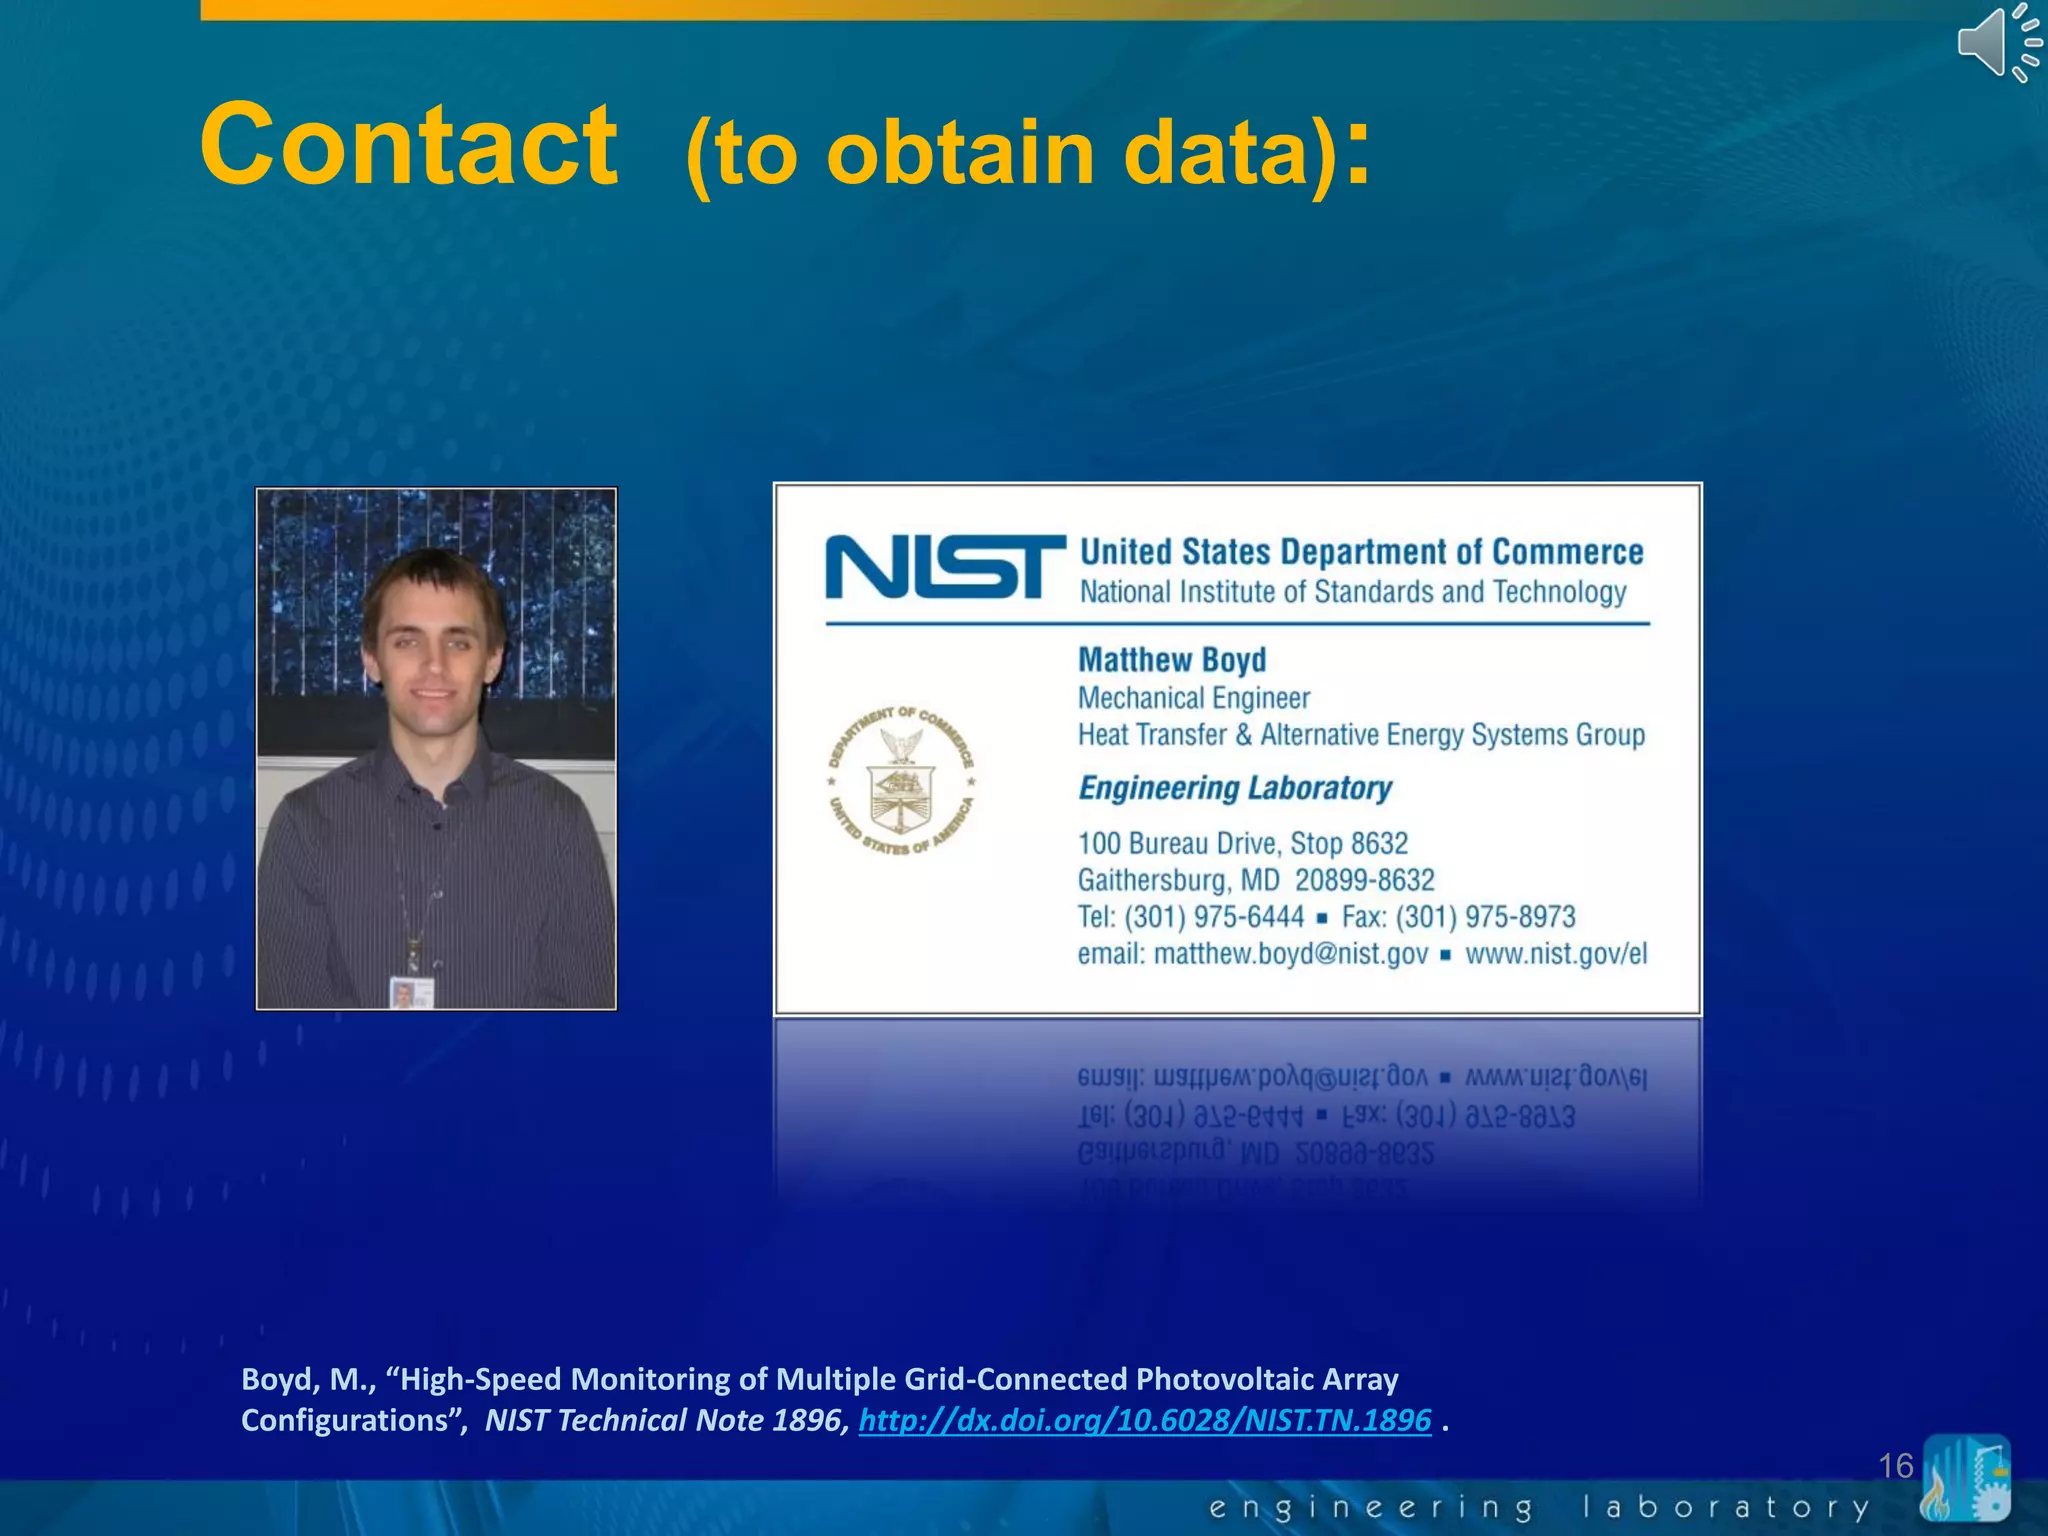
High-Speed Monitoring of
Multiple Grid-Tied PV Array
Configurations
Motivation
2
1) Test engineers who can maintain a
calibrated test facility
2) I-V curve tracers, IR cameras, etc. to
intermittently evaluate performance
3) Large scale test facilities monitored
over many years in a variable
climate
4) Long-term system performance,
durability, and reliability data over the
actual lifetime, or at least five
years
5) Monthly sampling of DC IV curves at
array, string, and module level
6) Detailed collection of operation and
maintenance data and analysis
7) Statistical sampling of modules/cells
and outdoor characterization
8) Continuous string level monitoring
9) Validation of degradation rates and
documentation of failure modes
10) High accuracy instrumentation,
including meteorological, and given
uncertainties
11) Spectral measurements
12) High-speed sampling (1 s)
13) Sky imaging
14) Obstruction data
a) Shading
b) Snow/ice
c) Soiling
15) PVsyst validation
Modeling and Validation Needs
Will meet this year —
rest met/commenced
next year
Motivation (cont.)
3
1) Ability to examine:
a) Inverter MPPT speed,
accuracy, modes of
operation
b) Anti-islanding test
perturbations
c) Effects of fast moving
clouds
d) Causes of module and
BOS component failures
e) Dynamic electrical
effects from irradiance
enhancement and
transitions
2) More accurate mean
power and energy yield
values
3) Identify fluctuating DC
offsets from aliasing errors
4) Validation of
a) Short-term irradiance
forecasting
b) Inverter/grid interaction
models
High-Speed Sampling (1 Hz)
Locations
4
(271 kW, 20° tilt)
(243 kW, ±5° W/E)
(73 kW, 10° tilt)
Locations
5
Canopy Array
• Commissioned June 2012
• 1032 Mono-Si Modules
• 243 kW (DC rated)
• 5° East/West
Ground Array
• Commissioned July 2012
• 1152 Mono-Si Modules
• 271 kW (DC rated)
• 20° due south
Tilted Roof Array
• Commissioned June 2012
• 312 Mono-Si Modules
• 73 kW (DC rated)
• 10° due south
Horizontal Roof Array
• Commissioned September 2001
• 234 Mono-Si Modules
• 35 kW (DC rated)
Weather Station
• Commissioned August 2014
• Shortwave, Longwave, UV,
Spectral
• DNI, DHI on Solar Tracker
• Wind, snow depth, rain
• I-V Traced Modules
• Sky Camera
Location
6
7
Positions per IEC 60891
Instrumentation (Arrays)
8-10 module temperature
measurements per array
31-52 data streams from each inverter
21 data streams from each AC meter
GHI, POA x 2, wind, ambient air
temperature
Dual Communications
8
Data Loggers
9
1 sec. vs. 1 min.
10
• Details lost at slower sampling rates
and longer averaging intervals
• Example:
o Irradiance
o Inverter Power
o Inverter Operating State
at:
o 1 sec. sampling rate
(no averaging)
o 10 sec. sampling rate
(no averaging)
o 60 sec. sampling rate
(no averaging)
o 1 sec. sampling rate, 60 sec.
averaging
17 Sep 2014
Instrumentation (Weather Station)
11
Domed Diffused Si
Pyranometer
Thermopile Pyranometers
900 – 1700 nm
Spectroradiometer
UV-B Radiometer
Flat-plate Si Irradiance Sensor
UV (Total) Radiometer
350 – 1000 nm
Spectroradiometer
UV-A Radiometer
Reference Modules
12
1
, , ln
ref
c c ref oc oc ref therm s
E
T T V V V N
E

  
      
  
  , ,1sc sc ref Isc c c refS I I T T   
 
14 Sep 2015, 10:49 EDT
Array Images
13
26 Sep 2014
22 Feb 2015
Output Circuit Power and Efficiency
All-Sky Images
14
Bonus: Inverter Arcing Event
15
25 Aug. 2015
Contact (to obtain data):
16
Boyd, M., “High-Speed Monitoring of Multiple Grid-Connected Photovoltaic Array
Configurations”, NIST Technical Note 1896, http://dx.doi.org/10.6028/NIST.TN.1896 .
17

61 boyd high_speed_monitoring

  • 1.
    High-Speed Monitoring of MultipleGrid-Tied PV Array Configurations
  • 2.
    Motivation 2 1) Test engineerswho can maintain a calibrated test facility 2) I-V curve tracers, IR cameras, etc. to intermittently evaluate performance 3) Large scale test facilities monitored over many years in a variable climate 4) Long-term system performance, durability, and reliability data over the actual lifetime, or at least five years 5) Monthly sampling of DC IV curves at array, string, and module level 6) Detailed collection of operation and maintenance data and analysis 7) Statistical sampling of modules/cells and outdoor characterization 8) Continuous string level monitoring 9) Validation of degradation rates and documentation of failure modes 10) High accuracy instrumentation, including meteorological, and given uncertainties 11) Spectral measurements 12) High-speed sampling (1 s) 13) Sky imaging 14) Obstruction data a) Shading b) Snow/ice c) Soiling 15) PVsyst validation Modeling and Validation Needs Will meet this year — rest met/commenced next year
  • 3.
    Motivation (cont.) 3 1) Abilityto examine: a) Inverter MPPT speed, accuracy, modes of operation b) Anti-islanding test perturbations c) Effects of fast moving clouds d) Causes of module and BOS component failures e) Dynamic electrical effects from irradiance enhancement and transitions 2) More accurate mean power and energy yield values 3) Identify fluctuating DC offsets from aliasing errors 4) Validation of a) Short-term irradiance forecasting b) Inverter/grid interaction models High-Speed Sampling (1 Hz)
  • 4.
    Locations 4 (271 kW, 20°tilt) (243 kW, ±5° W/E) (73 kW, 10° tilt)
  • 5.
    Locations 5 Canopy Array • CommissionedJune 2012 • 1032 Mono-Si Modules • 243 kW (DC rated) • 5° East/West Ground Array • Commissioned July 2012 • 1152 Mono-Si Modules • 271 kW (DC rated) • 20° due south Tilted Roof Array • Commissioned June 2012 • 312 Mono-Si Modules • 73 kW (DC rated) • 10° due south Horizontal Roof Array • Commissioned September 2001 • 234 Mono-Si Modules • 35 kW (DC rated) Weather Station • Commissioned August 2014 • Shortwave, Longwave, UV, Spectral • DNI, DHI on Solar Tracker • Wind, snow depth, rain • I-V Traced Modules • Sky Camera
  • 6.
  • 7.
    7 Positions per IEC60891 Instrumentation (Arrays) 8-10 module temperature measurements per array 31-52 data streams from each inverter 21 data streams from each AC meter GHI, POA x 2, wind, ambient air temperature
  • 8.
  • 9.
  • 10.
    1 sec. vs.1 min. 10 • Details lost at slower sampling rates and longer averaging intervals • Example: o Irradiance o Inverter Power o Inverter Operating State at: o 1 sec. sampling rate (no averaging) o 10 sec. sampling rate (no averaging) o 60 sec. sampling rate (no averaging) o 1 sec. sampling rate, 60 sec. averaging 17 Sep 2014
  • 11.
    Instrumentation (Weather Station) 11 DomedDiffused Si Pyranometer Thermopile Pyranometers 900 – 1700 nm Spectroradiometer UV-B Radiometer Flat-plate Si Irradiance Sensor UV (Total) Radiometer 350 – 1000 nm Spectroradiometer UV-A Radiometer
  • 12.
    Reference Modules 12 1 , ,ln ref c c ref oc oc ref therm s E T T V V V N E                 , ,1sc sc ref Isc c c refS I I T T      14 Sep 2015, 10:49 EDT
  • 13.
    Array Images 13 26 Sep2014 22 Feb 2015 Output Circuit Power and Efficiency Output Circuit Power and Efficiency
  • 14.
  • 15.
    Bonus: Inverter ArcingEvent 15 25 Aug. 2015
  • 16.
    Contact (to obtaindata): 16 Boyd, M., “High-Speed Monitoring of Multiple Grid-Connected Photovoltaic Array Configurations”, NIST Technical Note 1896, http://dx.doi.org/10.6028/NIST.TN.1896 .
  • 17.