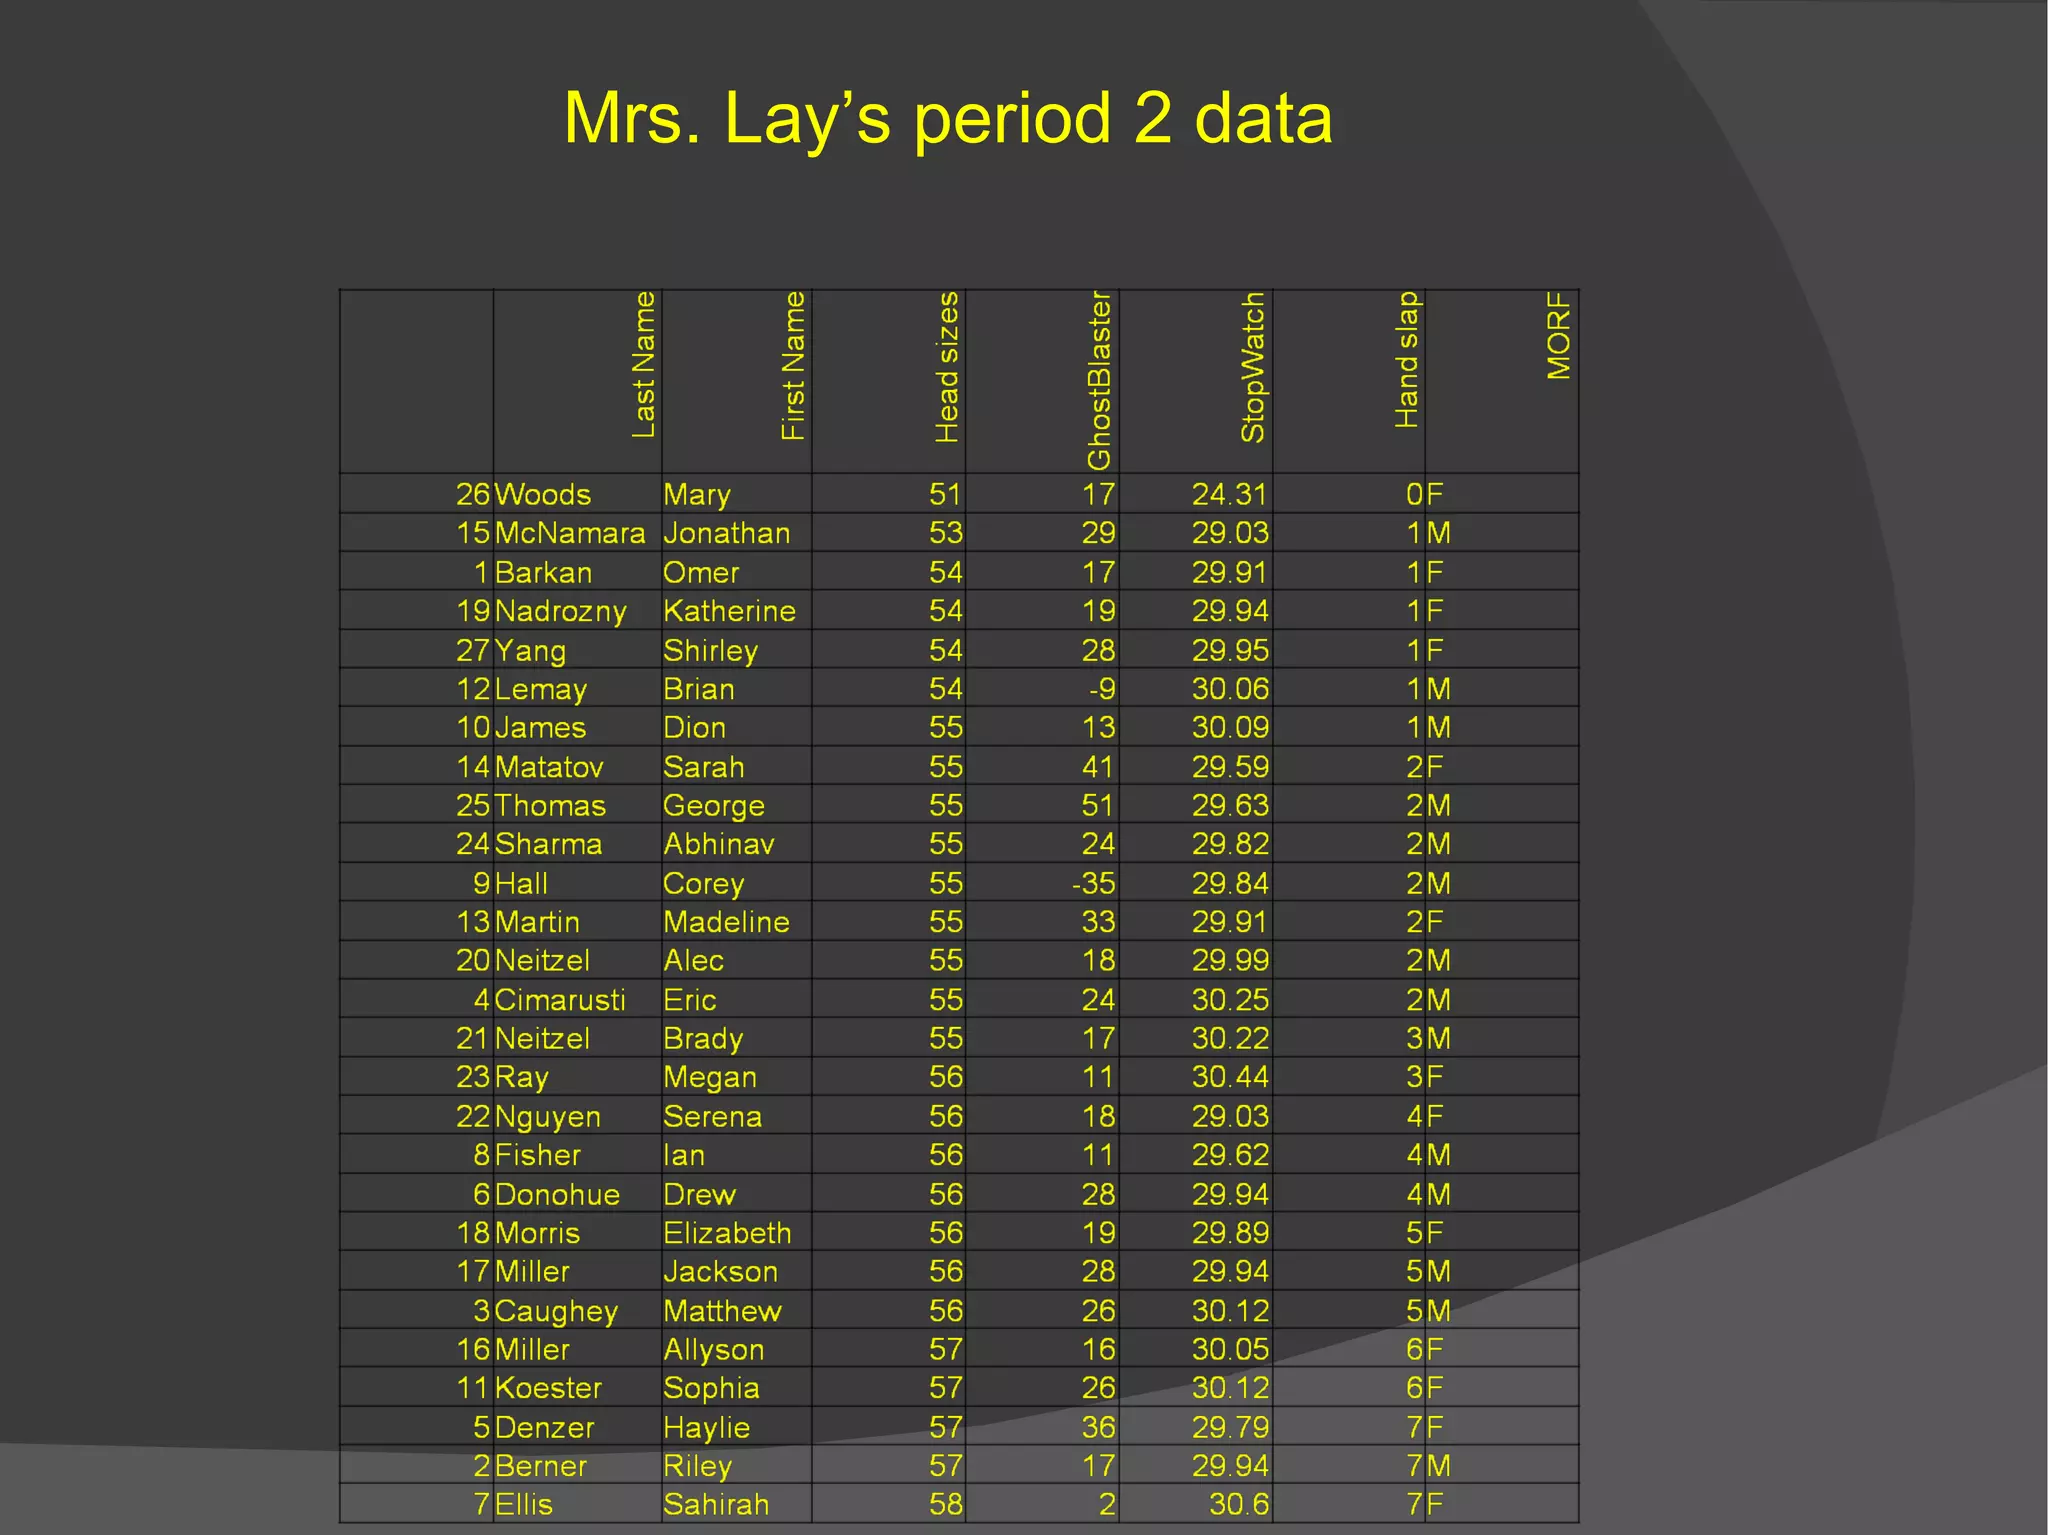
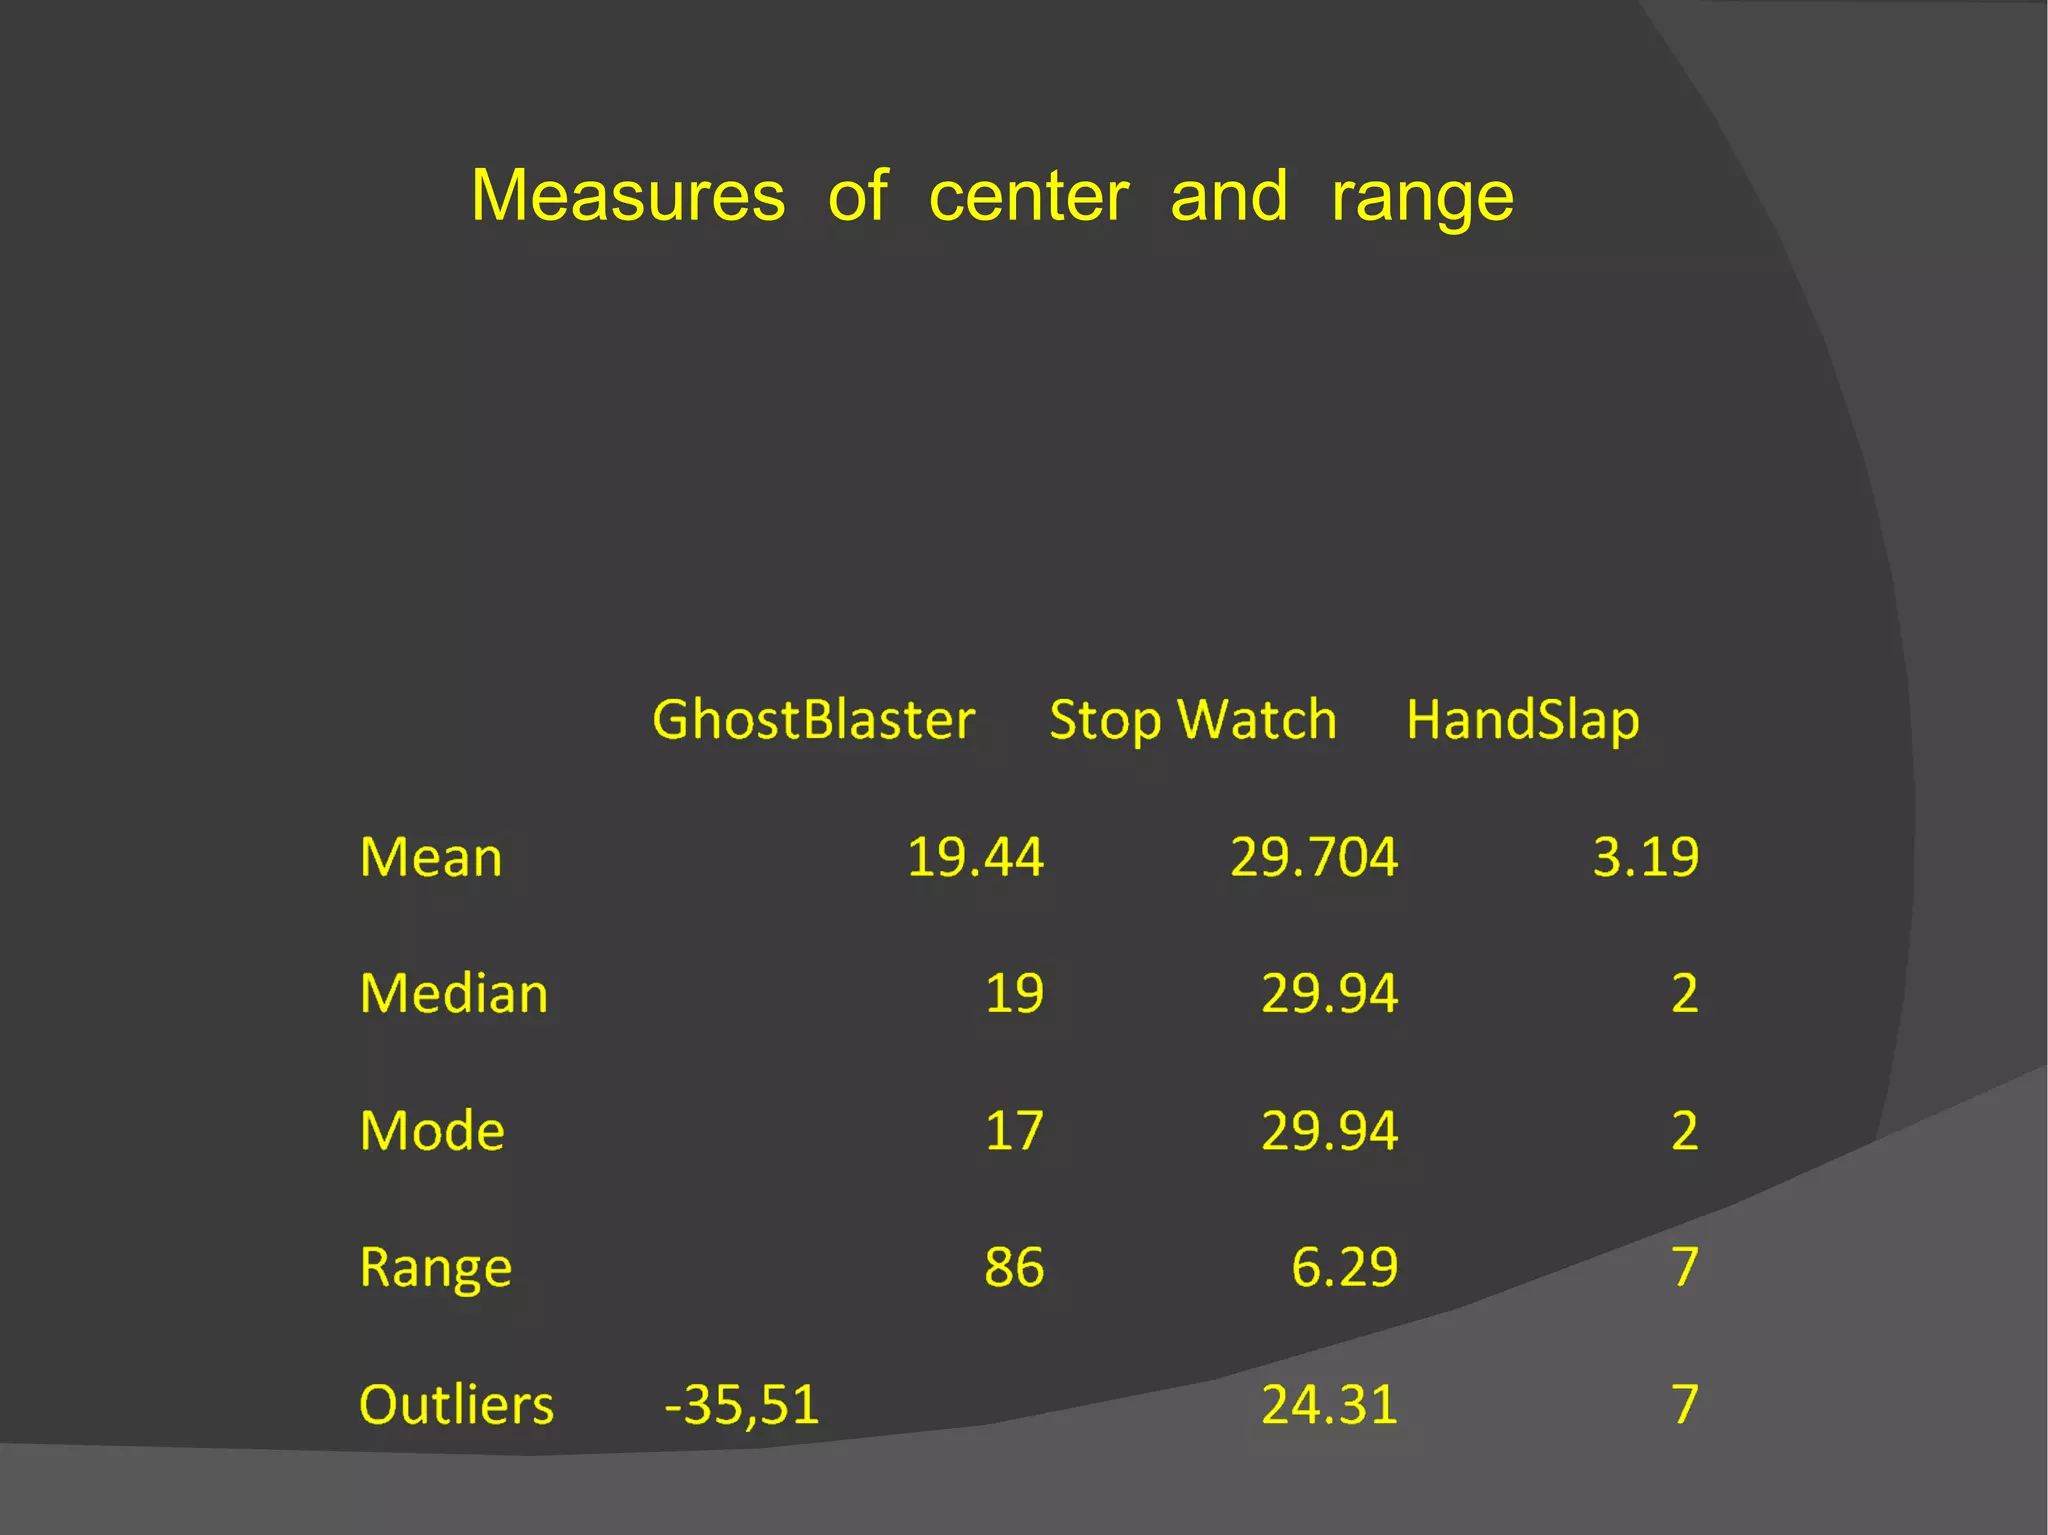
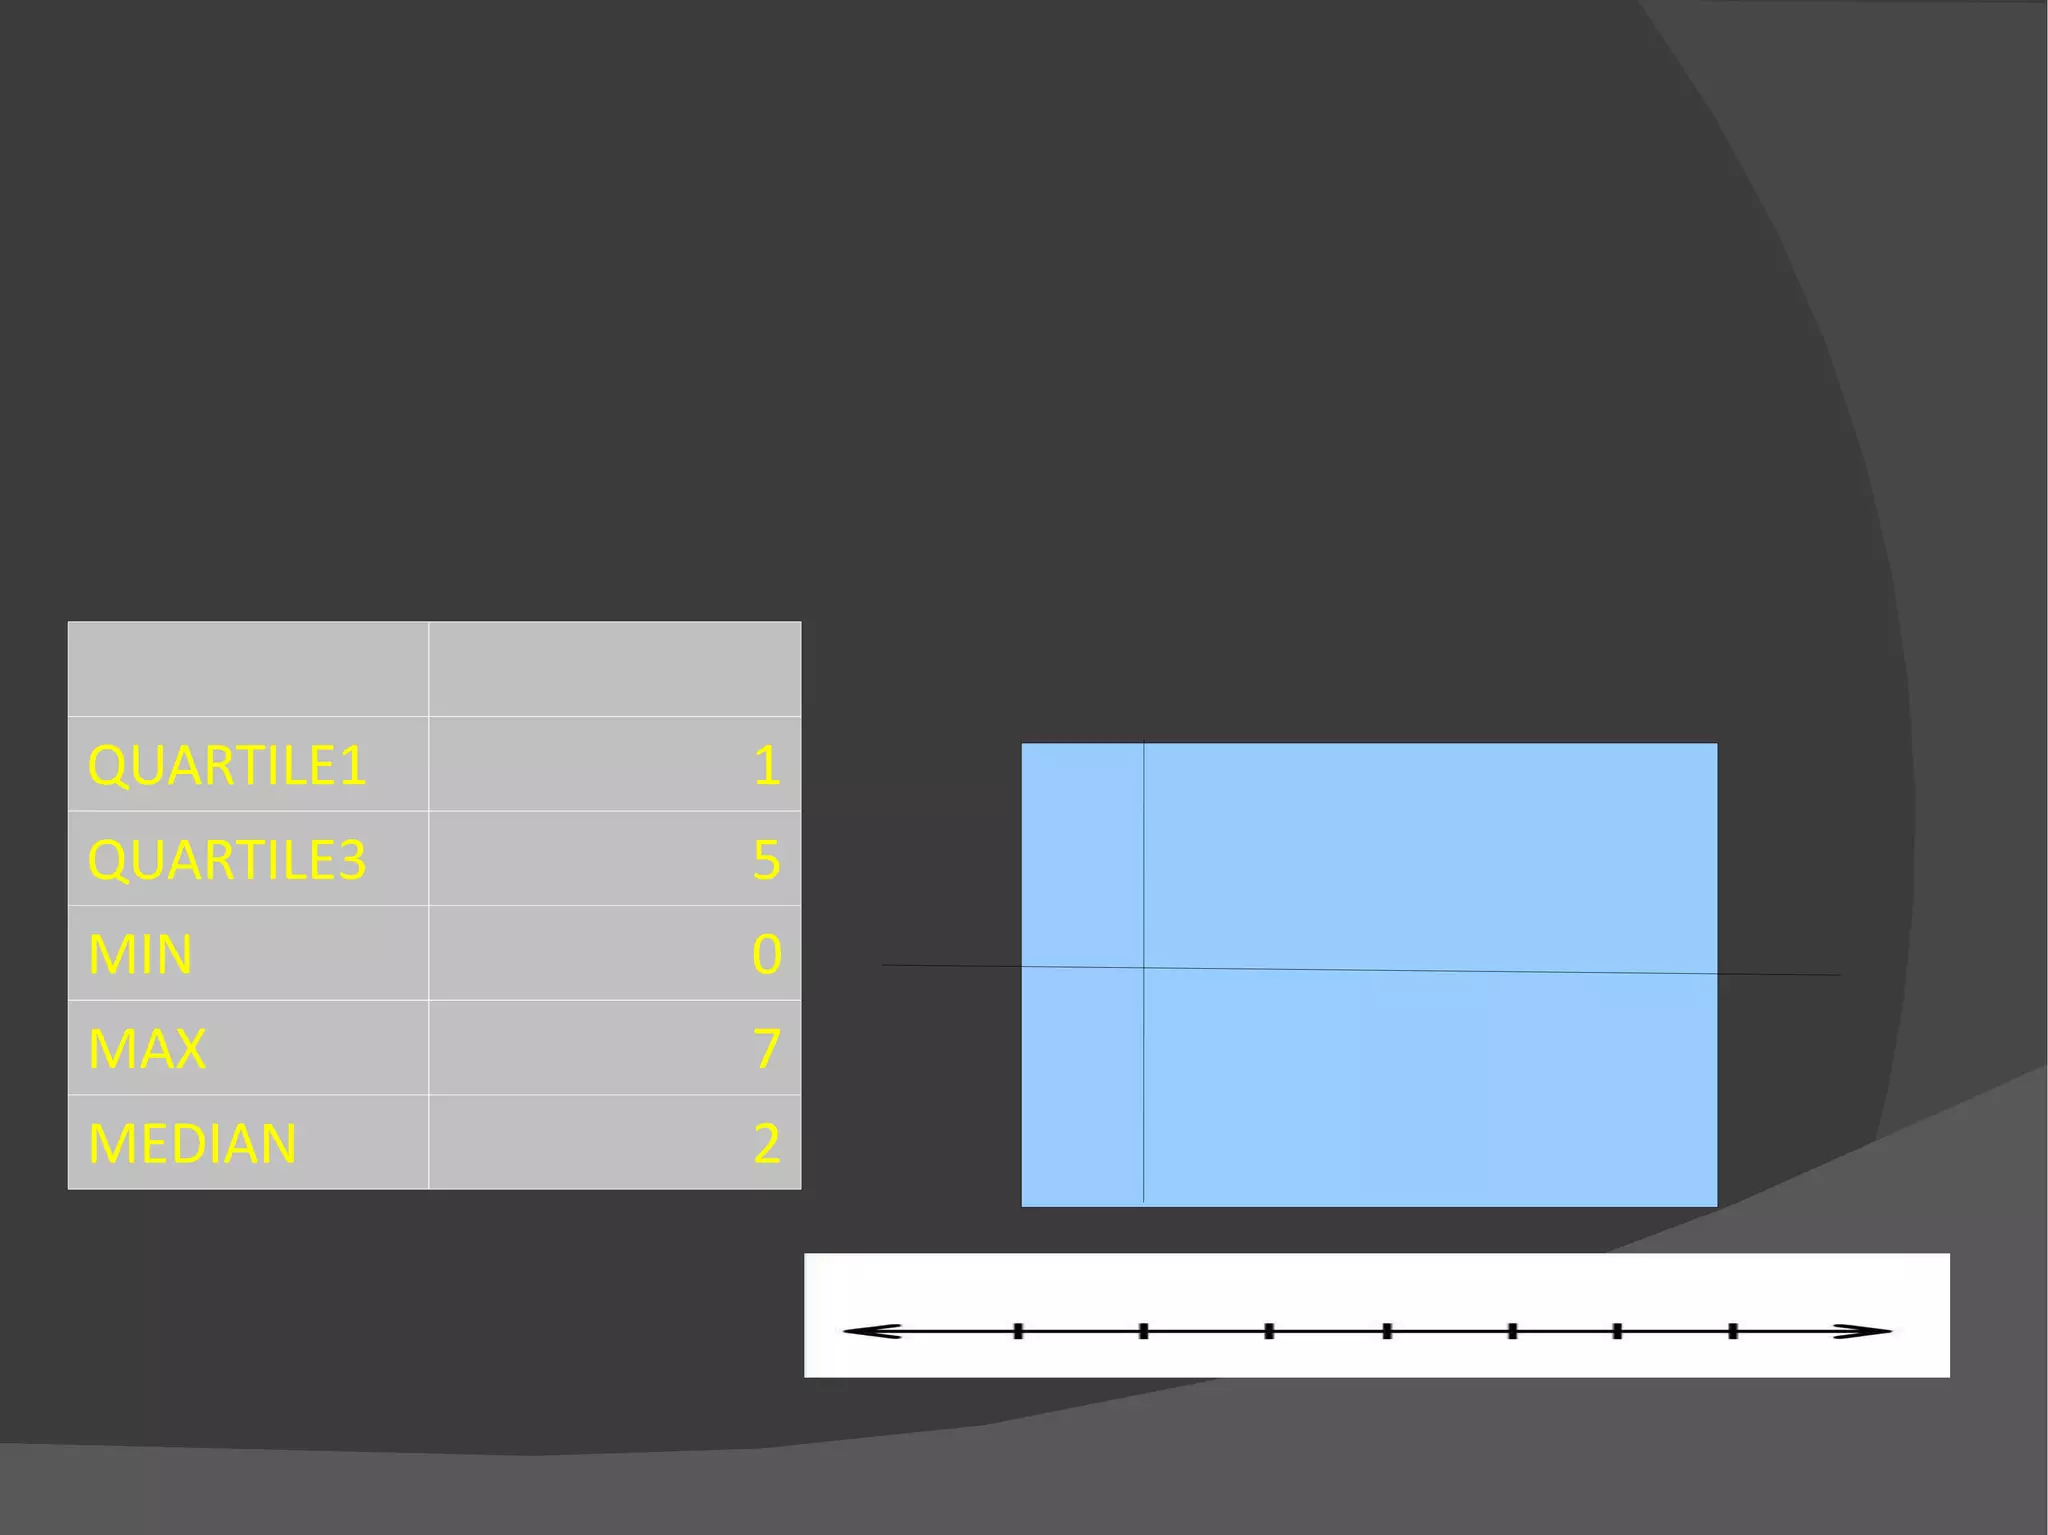
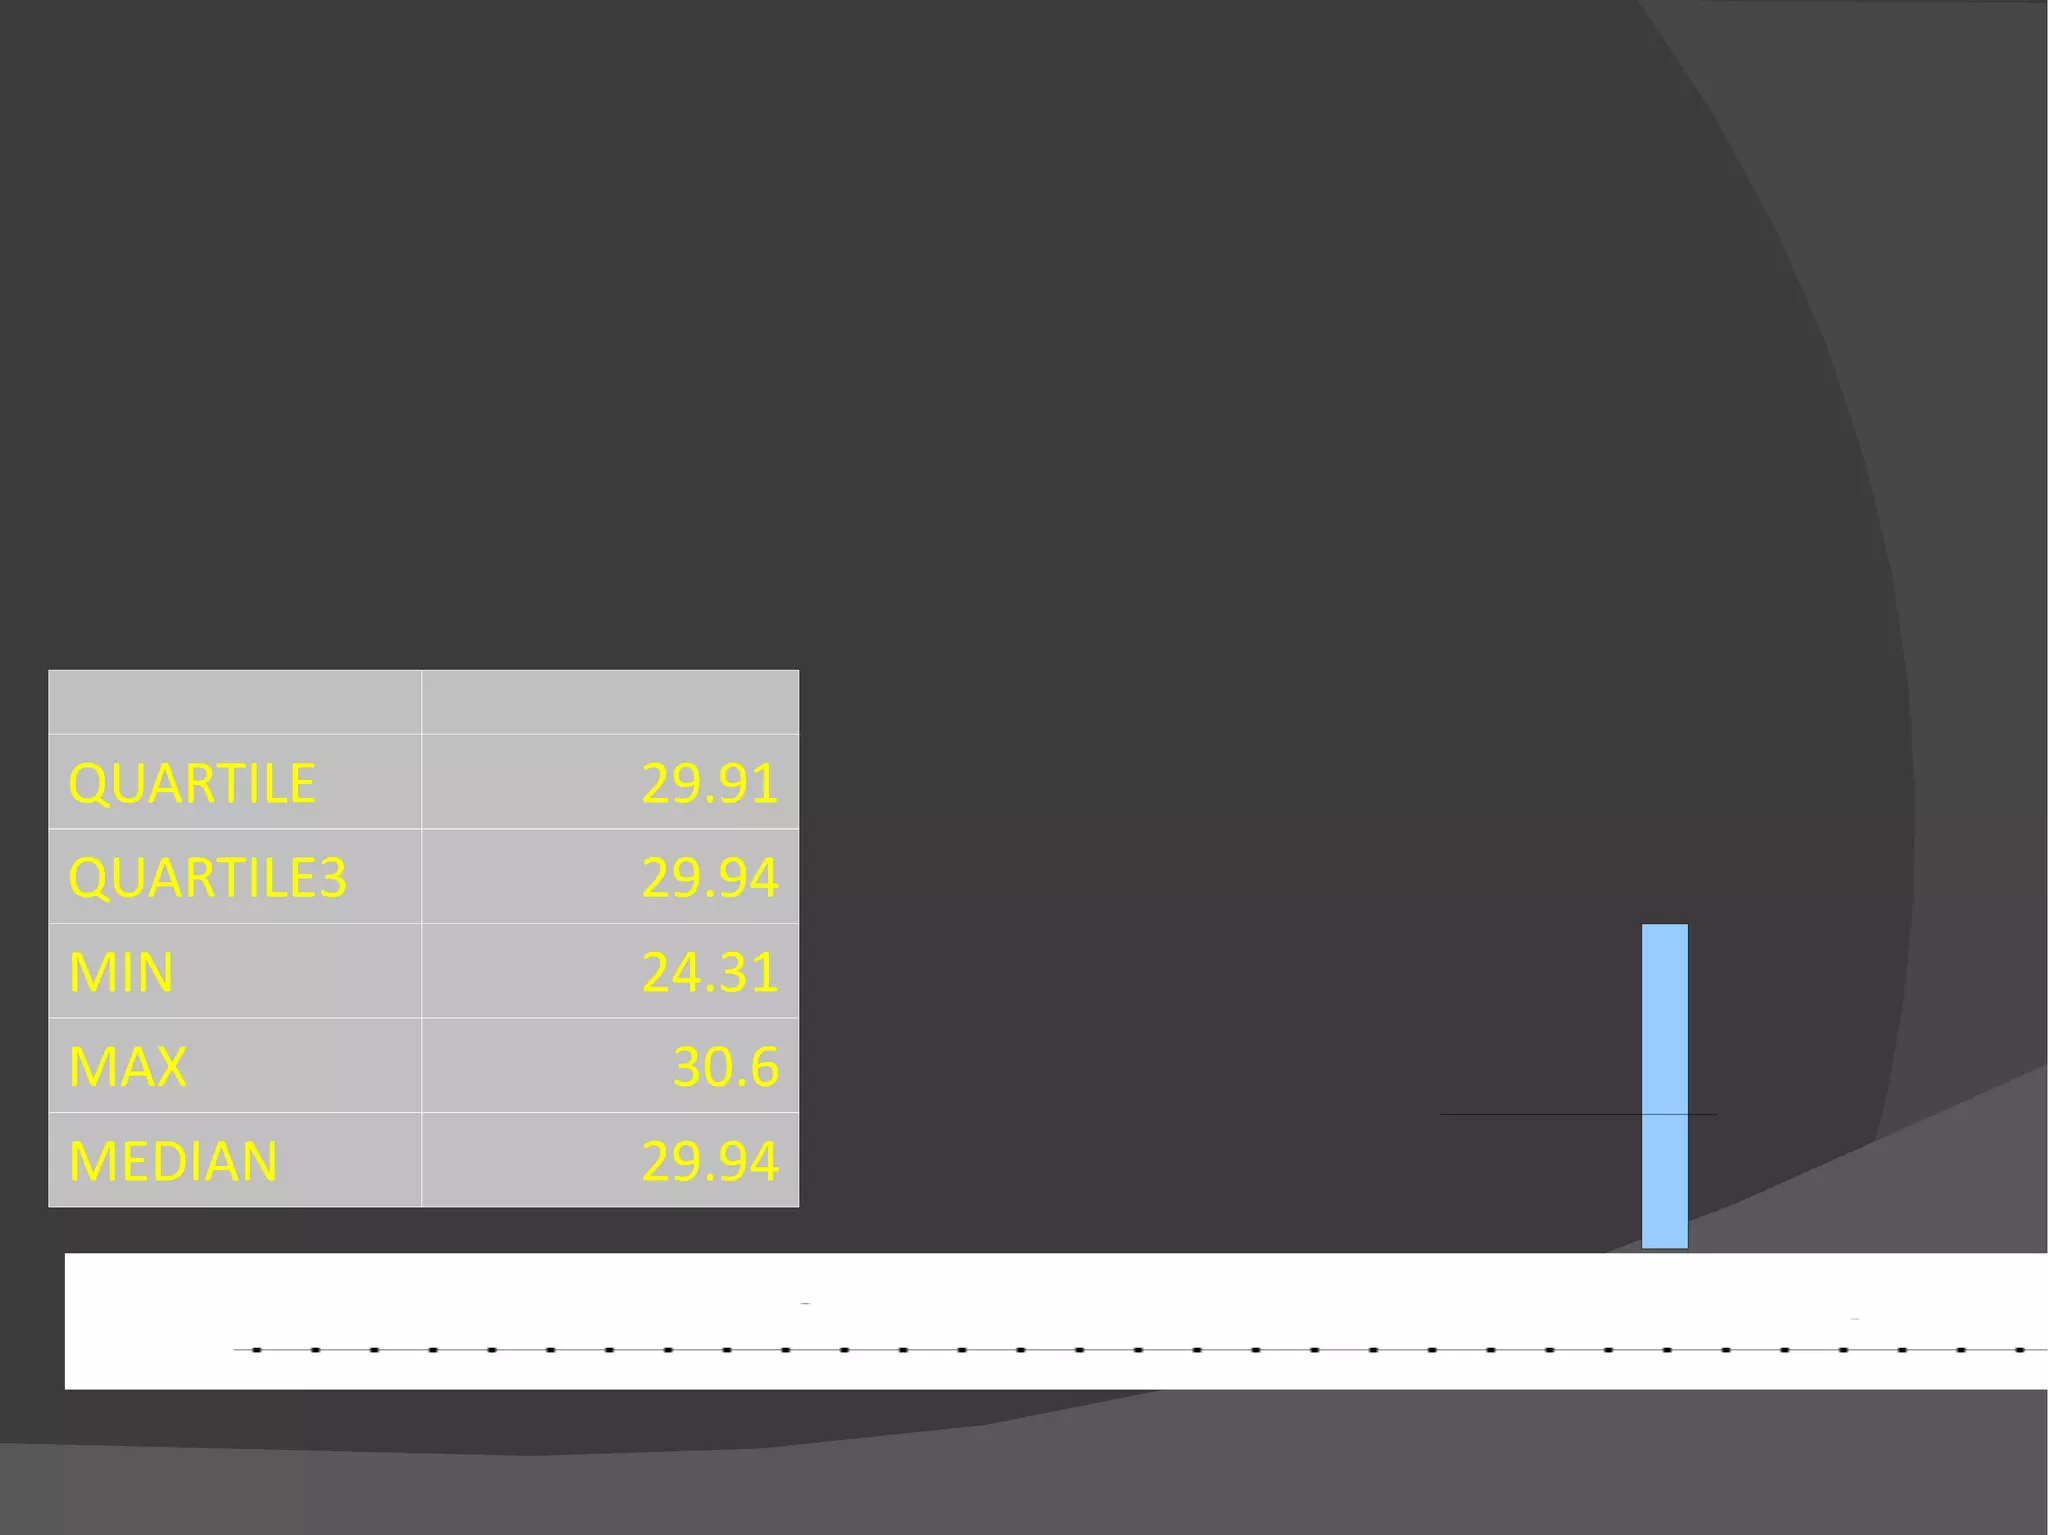
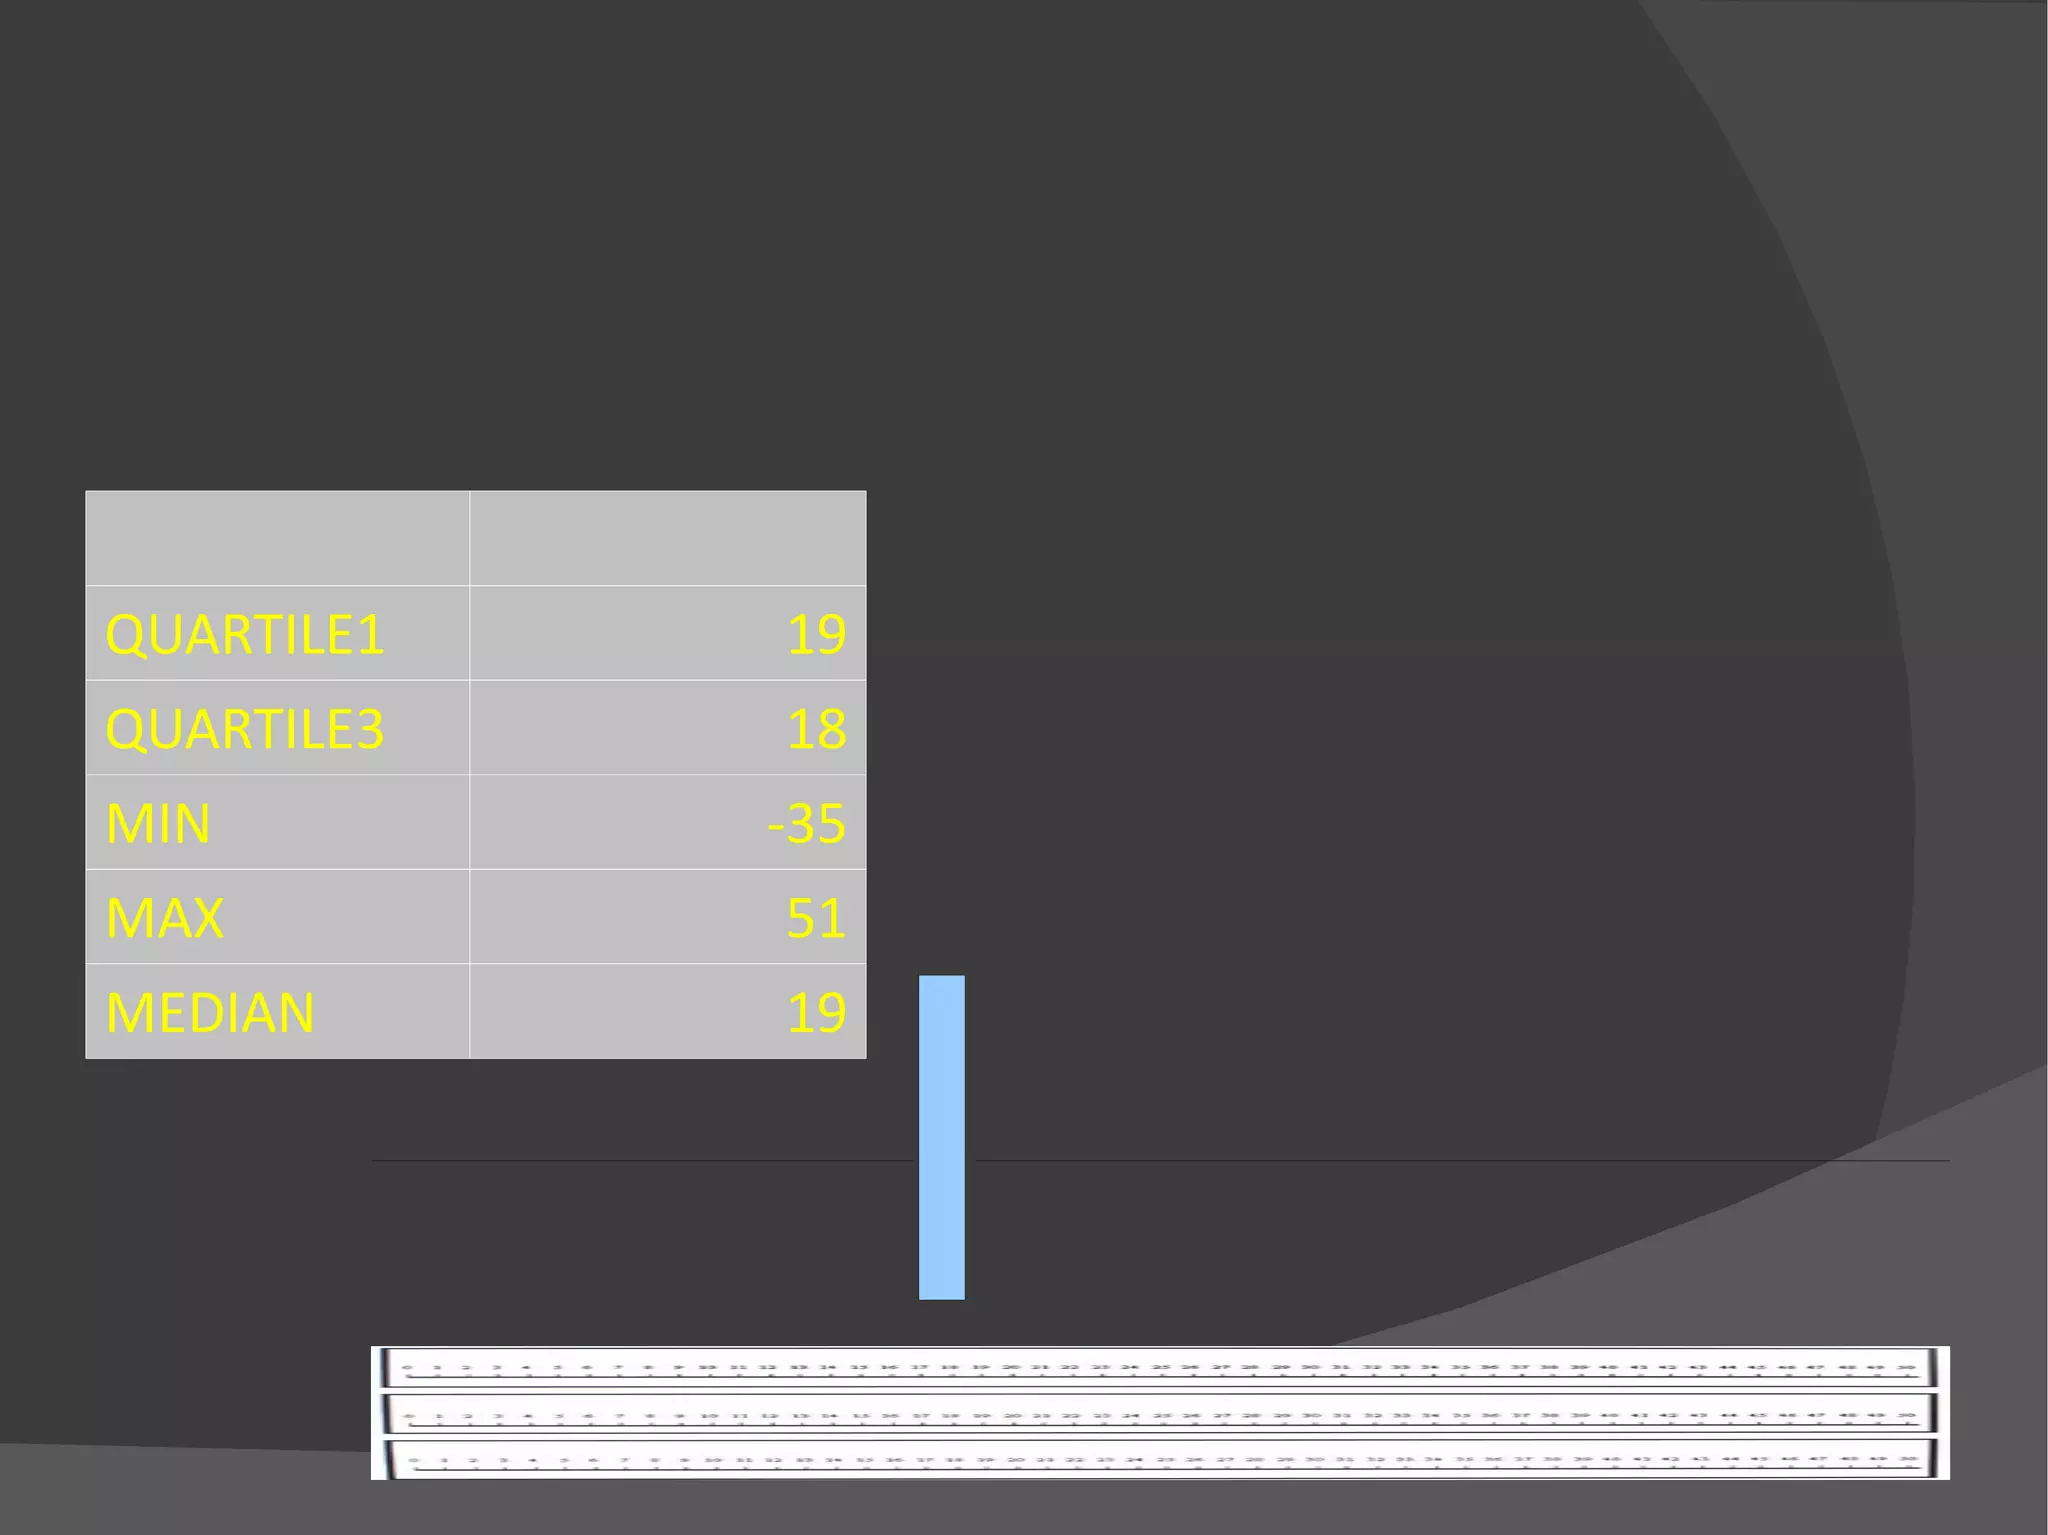
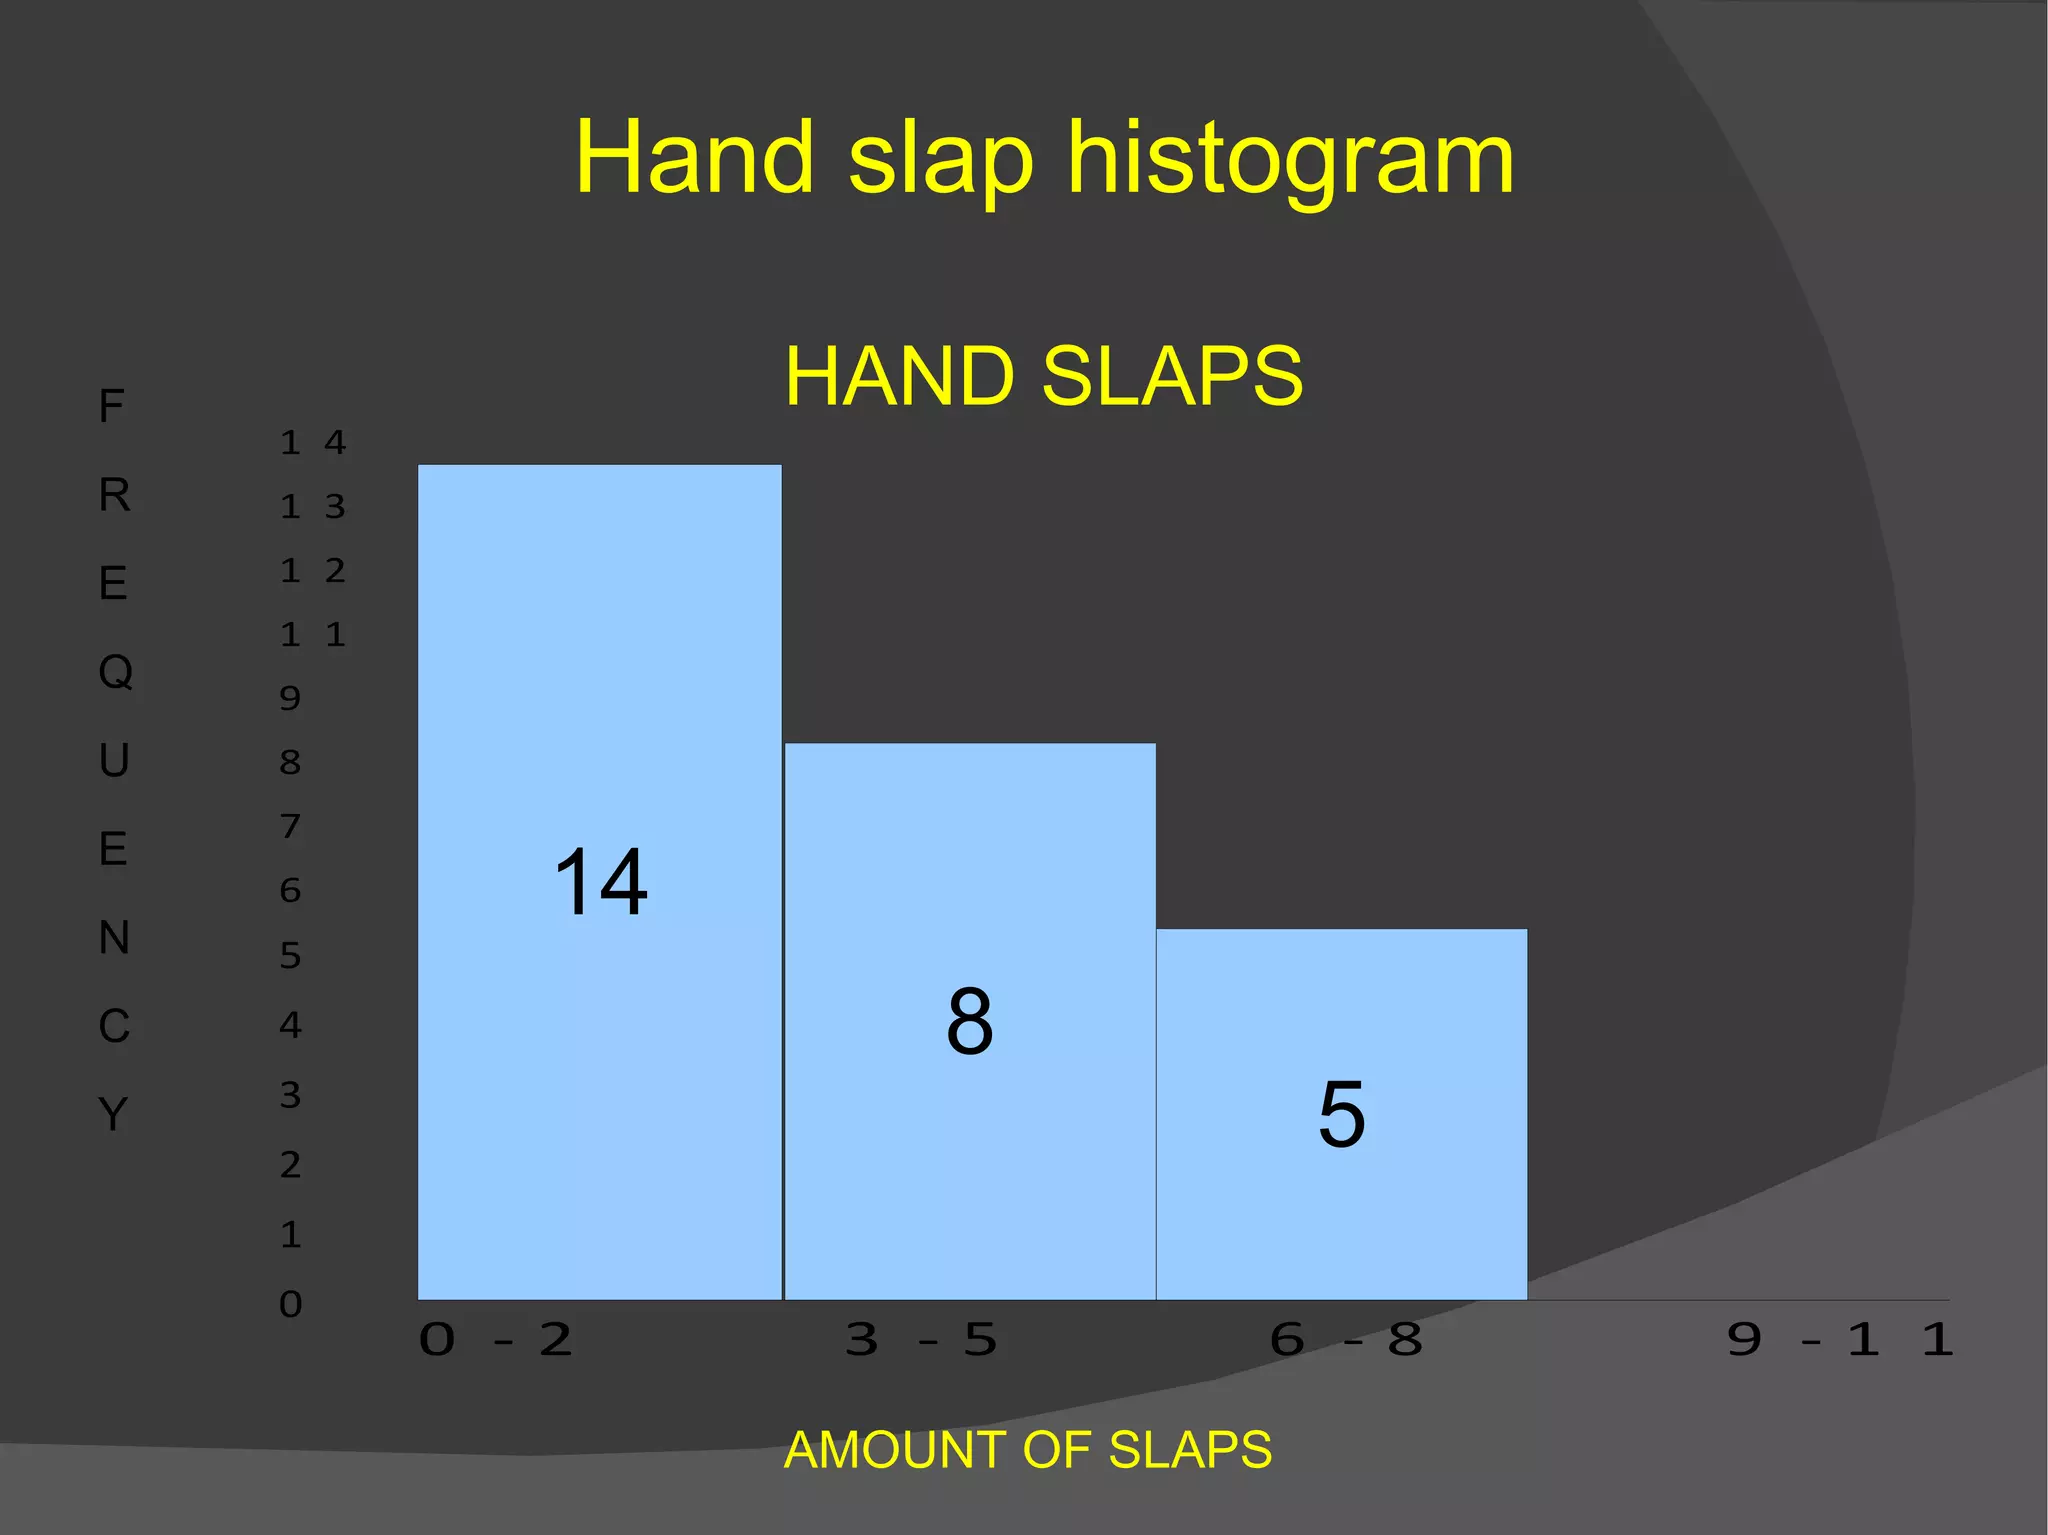
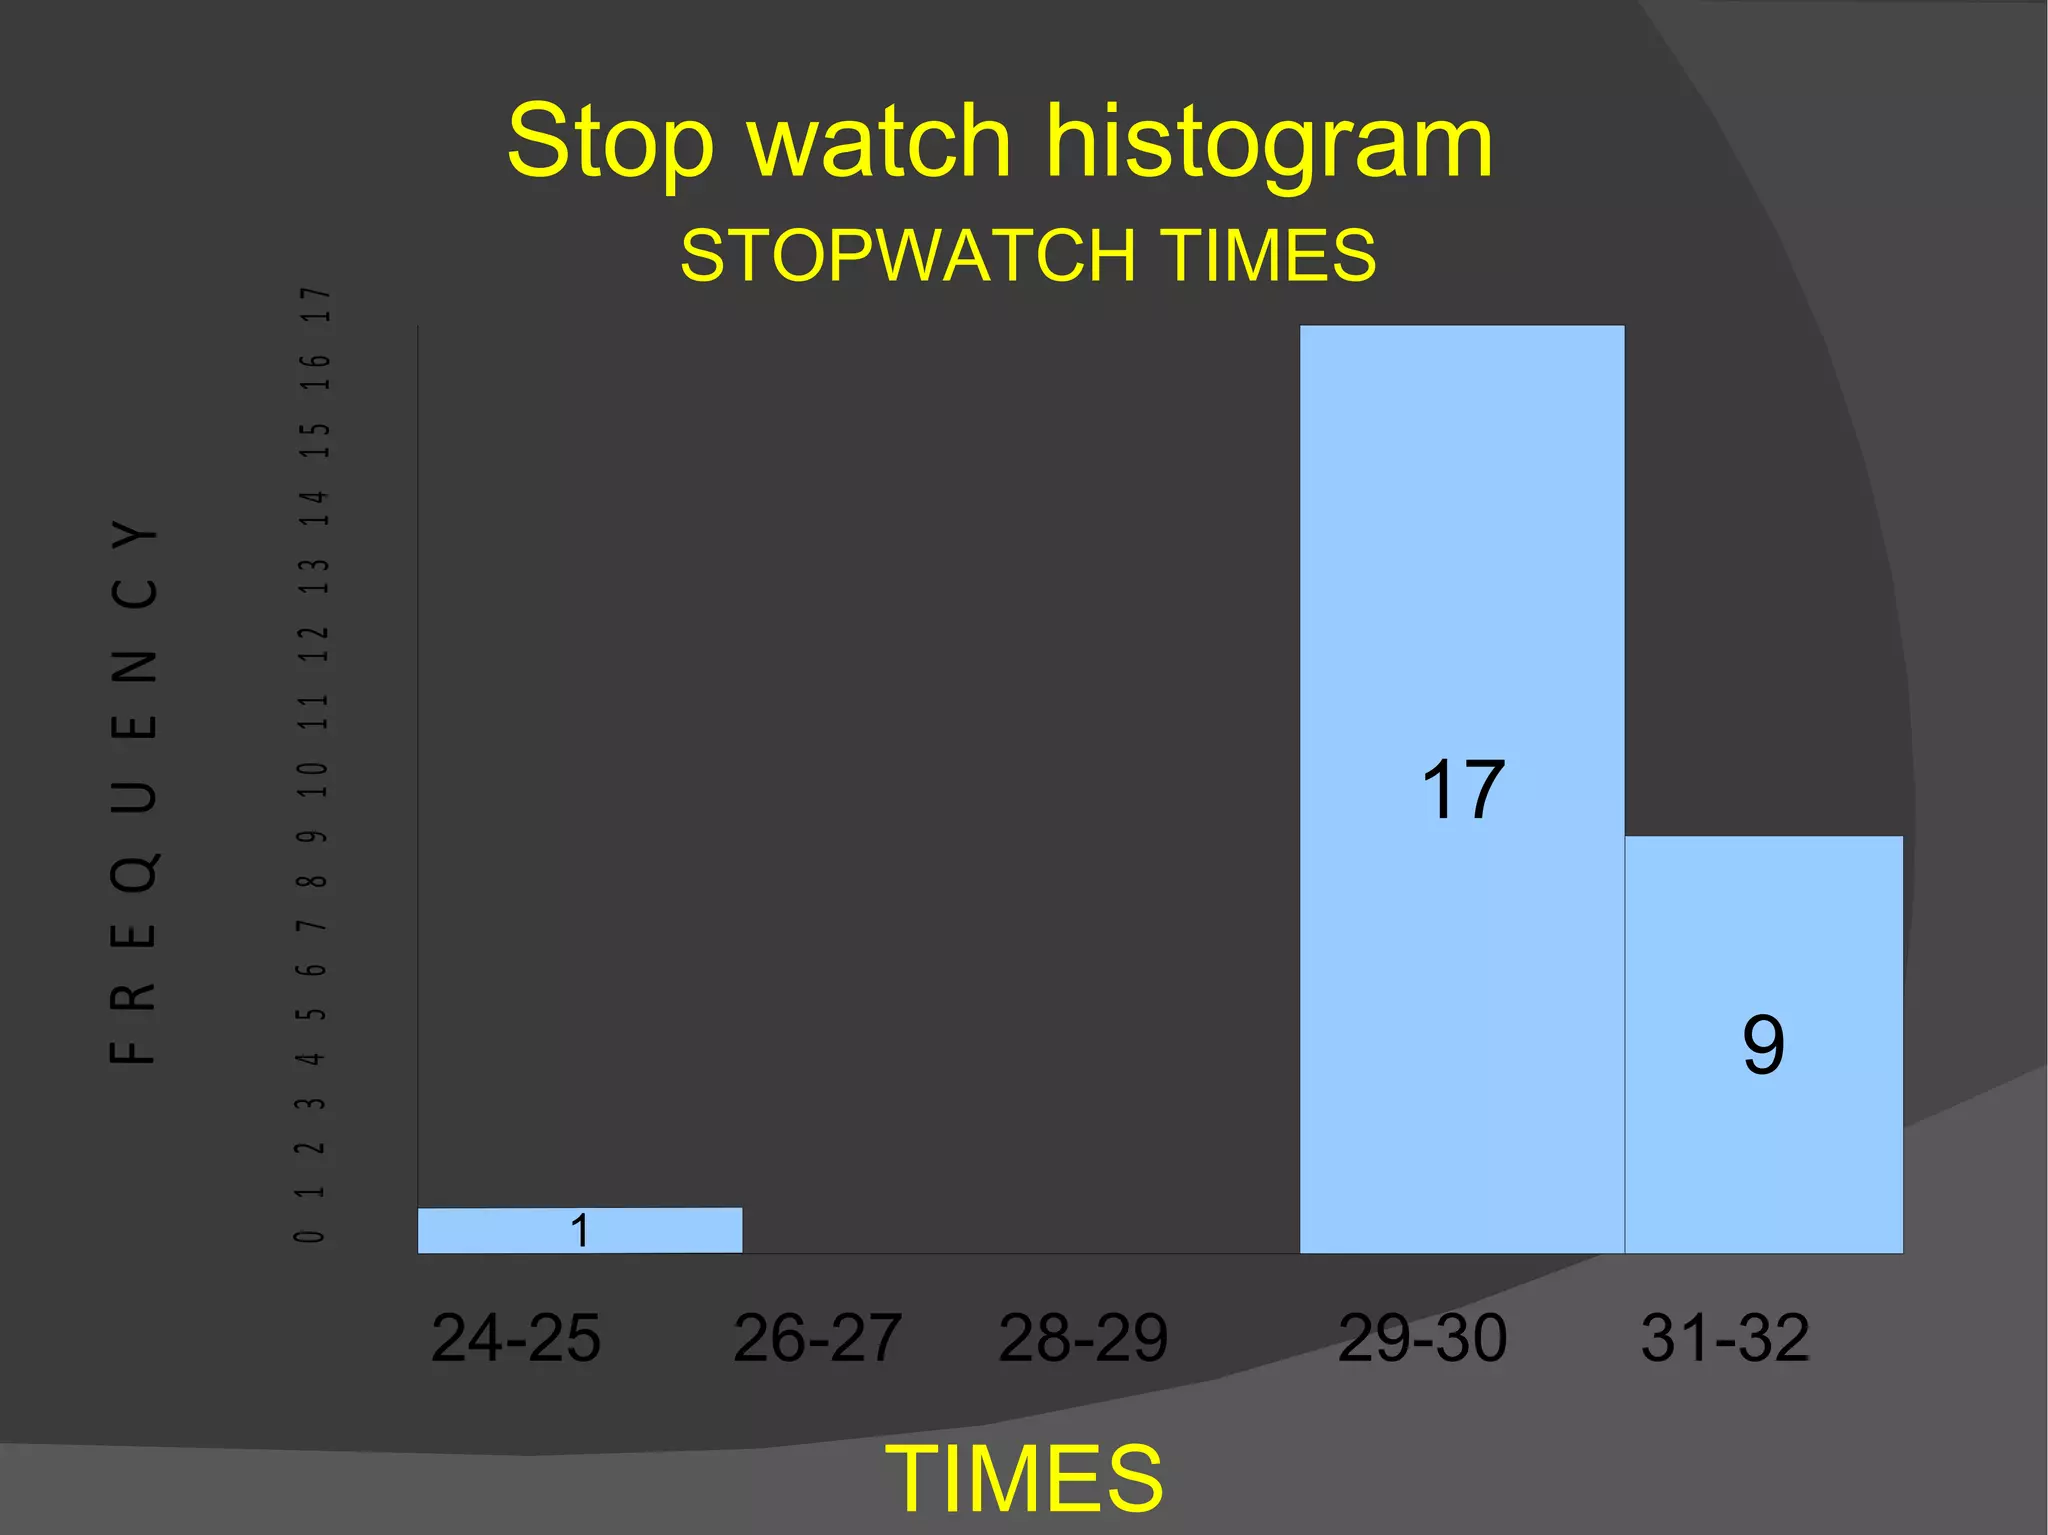
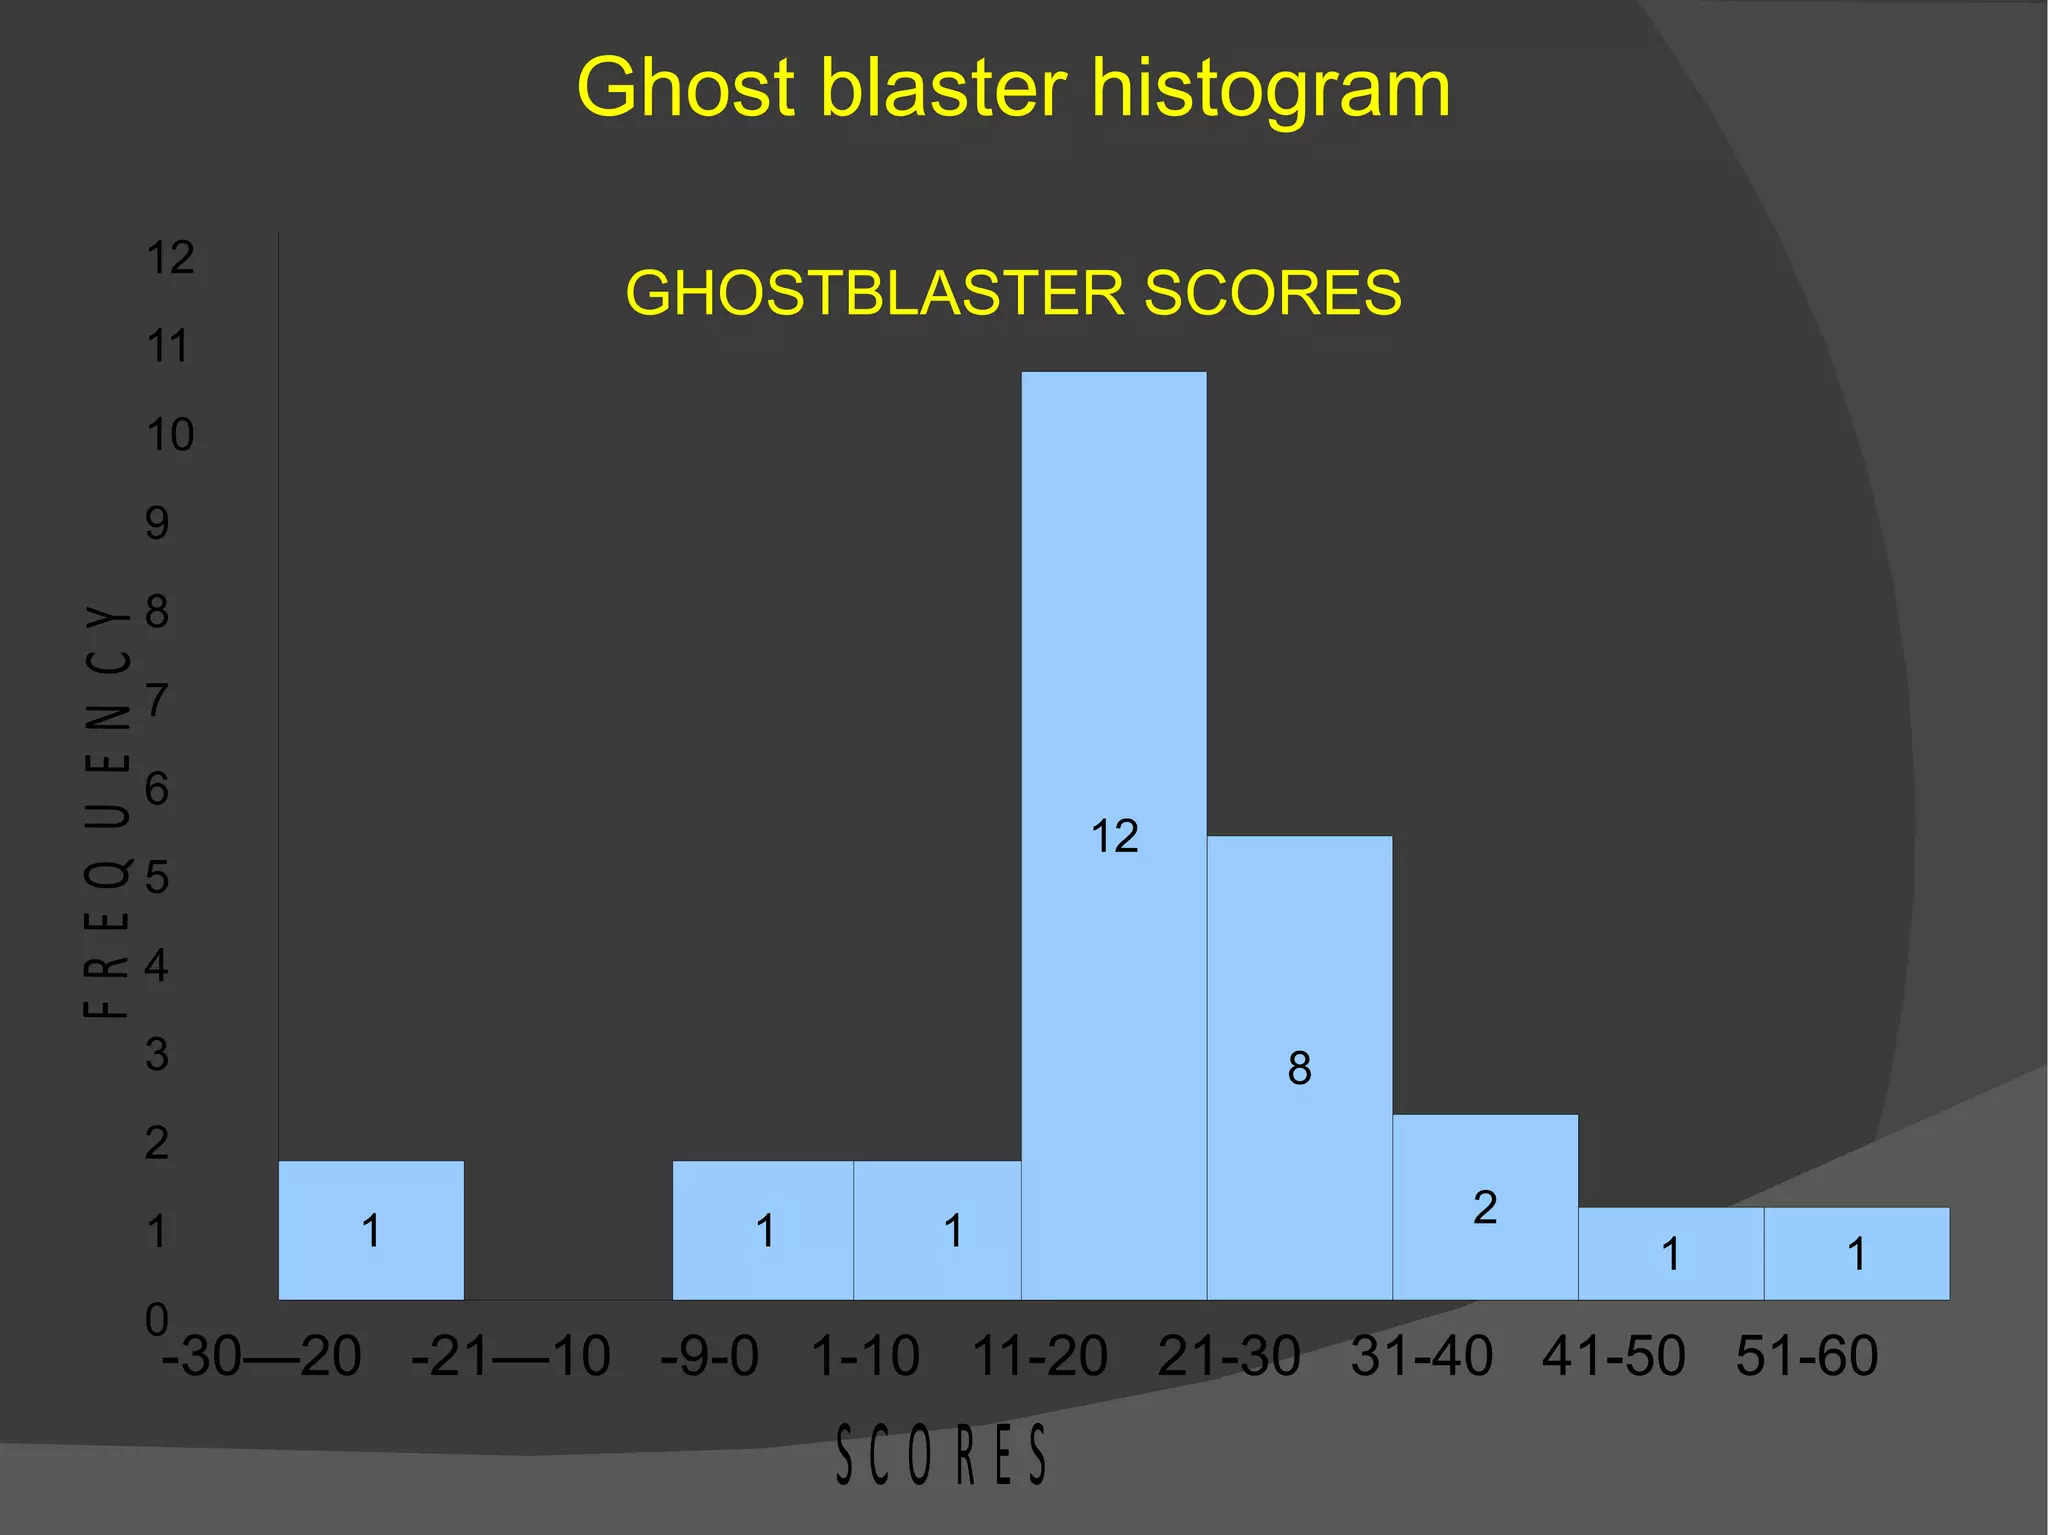
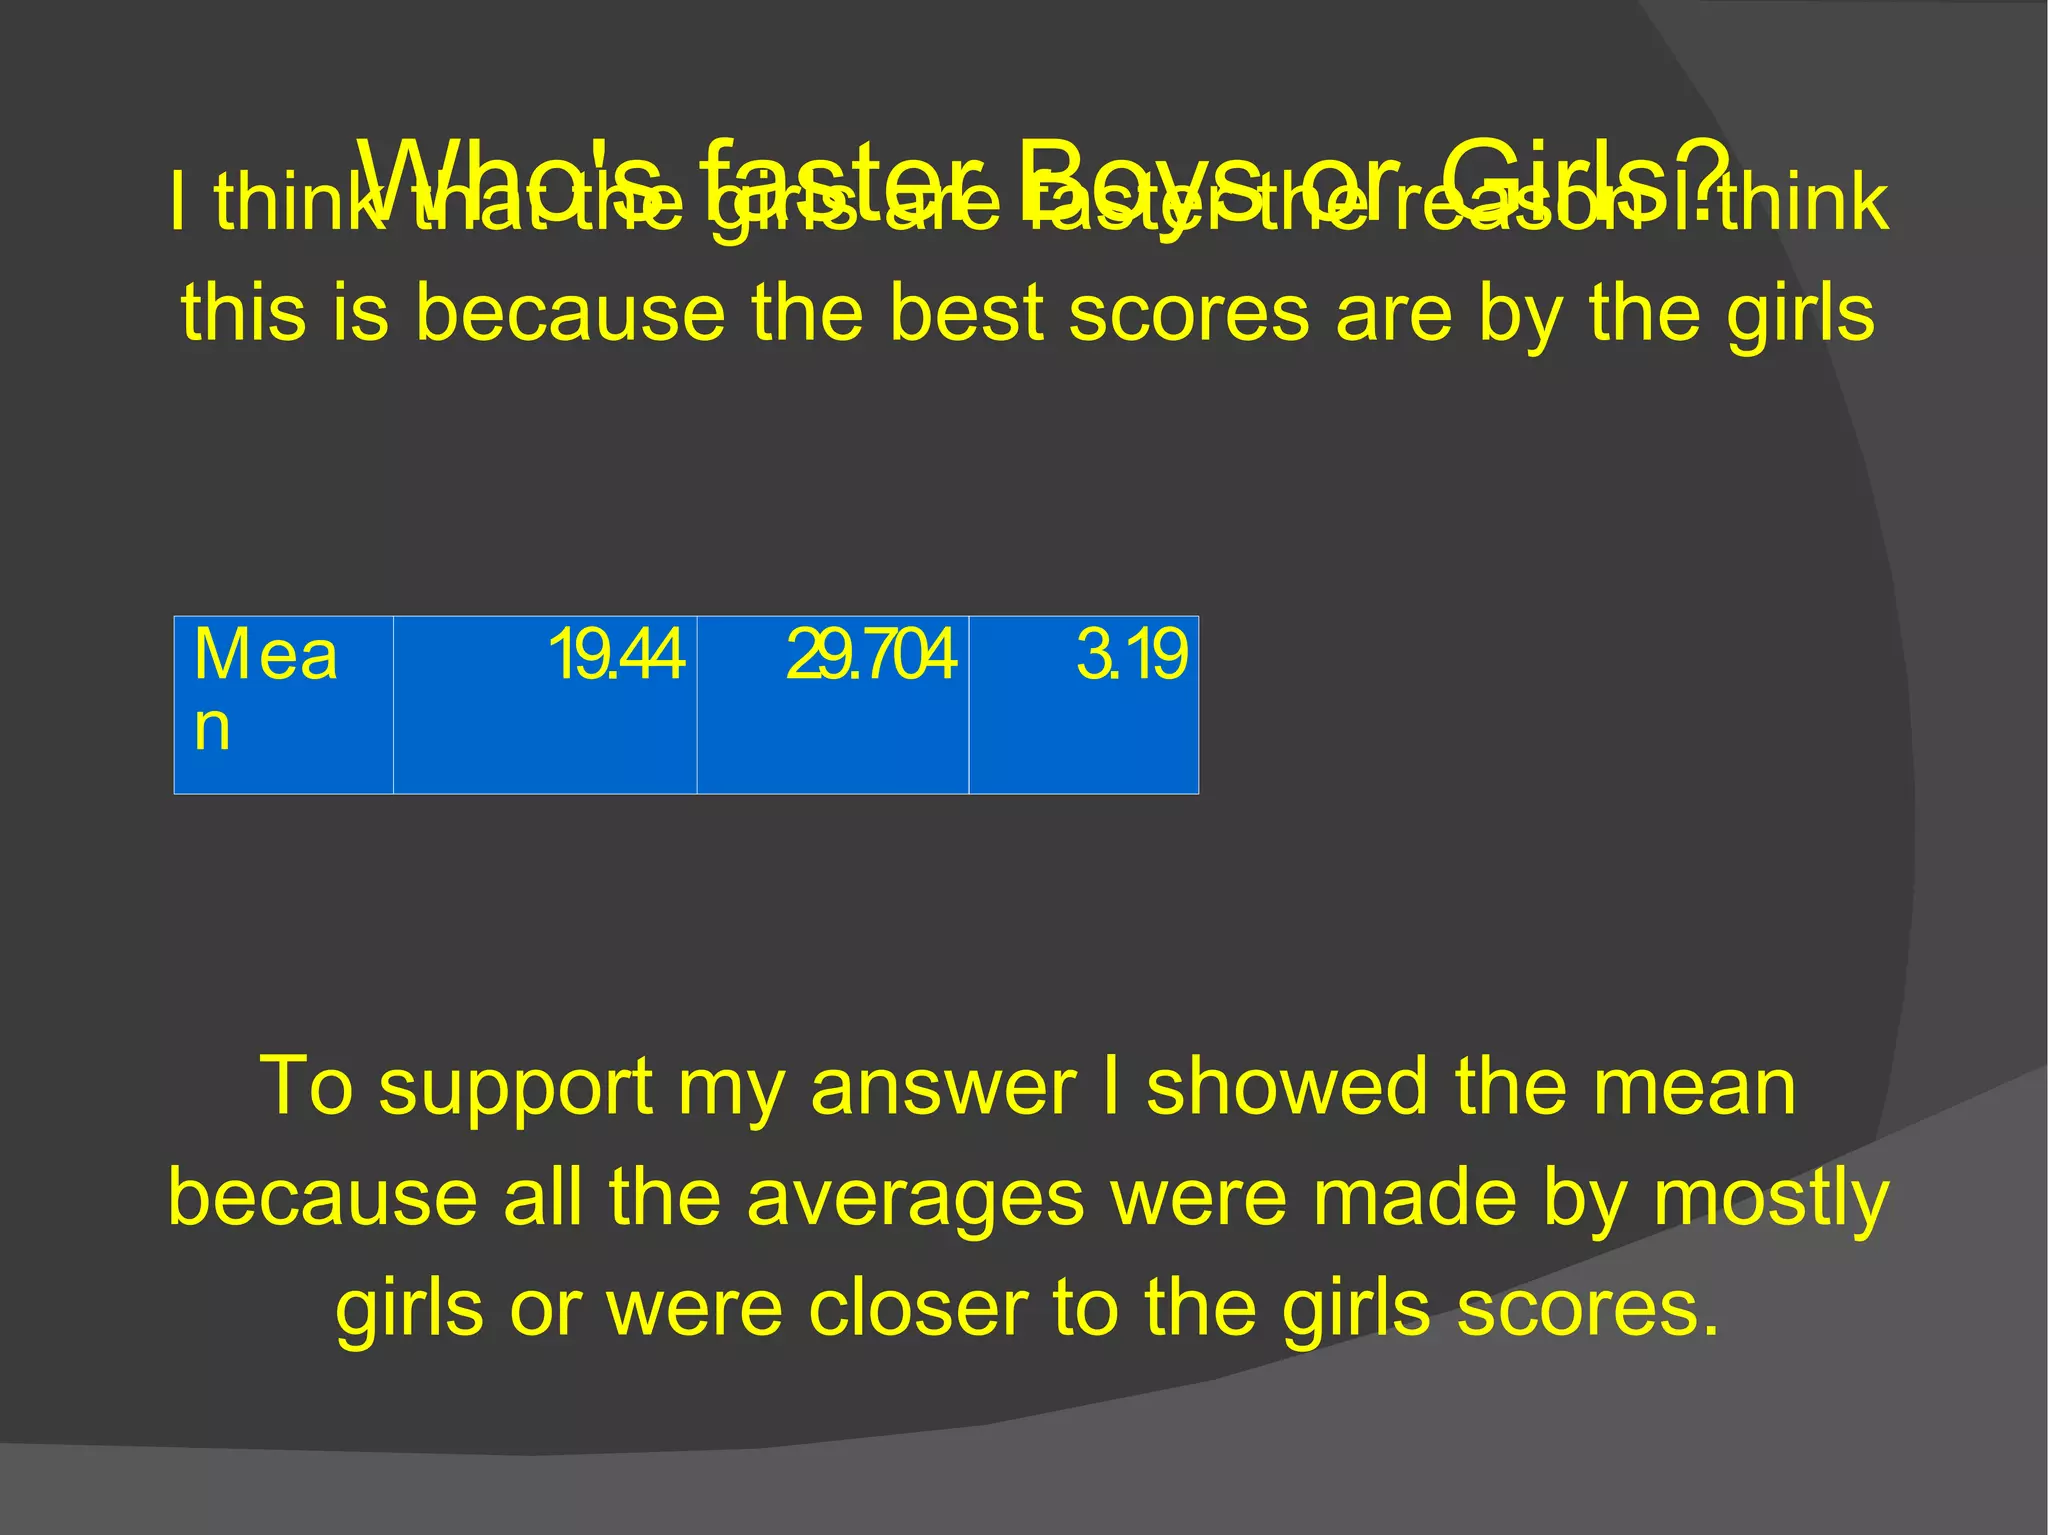
Who is the “typical” Jefferson middle school student 6 th  grader?
Mrs. Lay’s period 2 data
Measures  of  center  and  range
\\Jeff-fp2\hand-in\lay\Per2\Pictures\Number Line...JPG
\\Jeff-fp2\hand-in\lay\Per2\Pictures\blanknumberline.png
 
The reason I chose histograms One reason I chose histograms is because it helps show gaps if there is no bar on top of the intervals. Another reason I used histograms is because it helps show outliers if there is a small number on a interval that is far away from the clusters.
HAND SLAPS Hand slap histogram AMOUNT OF SLAPS F R E Q U E N C Y AMOUNT OF SLAPS
Stop watch histogram  STOPWATCH TIMES 24-25  26-27  28-29  29-30  31-32 TIMES
Ghost blaster histogram GHOSTBLASTER SCORES 12 11 10 9 8 7 6 5 4 3 2 1 0 -30—20  -21—10  -9-0  1-10  11-20  21-30  31-40  41-50  51-60
Graph variability  The stop watch graph has 2 gaps which are 26-27 and 28-29 but the ghost blasters graph and hand slap graph only has 1 each. -35, -9, and 24.31 are the only outliers in the graphs  All the histograms cluster in a general area at 18-8. But the hand slap graph also clusters around 7-5.
The typical 6 th  grader The typical 6 th  grader  ranges around 19.44 in ghost blasters 29.704 in stop watch and 3.19 in hand slap they are not extremely fast but not very slow. They are not as good as they are at certain  activity's   as the are with others like stop watch and hand slaps. I know this because 19.44, 29.704, 3.19 are the mean and the mean is the best way to show the average. I know they are better at certain  activity's  because 29.704 is one of the best scores and 3.19 is not so good.
Who's faster Boys or  Girls? I think that the girls are faster the reason I think this is because the best scores are by the girls To support my answer I showed the mean because all the averages were made by mostly girls or were closer to the girls scores.

Ian Fisher powerpoint

  • 1.
    Who is the“typical” Jefferson middle school student 6 th grader?
  • 2.
  • 3.
    Measures of center and range
  • 4.
  • 5.
  • 6.
  • 7.
    The reason Ichose histograms One reason I chose histograms is because it helps show gaps if there is no bar on top of the intervals. Another reason I used histograms is because it helps show outliers if there is a small number on a interval that is far away from the clusters.
  • 8.
    HAND SLAPS Handslap histogram AMOUNT OF SLAPS F R E Q U E N C Y AMOUNT OF SLAPS
  • 9.
    Stop watch histogram STOPWATCH TIMES 24-25 26-27 28-29 29-30 31-32 TIMES
  • 10.
    Ghost blaster histogramGHOSTBLASTER SCORES 12 11 10 9 8 7 6 5 4 3 2 1 0 -30—20 -21—10 -9-0 1-10 11-20 21-30 31-40 41-50 51-60
  • 11.
    Graph variability The stop watch graph has 2 gaps which are 26-27 and 28-29 but the ghost blasters graph and hand slap graph only has 1 each. -35, -9, and 24.31 are the only outliers in the graphs All the histograms cluster in a general area at 18-8. But the hand slap graph also clusters around 7-5.
  • 12.
    The typical 6th grader The typical 6 th grader ranges around 19.44 in ghost blasters 29.704 in stop watch and 3.19 in hand slap they are not extremely fast but not very slow. They are not as good as they are at certain activity's as the are with others like stop watch and hand slaps. I know this because 19.44, 29.704, 3.19 are the mean and the mean is the best way to show the average. I know they are better at certain activity's because 29.704 is one of the best scores and 3.19 is not so good.
  • 13.
    Who's faster Boysor Girls? I think that the girls are faster the reason I think this is because the best scores are by the girls To support my answer I showed the mean because all the averages were made by mostly girls or were closer to the girls scores.