This document defines key vocabulary terms from the MCA-III Math test specifications, including:
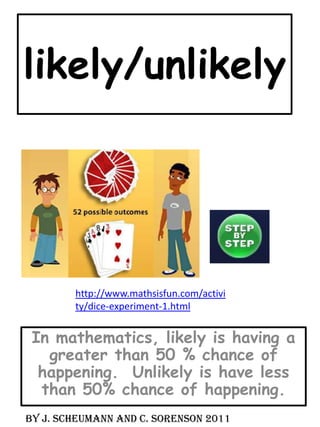
- Probability is a number from 0 to 1 that shows the likelihood of an event happening.
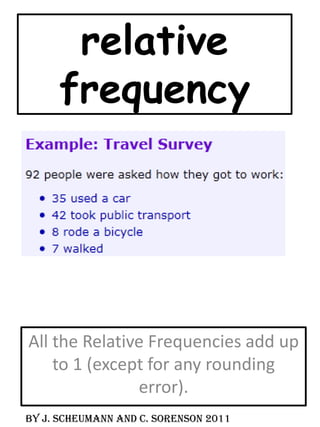
- A ratio shows the relative sizes of two or more values.
- An outcome is the result of something.
- Frequency is the number of times a value occurs in a set of data.
- A prediction is a guess about what will happen.


![ch_5-8_probability155[1].ppt](https://cdn.slidesharecdn.com/ss_thumbnails/ch5-8probability1551-231116061842-b428d0bc-thumbnail.jpg?width=640&height=640&fit=bounds)