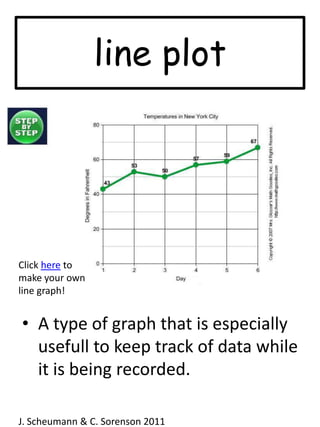
This document defines key terms related to data and probability for 3rd grade math students. It includes definitions for data, represent, pictograph, key, tally chart, bar graph, line plot, table, title, and label. Each term is defined briefly and cites the source J. Scheumann & C. Sorenson 2011. It also includes links to video and interactive examples for pictographs and bar graphs.


![Takin the Pads 2 Class [Public Version]](https://cdn.slidesharecdn.com/ss_thumbnails/takinipads2classpublic-120629071254-phpapp02-thumbnail.jpg?width=640&height=640&fit=bounds)