Downloaded 801 times

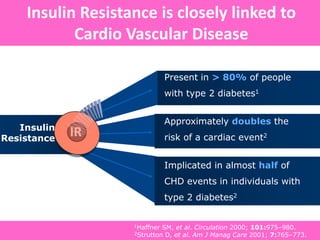
![ANTI-HYPERGLYCEMIC THERAPY
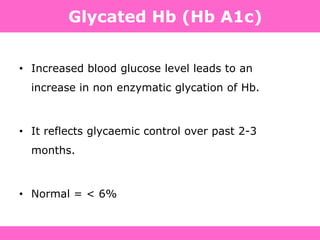
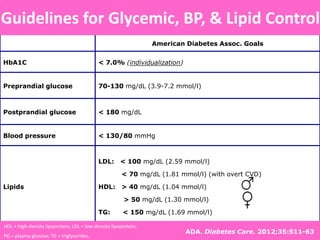
Glycemic targets
- HbA1c < 7.0% (mean PG 150-160 mg/dl [8.3-8.9 mmol/l])
- Pre-prandial PG <130 mg/dl (7.2 mmol/l)
- Post-prandial PG <180 mg/dl (10.0 mmol/l)
- Individualization is key:
Tighter targets (6.0 - 6.5%) - younger, healthier
Looser targets (7.5 - 8.0%+) - older, comorbidities, hypoglycemia
prone, etc.
PG = plasma glucose Diabetes Care, Diabetologia. 19 April 2012
ADA-EASD Position Statement:
Management of Hyperglycemia in T2DM](https://image.slidesharecdn.com/4-130718045235-phpapp01/85/4-diabetes-basic-121-320.jpg)
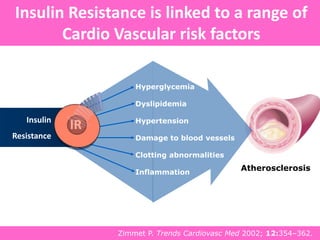
![Diabetes Care, Diabetologia., 19 April 2012 [Epub ahead of print]](https://image.slidesharecdn.com/4-130718045235-phpapp01/85/4-diabetes-basic-122-320.jpg)

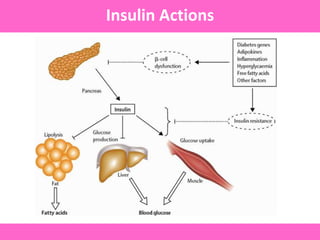

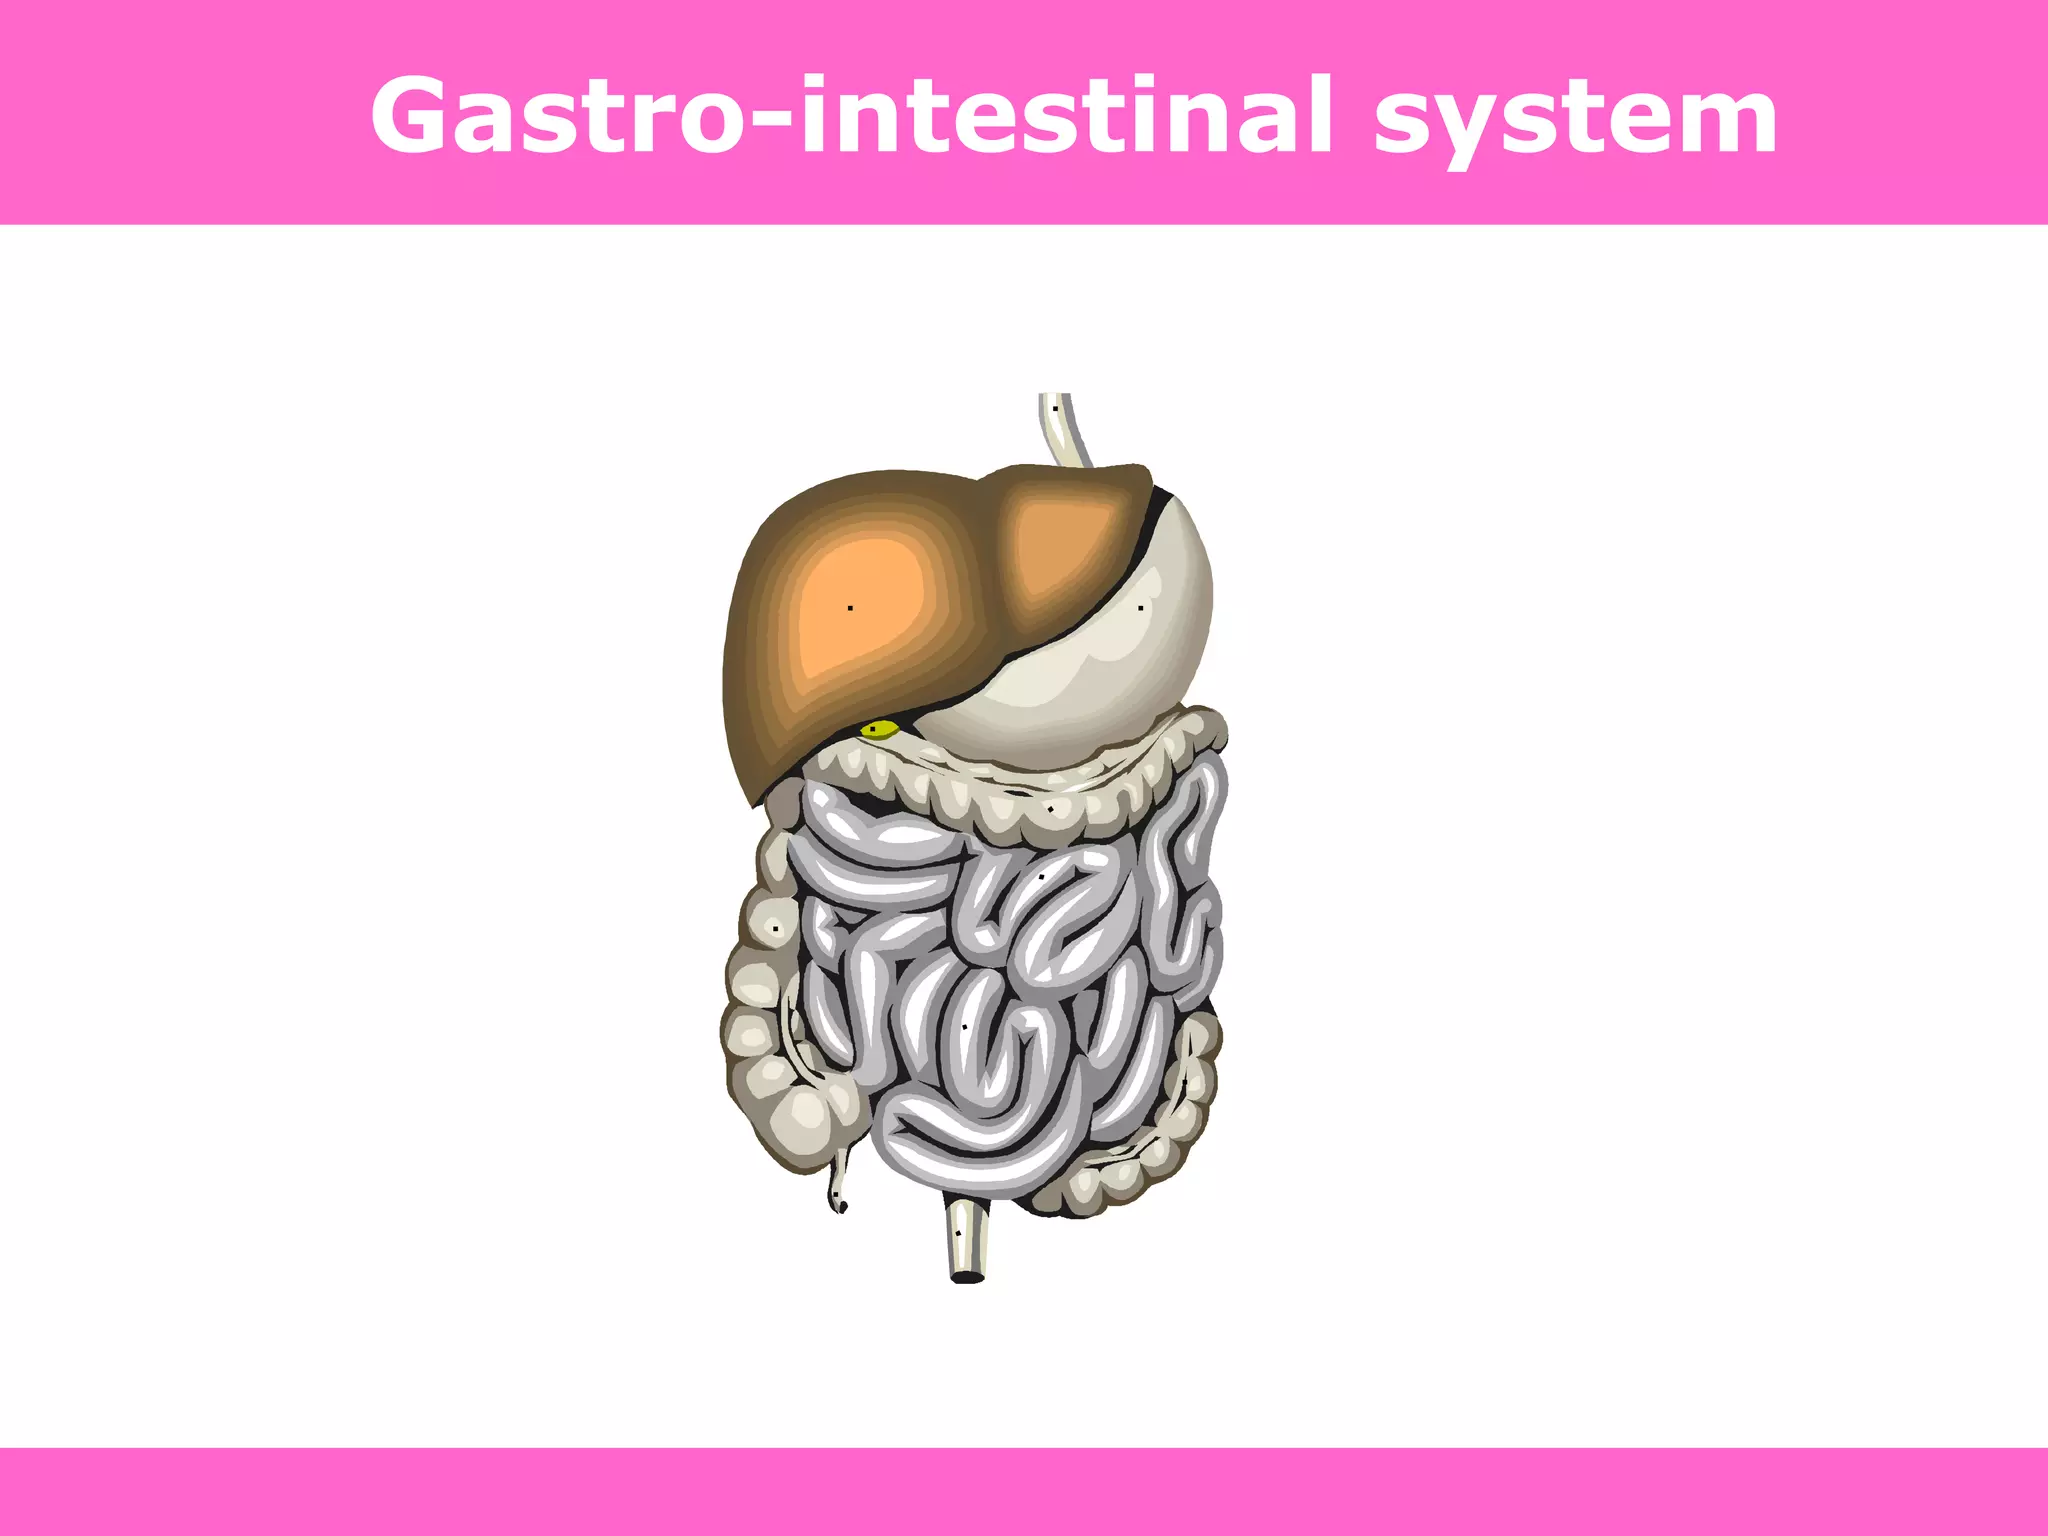
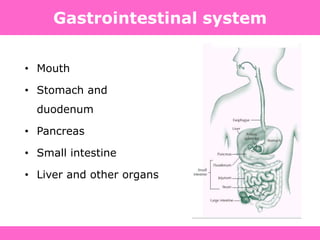
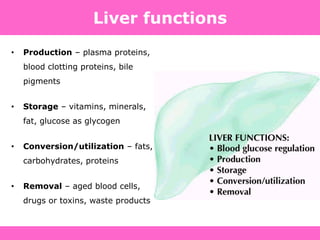
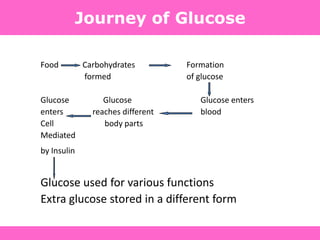
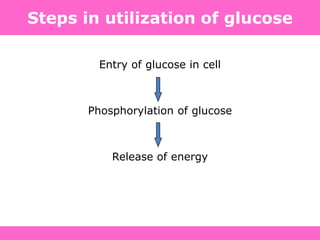
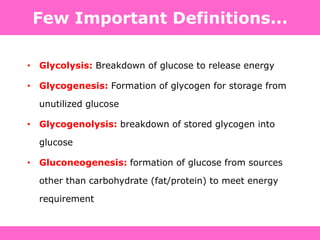
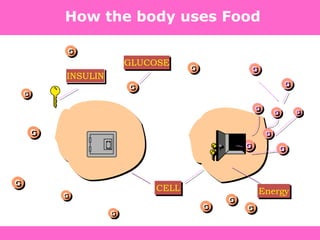
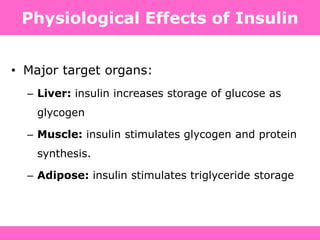
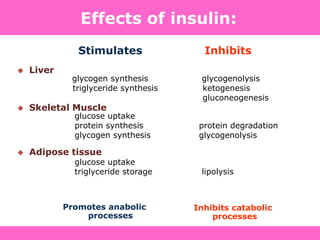
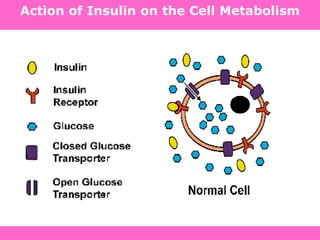
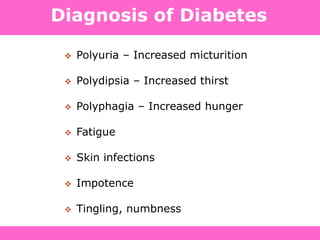
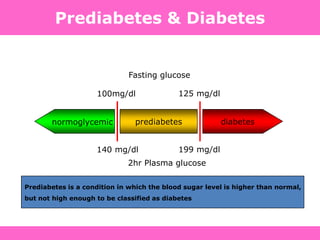
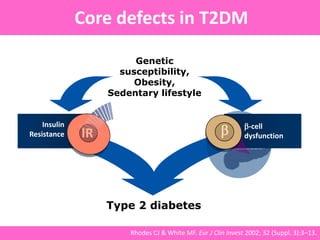
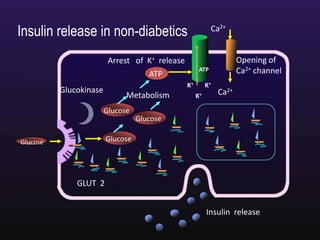
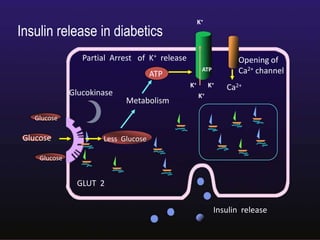
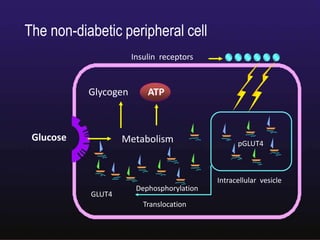
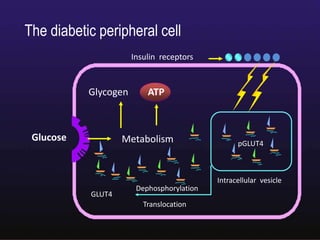
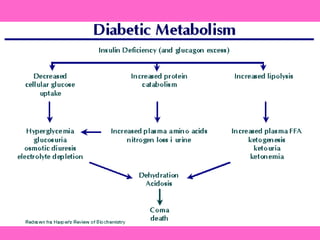
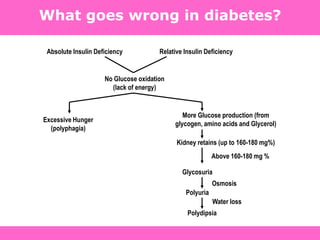
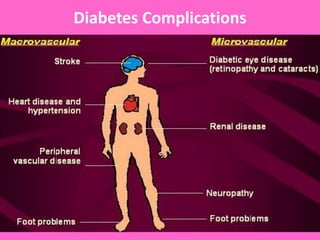
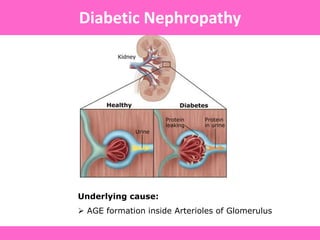
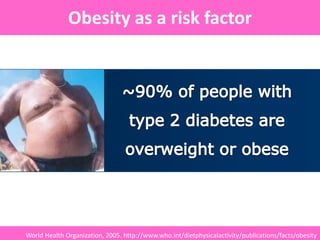
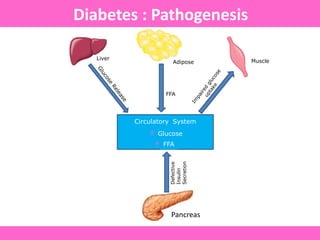
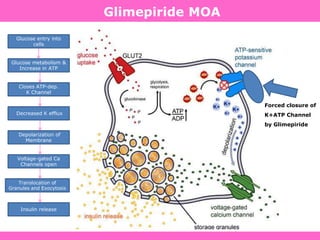
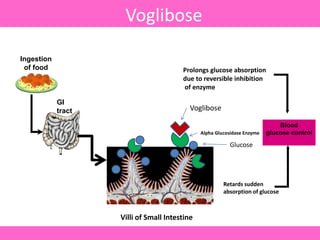
The document discusses the gastrointestinal system and its organs including the mouth, stomach, pancreas, small intestine, and liver. It then describes the liver's functions of producing proteins and bile, storing vitamins and minerals, converting and utilizing fats and carbohydrates, and removing waste. The document notes that carbohydrates provide 60% of the body's energy, with proteins and fats each contributing around 10-12% and 30%, respectively. It outlines the journey of glucose from food to different body parts and its utilization and storage. Key steps in glucose utilization are its entry into cells, phosphorylation, and energy release.


![Skin anatomy chc training 2012 [compatibility mode] [repaired]](https://cdn.slidesharecdn.com/ss_thumbnails/skinanatomychctraining2012compatibilitymoderepaired-131009014235-phpapp01-thumbnail.jpg?width=640&height=640&fit=bounds)


