4.1 coordinate plane 2
•Download as PPTX, PDF•
0 likes•350 views
The document provides examples and practice problems for identifying functions from tables and graphs. It includes: 1) An example of identifying a function from a pairing/table by checking if each input has a single output. 2) An example showing how to make a table and identify the range for the function y=2x. 3) An example graphing a function represented by a table of years and number of votes cast in US presidential elections. 4) A practice problem similarly graphing number of votes cast since 1972 when 18-year olds gained the right to vote. The document provides guidance, examples, and practice identifying and representing functions from tables and graphs.
Report
Share
Report
Share

Recommended
Alg2.7 B Notes
The document provides examples and explanations of reversible and irreversible mathematical operations. It contains examples of:
1) Pairs of math steps that produce the same ending number when starting with the same number.
2) Actions and math operations that can and cannot be reversed, with counterexamples to show irreversible operations.
3) Using backtracking to reverse operations like solving for an unknown variable in an equation.
4) Input-output tables to illustrate whether operations like squaring and cubing are reversible based on whether the input can be determined from the output.
[Question Paper] Visual Basic – 6 (Old Syllabus) [April / 2014]
This document contains a 7 question exam on Visual Basic-6 covering various topics like arrays, controls, loops, functions, data types, formatting, and more. It includes both theoretical and coding questions requiring knowledge of concepts like objects, events, properties, constants, file handling, flow control, and working with controls like listboxes, combo boxes, and dialog boxes. Students are instructed to attempt question 1 and 4 others, with questions having multiple parts worth between 6-8 marks each. Proper formatting and examples are expected in the answers.
MATHS ACTIVITY ON MULTIPLICATION OF DECIMALS
This document describes a procedure for representing the multiplication of decimals using a grid. It involves shading 3 rows and 3 columns on a 10x10 grid to represent 0.3 and 0.7, respectively. The overlapping shaded region shows that 0.3 x 0.7 equals 21/100 or 0.21. The aim is to use horizontal and vertical lines on a square sheet to demonstrate how to calculate the product of decimal numbers.
4.5 graph using slope int form - day 2
The document provides instructions for graphing linear equations using the slope-intercept form. It includes graphing the equations y = 2/3x - 3 and y = -1/4x, finding the slope and y-intercept for each, and writing the equation 3x + 4y = 8 in slope-intercept form to graph it. Students are assigned problems 17 through 26 on page 248 and told to check their work with a graphing calculator.
Writing linear functions edmodo
The document provides examples of representing linear functions in different ways: numerically through tables, graphically by plotting points, and algebraically through equations. It gives three examples - for cell phone costs, textbook shipping costs, and taxi fares - and has the reader fill out tables, create graphs, and write equations to model each situation as a linear function represented in multiple ways.
Math assignment Program
The document contains two C++ programs:
1) A program to plot data entered into a 2D array table. It prompts the user to enter elements into the array, prints horizontal and vertical lines to format the table, and displays the entered elements.
2) A program is requested but not provided to calculate the derivative dy/dx if y=x2+2x+3.
Tema productos notables
The document discusses different methods for expanding binomial expressions, including:
- Expanding (x ± y)2 by distributing the exponent and using the formula x2 ± 2xy + y2
- Expanding (x + y)(x - y) using the formula x2 - y2
- Expanding (x ± b)(x ± d) using the formula x2 ± b ± d + bd
- Expanding (x + y)3 and other binomials to the third power using the formula x3 + 3x2y + 3xy2 + y3
The document provides examples of expanding various binomial expressions using these standard formulas.
Adventures In Programmatic Branding – How To Design With Algorithms And How T...
The document discusses metaballs and isosurfaces as a way to programmatically generate organic-looking branding. Metaballs are a type of isosurface defined by mathematical functions that can be iterated over pixels to create shapes. While algorithms can generate results, including the client and designer in the process ensures the output aligns with the goals.
8 6 Notes
This document discusses slope-intercept form for linear equations and how to use it to graph lines. It explains that in the form y=mx+b, m represents the slope and b represents the y-intercept. Examples are given of finding the slope and y-intercept from equations in slope-intercept form and using those values to graph the lines. Students are instructed to graph lines using their slope and y-intercept, finding additional points using the slope and connecting the points to extend the line.
Matrices Chapter 4 Obj. 1.04,2.10
The document defines matrices and matrix operations such as addition, subtraction and scalar multiplication. It provides examples of using matrices to organize data on students' wins and losses in a chess competition. It also discusses rules for matrix multiplication, including that the number of columns in the first matrix must equal the number of rows in the second matrix for the product to be defined. Examples are provided to illustrate solving systems of equations using matrix addition and multiplication.
Multiplying polynomials
To multiply a binomial and a trinomial:
1. Arrange the terms in a grid with the first parenthesis vertical and the second horizontal.
2. Multiply the numbers and add the exponents of like terms.
3. Combine like terms by adding the coefficients and keeping the exponent the same.
Hsc commerce-2014-march-maths1
This document provides the questions from a board exam paper in March 2014. It includes 6 questions with multiple parts about mathematics concepts like matrices, integrals, derivatives, logic, and cost functions. Students are instructed to show their work, write answers in separate books for each section, and start new pages for each question. The questions cover topics like matrix operations, evaluating integrals, solving equations, analyzing logical statements, and finding extreme values, inverses, and revolutions of geometric shapes.
Final matrix ppt
This document defines matrices and various types of matrices such as vectors, scalar matrices, square matrices, symmetric matrices, diagonal matrices, and identity matrices. It also describes common matrix operations like addition, subtraction, and multiplication. Matrix addition and subtraction can be performed if the matrices have the same number of rows and columns. Matrix multiplication is possible if the number of columns of the first matrix is equal to the number of rows of the second matrix. The steps to calculate matrix multiplication are shown. Additionally, the process for finding the inverse of a 2x2 matrix is outlined in 4 steps: calculating the determinant, swapping elements, changing sign of elements, and dividing by the determinant.
Class 8 Cbse Maths Syllabus 2011-12
Cbse Class 8 Maths Syllabus 2011-12 - http://cbse.edurite.com/cbse-maths/cbse-maths-syllabus-for-class-8.html
U6 review
This document contains a review worksheet with 35 questions covering topics in exponential and logarithmic functions including determining if equations represent exponential growth or decay, graphing functions and their inverses, evaluating logarithmic expressions with and without a calculator, solving exponential equations, and applying exponential and logarithmic concepts to word problems involving population growth, depreciation, radioactive decay, compound interest, and stock price growth.
5 4b Graphing Lines
This document provides instructions for graphing linear equations in slope-intercept form (y=mx+b). To graph: 1) Write the equation in y=mx+b form, 2) Plot the y-intercept, 3) Use the slope to determine if the line increases or decreases as you move from point to point, and 4) Draw the line connecting all points. Examples given are y=3x+1, y=x-5, y=7, and y=2x+3.
Alg II Unit 4-8 Quadratic Equations and Complex Numbers
The document discusses complex numbers, including:
- Complex numbers are based on the imaginary unit i, where i^2 = -1.
- Complex numbers can be expressed as a + bi and graphed in the complex plane.
- Operations like addition, subtraction, multiplication, and division can be performed on complex numbers by combining real and imaginary parts.
- Quadratic equations can have complex number solutions. Finding these solutions involves factoring or using the quadratic formula.
AP Calculus January 5, 2009
The document contains 5 practice questions about derivatives and calculus concepts. Question 1 asks about the interval on which a function is increasing. Question 2 asks about the number of inputs where a condition is true. Question 3 analyzes the concavity and behavior of a function based on its derivative values. Question 4 calculates the derivative of a related function. Question 5 determines the value of k if a function has a local minimum.
Mb 106 quantitative techniques 10
This document discusses an example of using linear programming to determine the optimal product mix for a company given constraints on available raw materials. The problem is modeled as a linear programming problem with an objective to maximize total profit. The optimal solution and dual problem are determined. Shadow prices in the dual problem provide the marginal value or accounting value of each raw material if sold instead of used internally. They represent the loss or gain from utilizing one more unit of each constrained resource.
4.5 notes
This document discusses how to graph linear equations using slope-intercept form. It identifies the slope and y-intercept of several equations in slope-intercept form, such as y=3x+4 and 3x-3y=12. It then shows how to graph these equations by plotting the y-intercept and running the line with the given slope. As an example, it graphs the equation y=5x-3 on an xy-plane. It also demonstrates graphing parallel lines, such as y=3x+4 and y=3x+6, which have the same slope but different y-intercepts.
4 7 Notes B
This document provides instruction on writing and graphing linear equations in different forms. It begins with a review of equivalent forms of linear equations, including point-slope, slope-intercept, and standard form. Students are then given examples of writing equations of lines given a point and slope, or two points. The document concludes with examples of graphing lines by using the point-slope and slope-intercept forms to easily find points and draw the line. Students are challenged to graph a line given in standard form and explain their process.
AP Calculus Slides December 10, 2007
This document contains several calculus practice problems related to applications of derivatives. It includes questions about determining where a function is increasing or decreasing based on its graph, finding values of derivatives from a table, determining concavity from a table of derivatives, approximating derivatives, identifying conditions for local extrema, sketching graphs with horizontal asymptotes, and determining domains and ranges.
Mb 106 quantitative techniques 17
This document summarizes key concepts in game theory presented by Prof. Krishna Roy. It discusses two-person zero-sum games, strategies (pure, mixed, and optimal), and principles for determining equilibrium including maximin-minimax and saddle points. Examples are provided to illustrate reducing games through dominance and determining mixed strategies using oddments or graphically. The value of the game is defined as the expected payoff when players follow optimal strategies.
Math 116 pres. 1
CHAPTER 2 Whole Numbers: Introducing a Mathematical System
2.3 Algebraic Extensions of Order of Operations to Polynomials
Calculus and Numerical Method =_=
This document outlines a course on Calculus and Numerical Methods over two parts. Part one covers calculus topics like functions, graphs, limits, differentiation, integration and differential equations over 7 weeks. Part two covers numerical methods topics like errors, root finding, interpolation, numerical differentiation and integration, and solving ordinary differential equations over 6 weeks. There are three learning outcomes focusing on applying calculus and numerical methods concepts, solving problems using programming, and solving real-life problems. Students will be assessed through tests, assignments, midterms and a final exam testing the different learning outcomes. The course then provides details on the topics and subtopics to be covered in the first part on functions and graphs.
Msm1 fl ch10_01
The document provides examples and explanations of writing equations to describe functions from tables, words, and real-world scenarios. It includes examples of writing equations for linear functions given tables of x and y values, translating word problems into mathematical equations, and using data about tickets sold and money received to write an equation for that function. Practice problems are provided to write equations for new functions based on the examples and explanations given.
REPRESENTATION OF FUNCTIONS.pptx
This document discusses functions and their representations. It begins by defining relations and functions, and providing examples of each. It then discusses different types of functions including linear, quadratic, constant, identity, absolute value, and piecewise functions. Examples are provided for each type. The document ends with exercises asking the reader to determine if given relations are functions, and to identify what type of function is being described.
Unit 1.7
This document discusses functions and modeling with functions. It provides examples of defining functions from formulas, graphs, verbal descriptions, and data. One example shows defining the volume of a box as a function of the side length of squares cut out of the corners, finding the domain and maximum volume. Another example models the growth of a grain pile using a function for the volume of a cone. The document also covers constructing functions from scatter plot data and using technology for curve fitting.
Logic System Design KTU Chapter-4.ppt
This document discusses combinational logic circuits and their analysis and design using Boolean algebra and Karnaugh maps. It covers concepts like logic gates, Boolean functions, truth tables, logic minimization, adders, comparators, decoders, encoders, multiplexers and their implementation in Verilog. Example circuits described include half adder, full adder, binary multiplier, magnitude comparator, decoder, encoder, multiplexer. Analysis methods covered are deriving truth tables from logic diagrams, using Karnaugh maps for function minimization, and verifying designs using test benches in Verilog.
297Source NASA.5.1 Rules for Exponents5.2 Addition.docx
297
Source: NASA.
5.1 Rules for Exponents
5.2 Addition and Subtrac-
tion of Polynomials
5.3 Multiplication of
Polynomials
5.4 Special Products
5.5 Integer Exponents and
the Quotient Rule
5.6 Division of Polynomials
Digital images were first sent between New York and London by cable in the
early 1920s. Unfortunately, the transmission time was 3 hours and the quality was poor.
Digital photography was developed further by NASA in the 1960s because ordinary pic-
tures were subject to interference when transmitted through space. Today, digital pic-
tures remain crystal clear even if they travel millions of miles. The following digital
picture shows the planet Mars.
Whether they are taken with a webcam, with a smartphone, or by the Mars rover,
digital images comprise tiny units called pixels, which are represented by numbers. As a
result, mathematics plays an important role in digital images. In this chapter we illustrate
some of the ways mathematics is used to describe digital pictures (see Example 4 and
Exercise 80 in Section 5.4). We also discuss how mathematics is used to model things
such as heart rate, computer sales, motion of the planets, and interest on money.
5 Polynomials and Exponents
If you want to do
something, do it!
—PLAUTUS
IS
B
N
1-
25
6-
49
08
2-
2
Beginning and Intermediate Algebra with Applications & Visualization, Third edition, by Gary K. Rockswold and Terry A. Krieger. Published by Addison Wesley.
Copyright © 2013 by Pearson Education, Inc.
298 CHAPTER 5 POLYNOMIALS AND EXPONENTS
When evaluating expressions, evaluate exponents before performing addition, subtraction,
multiplication, division, or negation.
5.1 Rules for Exponents
Review of Bases and Exponents ● Zero Exponents ● The Product Rule ● Power Rules
A LOOK INTO MATH N Electronic devices such as tablet computers and smartphones store information as bits.
A bit is either a 0 or a 1, and a string of 8 bits is called a byte. In the 1970s, IBM devel-
oped punch cards made out of paper that could hold up to 120 bits of information. Today,
many computer hard drives can hold more than 1 terabyte of information; that’s more than
8,000,000,000,000 bits! In mathematics, we often use exponents to express such large
numbers. In this section, we discuss the rules for exponents.
Review of Bases and Exponents
The expression 53 is an exponential expression with base 5 and exponent 3. Its value is
5 # 5 # 5 = 125.
In general, bn is an exponential expression with base b and exponent n. If n is a natural
number, it indicates the number of times the base b is to be multiplied with itself.
Exponent T
bn = b # b # b # g # b
Base c n times
v
STUDY TIP
Exponents occur throughout
mathematics. Because expo-
nents are so important, this
section is essential for your
success in mathematics. It
takes practice, so set aside
some extra time.
EVALUATING EXPRESSIONS
When evaluating expressions, use the following order of operations.
1. .
More Related Content
What's hot
8 6 Notes
This document discusses slope-intercept form for linear equations and how to use it to graph lines. It explains that in the form y=mx+b, m represents the slope and b represents the y-intercept. Examples are given of finding the slope and y-intercept from equations in slope-intercept form and using those values to graph the lines. Students are instructed to graph lines using their slope and y-intercept, finding additional points using the slope and connecting the points to extend the line.
Matrices Chapter 4 Obj. 1.04,2.10
The document defines matrices and matrix operations such as addition, subtraction and scalar multiplication. It provides examples of using matrices to organize data on students' wins and losses in a chess competition. It also discusses rules for matrix multiplication, including that the number of columns in the first matrix must equal the number of rows in the second matrix for the product to be defined. Examples are provided to illustrate solving systems of equations using matrix addition and multiplication.
Multiplying polynomials
To multiply a binomial and a trinomial:
1. Arrange the terms in a grid with the first parenthesis vertical and the second horizontal.
2. Multiply the numbers and add the exponents of like terms.
3. Combine like terms by adding the coefficients and keeping the exponent the same.
Hsc commerce-2014-march-maths1
This document provides the questions from a board exam paper in March 2014. It includes 6 questions with multiple parts about mathematics concepts like matrices, integrals, derivatives, logic, and cost functions. Students are instructed to show their work, write answers in separate books for each section, and start new pages for each question. The questions cover topics like matrix operations, evaluating integrals, solving equations, analyzing logical statements, and finding extreme values, inverses, and revolutions of geometric shapes.
Final matrix ppt
This document defines matrices and various types of matrices such as vectors, scalar matrices, square matrices, symmetric matrices, diagonal matrices, and identity matrices. It also describes common matrix operations like addition, subtraction, and multiplication. Matrix addition and subtraction can be performed if the matrices have the same number of rows and columns. Matrix multiplication is possible if the number of columns of the first matrix is equal to the number of rows of the second matrix. The steps to calculate matrix multiplication are shown. Additionally, the process for finding the inverse of a 2x2 matrix is outlined in 4 steps: calculating the determinant, swapping elements, changing sign of elements, and dividing by the determinant.
Class 8 Cbse Maths Syllabus 2011-12
Cbse Class 8 Maths Syllabus 2011-12 - http://cbse.edurite.com/cbse-maths/cbse-maths-syllabus-for-class-8.html
U6 review
This document contains a review worksheet with 35 questions covering topics in exponential and logarithmic functions including determining if equations represent exponential growth or decay, graphing functions and their inverses, evaluating logarithmic expressions with and without a calculator, solving exponential equations, and applying exponential and logarithmic concepts to word problems involving population growth, depreciation, radioactive decay, compound interest, and stock price growth.
5 4b Graphing Lines
This document provides instructions for graphing linear equations in slope-intercept form (y=mx+b). To graph: 1) Write the equation in y=mx+b form, 2) Plot the y-intercept, 3) Use the slope to determine if the line increases or decreases as you move from point to point, and 4) Draw the line connecting all points. Examples given are y=3x+1, y=x-5, y=7, and y=2x+3.
Alg II Unit 4-8 Quadratic Equations and Complex Numbers
The document discusses complex numbers, including:
- Complex numbers are based on the imaginary unit i, where i^2 = -1.
- Complex numbers can be expressed as a + bi and graphed in the complex plane.
- Operations like addition, subtraction, multiplication, and division can be performed on complex numbers by combining real and imaginary parts.
- Quadratic equations can have complex number solutions. Finding these solutions involves factoring or using the quadratic formula.
AP Calculus January 5, 2009
The document contains 5 practice questions about derivatives and calculus concepts. Question 1 asks about the interval on which a function is increasing. Question 2 asks about the number of inputs where a condition is true. Question 3 analyzes the concavity and behavior of a function based on its derivative values. Question 4 calculates the derivative of a related function. Question 5 determines the value of k if a function has a local minimum.
Mb 106 quantitative techniques 10
This document discusses an example of using linear programming to determine the optimal product mix for a company given constraints on available raw materials. The problem is modeled as a linear programming problem with an objective to maximize total profit. The optimal solution and dual problem are determined. Shadow prices in the dual problem provide the marginal value or accounting value of each raw material if sold instead of used internally. They represent the loss or gain from utilizing one more unit of each constrained resource.
4.5 notes
This document discusses how to graph linear equations using slope-intercept form. It identifies the slope and y-intercept of several equations in slope-intercept form, such as y=3x+4 and 3x-3y=12. It then shows how to graph these equations by plotting the y-intercept and running the line with the given slope. As an example, it graphs the equation y=5x-3 on an xy-plane. It also demonstrates graphing parallel lines, such as y=3x+4 and y=3x+6, which have the same slope but different y-intercepts.
4 7 Notes B
This document provides instruction on writing and graphing linear equations in different forms. It begins with a review of equivalent forms of linear equations, including point-slope, slope-intercept, and standard form. Students are then given examples of writing equations of lines given a point and slope, or two points. The document concludes with examples of graphing lines by using the point-slope and slope-intercept forms to easily find points and draw the line. Students are challenged to graph a line given in standard form and explain their process.
AP Calculus Slides December 10, 2007
This document contains several calculus practice problems related to applications of derivatives. It includes questions about determining where a function is increasing or decreasing based on its graph, finding values of derivatives from a table, determining concavity from a table of derivatives, approximating derivatives, identifying conditions for local extrema, sketching graphs with horizontal asymptotes, and determining domains and ranges.
Mb 106 quantitative techniques 17
This document summarizes key concepts in game theory presented by Prof. Krishna Roy. It discusses two-person zero-sum games, strategies (pure, mixed, and optimal), and principles for determining equilibrium including maximin-minimax and saddle points. Examples are provided to illustrate reducing games through dominance and determining mixed strategies using oddments or graphically. The value of the game is defined as the expected payoff when players follow optimal strategies.
What's hot (15)
Alg II Unit 4-8 Quadratic Equations and Complex Numbers
Alg II Unit 4-8 Quadratic Equations and Complex Numbers
Similar to 4.1 coordinate plane 2
Math 116 pres. 1
CHAPTER 2 Whole Numbers: Introducing a Mathematical System
2.3 Algebraic Extensions of Order of Operations to Polynomials
Calculus and Numerical Method =_=
This document outlines a course on Calculus and Numerical Methods over two parts. Part one covers calculus topics like functions, graphs, limits, differentiation, integration and differential equations over 7 weeks. Part two covers numerical methods topics like errors, root finding, interpolation, numerical differentiation and integration, and solving ordinary differential equations over 6 weeks. There are three learning outcomes focusing on applying calculus and numerical methods concepts, solving problems using programming, and solving real-life problems. Students will be assessed through tests, assignments, midterms and a final exam testing the different learning outcomes. The course then provides details on the topics and subtopics to be covered in the first part on functions and graphs.
Msm1 fl ch10_01
The document provides examples and explanations of writing equations to describe functions from tables, words, and real-world scenarios. It includes examples of writing equations for linear functions given tables of x and y values, translating word problems into mathematical equations, and using data about tickets sold and money received to write an equation for that function. Practice problems are provided to write equations for new functions based on the examples and explanations given.
REPRESENTATION OF FUNCTIONS.pptx
This document discusses functions and their representations. It begins by defining relations and functions, and providing examples of each. It then discusses different types of functions including linear, quadratic, constant, identity, absolute value, and piecewise functions. Examples are provided for each type. The document ends with exercises asking the reader to determine if given relations are functions, and to identify what type of function is being described.
Unit 1.7
This document discusses functions and modeling with functions. It provides examples of defining functions from formulas, graphs, verbal descriptions, and data. One example shows defining the volume of a box as a function of the side length of squares cut out of the corners, finding the domain and maximum volume. Another example models the growth of a grain pile using a function for the volume of a cone. The document also covers constructing functions from scatter plot data and using technology for curve fitting.
Logic System Design KTU Chapter-4.ppt
This document discusses combinational logic circuits and their analysis and design using Boolean algebra and Karnaugh maps. It covers concepts like logic gates, Boolean functions, truth tables, logic minimization, adders, comparators, decoders, encoders, multiplexers and their implementation in Verilog. Example circuits described include half adder, full adder, binary multiplier, magnitude comparator, decoder, encoder, multiplexer. Analysis methods covered are deriving truth tables from logic diagrams, using Karnaugh maps for function minimization, and verifying designs using test benches in Verilog.
297Source NASA.5.1 Rules for Exponents5.2 Addition.docx
297
Source: NASA.
5.1 Rules for Exponents
5.2 Addition and Subtrac-
tion of Polynomials
5.3 Multiplication of
Polynomials
5.4 Special Products
5.5 Integer Exponents and
the Quotient Rule
5.6 Division of Polynomials
Digital images were first sent between New York and London by cable in the
early 1920s. Unfortunately, the transmission time was 3 hours and the quality was poor.
Digital photography was developed further by NASA in the 1960s because ordinary pic-
tures were subject to interference when transmitted through space. Today, digital pic-
tures remain crystal clear even if they travel millions of miles. The following digital
picture shows the planet Mars.
Whether they are taken with a webcam, with a smartphone, or by the Mars rover,
digital images comprise tiny units called pixels, which are represented by numbers. As a
result, mathematics plays an important role in digital images. In this chapter we illustrate
some of the ways mathematics is used to describe digital pictures (see Example 4 and
Exercise 80 in Section 5.4). We also discuss how mathematics is used to model things
such as heart rate, computer sales, motion of the planets, and interest on money.
5 Polynomials and Exponents
If you want to do
something, do it!
—PLAUTUS
IS
B
N
1-
25
6-
49
08
2-
2
Beginning and Intermediate Algebra with Applications & Visualization, Third edition, by Gary K. Rockswold and Terry A. Krieger. Published by Addison Wesley.
Copyright © 2013 by Pearson Education, Inc.
298 CHAPTER 5 POLYNOMIALS AND EXPONENTS
When evaluating expressions, evaluate exponents before performing addition, subtraction,
multiplication, division, or negation.
5.1 Rules for Exponents
Review of Bases and Exponents ● Zero Exponents ● The Product Rule ● Power Rules
A LOOK INTO MATH N Electronic devices such as tablet computers and smartphones store information as bits.
A bit is either a 0 or a 1, and a string of 8 bits is called a byte. In the 1970s, IBM devel-
oped punch cards made out of paper that could hold up to 120 bits of information. Today,
many computer hard drives can hold more than 1 terabyte of information; that’s more than
8,000,000,000,000 bits! In mathematics, we often use exponents to express such large
numbers. In this section, we discuss the rules for exponents.
Review of Bases and Exponents
The expression 53 is an exponential expression with base 5 and exponent 3. Its value is
5 # 5 # 5 = 125.
In general, bn is an exponential expression with base b and exponent n. If n is a natural
number, it indicates the number of times the base b is to be multiplied with itself.
Exponent T
bn = b # b # b # g # b
Base c n times
v
STUDY TIP
Exponents occur throughout
mathematics. Because expo-
nents are so important, this
section is essential for your
success in mathematics. It
takes practice, so set aside
some extra time.
EVALUATING EXPRESSIONS
When evaluating expressions, use the following order of operations.
1. .
1.6 functions as rules and tables
The document discusses representing functions as rules and tables. It provides examples of identifying the domain and range of functions given tables of inputs and outputs. It also gives examples of writing rules for functions based on real world situations and identifying the independent and dependent variables. Students are assigned practice problems identifying domains and ranges of functions and writing rules for functions. They will have a quiz on representing functions as rules and tables the next day.
combinational circuits dispositivos .ppt
This document provides an overview of combinational logic circuits. It discusses the basic components and analysis procedures for combinational circuits. Examples are provided to demonstrate how to derive truth tables and Boolean functions from logic diagrams. Common combinational components like adders, decoders, encoders, and multiplexers are described along with their logic diagrams and implementations. HDL modeling techniques for combinational circuits using Verilog are also covered at the gate level and behavioral level.
Paper no. 4
This document provides instructions on how to evaluate algebraic expressions using a Casio fx-350ES PLUS calculator. It includes an example of evaluating the expression a2+b3 when a=4 and b=2. The steps shown are to assign the values 4 and 2 to the variables a and b using the calculator's storage function, then using the variables to calculate the expression. Exercises are provided to evaluate other algebraic expressions using the given calculator.
introduction to Operation Research
The document discusses linear programming and provides examples to illustrate the process. It explains that linear programming involves optimizing a linear objective function subject to linear constraints. There are three basic components: decision variables, an objective to optimize, and constraints. Examples show how to formulate the objective function and constraints as linear equations or inequalities. The optimal solution is found by analyzing the feasible region defined by the constraints and determining which corner point gives the best value for the objective function.
Similar to 4.1 coordinate plane 2 (12)
297Source NASA.5.1 Rules for Exponents5.2 Addition.docx
297Source NASA.5.1 Rules for Exponents5.2 Addition.docx
More from bweldon
What shape is your name
This document provides instructions for an activity where students will write their name vertically, assign numbers to each letter, perform mathematical operations on those numbers, plot the results on a graph, and connect the points to reveal the shape of their name. Students are asked to bring art supplies to class and will work through the steps, checking their work with a partner before plotting and connecting the points on their graph and decorating it.
FM HS Girls Summer Schedule
This document outlines the schedule for the FM High School girls basketball program for June and July 2017. It includes times for high school shooting camps, basketball teams, and open gym sessions on Mondays, Tuesdays, Wednesdays, Thursdays and Fridays. Some weeks include additional shooting camps for 4th through 8th graders. The schedule notes "No Girls BBall" or "Dead Week" for certain dates with no activities planned.
FM Girls BBall Summer Schedule
The document outlines the summer schedule for the FM Girls Basketball program, including open gym times for different age groups from Mondays through Fridays in July. Skills camps are also scheduled on Wednesdays for younger age groups, while high school basketball and 3 on 3 tournaments for middle schoolers take place on certain days.
FM Girls BBall Summer Schedule - June
The document outlines the summer schedule for the FM Girls Basketball program. It includes shooting camps, skills camps, and open gym times for different age groups from Mondays through Fridays in July. Shooting camps are offered for high school, 4th-8th grade, and 2nd-3rd grade groups. Skills camps are for 2nd-3rd and 2nd-4th graders. Open gym times are provided for high school, 5th-12th graders, and 7th/8th graders and high schoolers.
FM Youth Girls Basketball - Summer 2017
This document provides the schedule for the FM Youth Girls Basketball program for June and July 2017. It includes times for shooting camps, skills camps, and open gym sessions for girls in grades 2nd through 8th. The schedule runs from Mondays to Fridays and includes a mix of single grade and multi-grade sessions focused on skills development and playing time.
June BBall Schedule
The summer schedule provides basketball activities for girls in elementary, middle, and high school from July 5th through July 30th, including shooting camps, skills camps, open gym times for various age groups, and a 3 on 3 camp during the last week. Shooting camps are offered daily for high school, elementary/middle school, and a skills camp for 2nd and 3rd graders. Open gym times allow for pick-up games for 7th/8th graders and high schoolers, as well as all 5th through 12th graders.
Central shooting academy flyer
The document is a waiver and registration form for a shooting academy at Fremont Mills High School in June 2017. It states that by signing, the student waives any claims against the shooting academy or high school for injuries during the program in June. It also notes the organizers are not responsible for lost, damaged, or stolen property. The bottom portion requests contact information and asks for payment to be submitted to the high school athletic office or coach.
4r statistics and probability relearning
This document provides questions to help review key concepts of statistics and probability including:
1. Reading scatter plots and determining the type of correlation based on the direction of the graph.
2. Creating scatter plots, drawing lines of best fit, and determining the slope and y-intercept to make conclusions about trends in data.
3. Constructing and interpreting two-way tables of data including finding marginal frequencies and percentages.
5r linear systems relearning
This document contains questions about linear systems and how to solve them. It asks about determining the number of solutions based on whether the slopes and y-intercepts are the same or different. It also asks how to graph systems, write solutions, and use substitution to solve algebraic equations for systems.
3r linear equations relearning
This document provides instruction on graphing and writing linear equations. It covers determining the slope and y-intercept from an equation in slope-intercept form, comparing slopes from different representations, finding the slope and y-intercept from a graph to write an equation, using slope triangles to show a constant rate of change, and writing equations given a table, slope and point, or two points.
Linear equations review
This document reviews linear equations by having the reader graph sample equations, determine their slopes and y-intercepts, compare slopes to determine which equation is steeper, and write equations based on given information. It also asks the reader to find and compare slopes of additional equations.
Slope Stuff
This document discusses completing two graphic organizers to help remember the four types of slope: positive, negative, zero, and undefined. It introduces "Slope Guy" and "Slope Tree" organizers that will be filled in to categorize the different slope types.
The role of your coaches
The coach's role is to create a positive team culture focused on sportsmanship, work ethic and teamwork. The coach works hard to make the team successful through practice, scouting, clinics and film. They teach basketball skills positively while correcting mistakes and encouraging good play, and set a good example in behavior. The coach pushes athletes to their highest potential in basketball and academics, communicates with players and parents, and decides playing time based on which players will help the team succeed most.
Player's Role
Players should work hard to create a positive basketball culture by accepting their role and improving themselves. They must show good sportsmanship, communicate well with teammates and coaches, and understand that team success is more important than any individual. Players should always follow the program's rules by playing hard, smart, and together while accepting coaching and helping each other improve.
Culture
Playing time is earned based on how hard a player works in practice, their communication and attitude, and how they help the team win by executing the offensive and defensive systems and accepting their role. Players are expected to always play hard by hustling on and off the floor, competing during games and practice, and fighting through adversity with toughness. They must also always play smart by accepting coaching, avoiding turnovers, knowing their role, and improving individually. Most importantly, players must always play together by making others better, sharing the ball, being positive and encouraging teammates, and helping each other.
November 2016 BBall Calendar
This document is a printable November 2016 calendar with no notes or events filled in. It displays a basic grid layout with the days of the week and dates for the month. Additional information at the bottom provides links to download a calendar creator software that allows for customization of layouts, colors and inclusion of holidays on created calendars, as well as importing calendar data from other services.
Functions Study Guided
This document provides a study guide for determining whether a table, set of ordered pairs, or graph represent a function. It includes 12 multiple choice questions asking how to identify if something is a function or linear, and whether specific examples shown are functions or linear. It then has 6 additional questions asking the learner to determine if examples provided are functions or linear, and explain their reasoning. The study guide is intended to help the learner practice identifying functions and linear relationships from different representations.
Functions fill in the blank passage
A function is a mathematical rule that assigns each input exactly one output. Functions can be represented as ordered pairs, tables, graphs or equations. When represented as ordered pairs or tables, there cannot be repeats in the x-values, otherwise it is not a function. On a graph, if a vertical line intersects the graph more than once, it is not a function. Functions can be linear or non-linear. A linear function has a constant rate of change, while a non-linear function will have variables with exponents or multiplied together.
Functions fill in the blank passage
A function is a mathematical rule that assigns each input exactly one output. Functions can be represented as ordered pairs, tables, graphs or equations. When represented as ordered pairs or tables, there cannot be repeats in the x-values, otherwise it is not a function. On a graph, if a vertical line intersects the graph more than once, it is not a function. Functions can be linear or non-linear. A linear function has a constant rate of change, while a non-linear function does not have a straight line graph or variables with exponents or being multiplied.
Linear functions station 3
1. The function y = 7 + 3(x - 2) is linear because it can be written in the form y = mx + b, where m is the slope (3) and b is the y-intercept (7).
2. The data points (1, 12) (2,7) (3,4) (4, 3) (5, 4) define a non-linear relationship because as x increases, y does not increase or decrease at a consistent rate.
3. No information is provided to determine if a third function is linear or non-linear.
More from bweldon (20)
Recently uploaded
“Building and Scaling AI Applications with the Nx AI Manager,” a Presentation...
“Building and Scaling AI Applications with the Nx AI Manager,” a Presentation...Edge AI and Vision Alliance
For the full video of this presentation, please visit: https://www.edge-ai-vision.com/2024/06/building-and-scaling-ai-applications-with-the-nx-ai-manager-a-presentation-from-network-optix/
Robin van Emden, Senior Director of Data Science at Network Optix, presents the “Building and Scaling AI Applications with the Nx AI Manager,” tutorial at the May 2024 Embedded Vision Summit.
In this presentation, van Emden covers the basics of scaling edge AI solutions using the Nx tool kit. He emphasizes the process of developing AI models and deploying them globally. He also showcases the conversion of AI models and the creation of effective edge AI pipelines, with a focus on pre-processing, model conversion, selecting the appropriate inference engine for the target hardware and post-processing.
van Emden shows how Nx can simplify the developer’s life and facilitate a rapid transition from concept to production-ready applications.He provides valuable insights into developing scalable and efficient edge AI solutions, with a strong focus on practical implementation.Uni Systems Copilot event_05062024_C.Vlachos.pdf
Unlocking Productivity: Leveraging the Potential of Copilot in Microsoft 365, a presentation by Christoforos Vlachos, Senior Solutions Manager – Modern Workplace, Uni Systems
みなさんこんにちはこれ何文字まで入るの?40文字以下不可とか本当に意味わからないけどこれ限界文字数書いてないからマジでやばい文字数いけるんじゃないの?えこ...
ここ3000字までしか入らないけどタイトルの方がたくさん文字入ると思います。
GraphSummit Singapore | The Future of Agility: Supercharging Digital Transfor...
Leonard Jayamohan, Partner & Generative AI Lead, Deloitte
This keynote will reveal how Deloitte leverages Neo4j’s graph power for groundbreaking digital twin solutions, achieving a staggering 100x performance boost. Discover the essential role knowledge graphs play in successful generative AI implementations. Plus, get an exclusive look at an innovative Neo4j + Generative AI solution Deloitte is developing in-house.
Presentation of the OECD Artificial Intelligence Review of Germany
Consult the full report at https://www.oecd.org/digital/oecd-artificial-intelligence-review-of-germany-609808d6-en.htm
Goodbye Windows 11: Make Way for Nitrux Linux 3.5.0!
As the digital landscape continually evolves, operating systems play a critical role in shaping user experiences and productivity. The launch of Nitrux Linux 3.5.0 marks a significant milestone, offering a robust alternative to traditional systems such as Windows 11. This article delves into the essence of Nitrux Linux 3.5.0, exploring its unique features, advantages, and how it stands as a compelling choice for both casual users and tech enthusiasts.
Enchancing adoption of Open Source Libraries. A case study on Albumentations.AI
Enchancing adoption of Open Source Libraries. A case study on Albumentations.AIVladimir Iglovikov, Ph.D.
Presented by Vladimir Iglovikov:
- https://www.linkedin.com/in/iglovikov/
- https://x.com/viglovikov
- https://www.instagram.com/ternaus/
This presentation delves into the journey of Albumentations.ai, a highly successful open-source library for data augmentation.
Created out of a necessity for superior performance in Kaggle competitions, Albumentations has grown to become a widely used tool among data scientists and machine learning practitioners.
This case study covers various aspects, including:
People: The contributors and community that have supported Albumentations.
Metrics: The success indicators such as downloads, daily active users, GitHub stars, and financial contributions.
Challenges: The hurdles in monetizing open-source projects and measuring user engagement.
Development Practices: Best practices for creating, maintaining, and scaling open-source libraries, including code hygiene, CI/CD, and fast iteration.
Community Building: Strategies for making adoption easy, iterating quickly, and fostering a vibrant, engaged community.
Marketing: Both online and offline marketing tactics, focusing on real, impactful interactions and collaborations.
Mental Health: Maintaining balance and not feeling pressured by user demands.
Key insights include the importance of automation, making the adoption process seamless, and leveraging offline interactions for marketing. The presentation also emphasizes the need for continuous small improvements and building a friendly, inclusive community that contributes to the project's growth.
Vladimir Iglovikov brings his extensive experience as a Kaggle Grandmaster, ex-Staff ML Engineer at Lyft, sharing valuable lessons and practical advice for anyone looking to enhance the adoption of their open-source projects.
Explore more about Albumentations and join the community at:
GitHub: https://github.com/albumentations-team/albumentations
Website: https://albumentations.ai/
LinkedIn: https://www.linkedin.com/company/100504475
Twitter: https://x.com/albumentationsWhy You Should Replace Windows 11 with Nitrux Linux 3.5.0 for enhanced perfor...
The choice of an operating system plays a pivotal role in shaping our computing experience. For decades, Microsoft's Windows has dominated the market, offering a familiar and widely adopted platform for personal and professional use. However, as technological advancements continue to push the boundaries of innovation, alternative operating systems have emerged, challenging the status quo and offering users a fresh perspective on computing.
One such alternative that has garnered significant attention and acclaim is Nitrux Linux 3.5.0, a sleek, powerful, and user-friendly Linux distribution that promises to redefine the way we interact with our devices. With its focus on performance, security, and customization, Nitrux Linux presents a compelling case for those seeking to break free from the constraints of proprietary software and embrace the freedom and flexibility of open-source computing.
Artificial Intelligence for XMLDevelopment
In the rapidly evolving landscape of technologies, XML continues to play a vital role in structuring, storing, and transporting data across diverse systems. The recent advancements in artificial intelligence (AI) present new methodologies for enhancing XML development workflows, introducing efficiency, automation, and intelligent capabilities. This presentation will outline the scope and perspective of utilizing AI in XML development. The potential benefits and the possible pitfalls will be highlighted, providing a balanced view of the subject.
We will explore the capabilities of AI in understanding XML markup languages and autonomously creating structured XML content. Additionally, we will examine the capacity of AI to enrich plain text with appropriate XML markup. Practical examples and methodological guidelines will be provided to elucidate how AI can be effectively prompted to interpret and generate accurate XML markup.
Further emphasis will be placed on the role of AI in developing XSLT, or schemas such as XSD and Schematron. We will address the techniques and strategies adopted to create prompts for generating code, explaining code, or refactoring the code, and the results achieved.
The discussion will extend to how AI can be used to transform XML content. In particular, the focus will be on the use of AI XPath extension functions in XSLT, Schematron, Schematron Quick Fixes, or for XML content refactoring.
The presentation aims to deliver a comprehensive overview of AI usage in XML development, providing attendees with the necessary knowledge to make informed decisions. Whether you’re at the early stages of adopting AI or considering integrating it in advanced XML development, this presentation will cover all levels of expertise.
By highlighting the potential advantages and challenges of integrating AI with XML development tools and languages, the presentation seeks to inspire thoughtful conversation around the future of XML development. We’ll not only delve into the technical aspects of AI-powered XML development but also discuss practical implications and possible future directions.
Microsoft - Power Platform_G.Aspiotis.pdf
Revolutionizing Application Development
with AI-powered low-code, presentation by George Aspiotis, Sr. Partner Development Manager, Microsoft
Climate Impact of Software Testing at Nordic Testing Days
My slides at Nordic Testing Days 6.6.2024
Climate impact / sustainability of software testing discussed on the talk. ICT and testing must carry their part of global responsibility to help with the climat warming. We can minimize the carbon footprint but we can also have a carbon handprint, a positive impact on the climate. Quality characteristics can be added with sustainability, and then measured continuously. Test environments can be used less, and in smaller scale and on demand. Test techniques can be used in optimizing or minimizing number of tests. Test automation can be used to speed up testing.
Unlock the Future of Search with MongoDB Atlas_ Vector Search Unleashed.pdf
Discover how MongoDB Atlas and vector search technology can revolutionize your application's search capabilities. This comprehensive presentation covers:
* What is Vector Search?
* Importance and benefits of vector search
* Practical use cases across various industries
* Step-by-step implementation guide
* Live demos with code snippets
* Enhancing LLM capabilities with vector search
* Best practices and optimization strategies
Perfect for developers, AI enthusiasts, and tech leaders. Learn how to leverage MongoDB Atlas to deliver highly relevant, context-aware search results, transforming your data retrieval process. Stay ahead in tech innovation and maximize the potential of your applications.
#MongoDB #VectorSearch #AI #SemanticSearch #TechInnovation #DataScience #LLM #MachineLearning #SearchTechnology
Securing your Kubernetes cluster_ a step-by-step guide to success !
Today, after several years of existence, an extremely active community and an ultra-dynamic ecosystem, Kubernetes has established itself as the de facto standard in container orchestration. Thanks to a wide range of managed services, it has never been so easy to set up a ready-to-use Kubernetes cluster.
However, this ease of use means that the subject of security in Kubernetes is often left for later, or even neglected. This exposes companies to significant risks.
In this talk, I'll show you step-by-step how to secure your Kubernetes cluster for greater peace of mind and reliability.
UiPath Test Automation using UiPath Test Suite series, part 5
Welcome to UiPath Test Automation using UiPath Test Suite series part 5. In this session, we will cover CI/CD with devops.
Topics covered:
CI/CD with in UiPath
End-to-end overview of CI/CD pipeline with Azure devops
Speaker:
Lyndsey Byblow, Test Suite Sales Engineer @ UiPath, Inc.
Mind map of terminologies used in context of Generative AI
Mind map of common terms used in context of Generative AI.
Introducing Milvus Lite: Easy-to-Install, Easy-to-Use vector database for you...
Join us to introduce Milvus Lite, a vector database that can run on notebooks and laptops, share the same API with Milvus, and integrate with every popular GenAI framework. This webinar is perfect for developers seeking easy-to-use, well-integrated vector databases for their GenAI apps.
UiPath Test Automation using UiPath Test Suite series, part 6
Welcome to UiPath Test Automation using UiPath Test Suite series part 6. In this session, we will cover Test Automation with generative AI and Open AI.
UiPath Test Automation with generative AI and Open AI webinar offers an in-depth exploration of leveraging cutting-edge technologies for test automation within the UiPath platform. Attendees will delve into the integration of generative AI, a test automation solution, with Open AI advanced natural language processing capabilities.
Throughout the session, participants will discover how this synergy empowers testers to automate repetitive tasks, enhance testing accuracy, and expedite the software testing life cycle. Topics covered include the seamless integration process, practical use cases, and the benefits of harnessing AI-driven automation for UiPath testing initiatives. By attending this webinar, testers, and automation professionals can gain valuable insights into harnessing the power of AI to optimize their test automation workflows within the UiPath ecosystem, ultimately driving efficiency and quality in software development processes.
What will you get from this session?
1. Insights into integrating generative AI.
2. Understanding how this integration enhances test automation within the UiPath platform
3. Practical demonstrations
4. Exploration of real-world use cases illustrating the benefits of AI-driven test automation for UiPath
Topics covered:
What is generative AI
Test Automation with generative AI and Open AI.
UiPath integration with generative AI
Speaker:
Deepak Rai, Automation Practice Lead, Boundaryless Group and UiPath MVP
Full-RAG: A modern architecture for hyper-personalization
Mike Del Balso, CEO & Co-Founder at Tecton, presents "Full RAG," a novel approach to AI recommendation systems, aiming to push beyond the limitations of traditional models through a deep integration of contextual insights and real-time data, leveraging the Retrieval-Augmented Generation architecture. This talk will outline Full RAG's potential to significantly enhance personalization, address engineering challenges such as data management and model training, and introduce data enrichment with reranking as a key solution. Attendees will gain crucial insights into the importance of hyperpersonalization in AI, the capabilities of Full RAG for advanced personalization, and strategies for managing complex data integrations for deploying cutting-edge AI solutions.
Recently uploaded (20)
“Building and Scaling AI Applications with the Nx AI Manager,” a Presentation...
“Building and Scaling AI Applications with the Nx AI Manager,” a Presentation...
みなさんこんにちはこれ何文字まで入るの?40文字以下不可とか本当に意味わからないけどこれ限界文字数書いてないからマジでやばい文字数いけるんじゃないの?えこ...
みなさんこんにちはこれ何文字まで入るの?40文字以下不可とか本当に意味わからないけどこれ限界文字数書いてないからマジでやばい文字数いけるんじゃないの?えこ...
GraphSummit Singapore | The Future of Agility: Supercharging Digital Transfor...
GraphSummit Singapore | The Future of Agility: Supercharging Digital Transfor...
Presentation of the OECD Artificial Intelligence Review of Germany
Presentation of the OECD Artificial Intelligence Review of Germany
Goodbye Windows 11: Make Way for Nitrux Linux 3.5.0!
Goodbye Windows 11: Make Way for Nitrux Linux 3.5.0!
Enchancing adoption of Open Source Libraries. A case study on Albumentations.AI
Enchancing adoption of Open Source Libraries. A case study on Albumentations.AI
Why You Should Replace Windows 11 with Nitrux Linux 3.5.0 for enhanced perfor...
Why You Should Replace Windows 11 with Nitrux Linux 3.5.0 for enhanced perfor...
Climate Impact of Software Testing at Nordic Testing Days
Climate Impact of Software Testing at Nordic Testing Days
Unlock the Future of Search with MongoDB Atlas_ Vector Search Unleashed.pdf
Unlock the Future of Search with MongoDB Atlas_ Vector Search Unleashed.pdf
Securing your Kubernetes cluster_ a step-by-step guide to success !
Securing your Kubernetes cluster_ a step-by-step guide to success !
UiPath Test Automation using UiPath Test Suite series, part 5
UiPath Test Automation using UiPath Test Suite series, part 5
Mind map of terminologies used in context of Generative AI
Mind map of terminologies used in context of Generative AI
Introducing Milvus Lite: Easy-to-Install, Easy-to-Use vector database for you...
Introducing Milvus Lite: Easy-to-Install, Easy-to-Use vector database for you...
Monitoring Java Application Security with JDK Tools and JFR Events
Monitoring Java Application Security with JDK Tools and JFR Events
UiPath Test Automation using UiPath Test Suite series, part 6
UiPath Test Automation using UiPath Test Suite series, part 6
Full-RAG: A modern architecture for hyper-personalization
Full-RAG: A modern architecture for hyper-personalization
4.1 coordinate plane 2
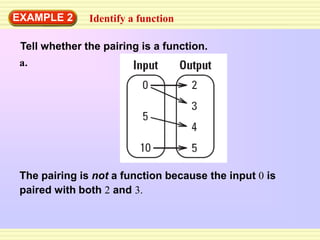
- 1. EXAMPLE 2 Identify a function Tell whether the pairing is a function. a. The pairing is not a function because the input 0 is paired with both 2 and 3.
- 2. EXAMPLE 2 Identify a function b. Input Output 0 0 1 2 4 8 6 12 The pairing is a function because each input is paired with exactly one output.
- 3. EXAMPLE 3 Make a table for a function The domain of the function y = 2x is 0, 2, 5, 7, and 8. Make a table for the function, then identify the range of the function. SOLUTION x 0 2 5 7 8 y = 2x 2 0 = 0 2 2 = 4 2 5 = 10 2 7 = 14 2 8 = 16 The range of the function is 0, 4, 10, 14, and 16.
- 4. • y =2x – 3 Input Output 4 2 0 -2
- 5. • y = 2x – 3 Input Output 4 5 2 1 0 -3 -2 -7
- 6. • Graph the function y = -1/2x + 1 when the domain is -4, -2, 0, 2, 4
- 7. y = -1/2x + 1 x y -4 -2 0 2 4
- 8. EXAMPLE 4 Graph a function represented by a table VOTING In 1920 the ratification of the 19th amendment to the United States Constitution gave women the right to vote. The table shows the number (to the nearest million) of votes cast in presidential elections both before and since women were able to vote.
- 9. EXAMPLE 4 Graph a function represented by a table Years before or –12 –8 –4 0 4 8 12 since 1920 Votes (millions) 15 15 19 27 29 37 40 a. Explain how you know that the table represents a function. b. Graph the function represented by the table. c. Describe any trend in the number of votes cast.
- 10. EXAMPLE 4 Graph a function represented by a table SOLUTION a. The table represents a function because each input has exactly one output. b. To graph the function, let x be the number of years before or since 1920. Let y be the number of votes cast (in millions). The graph of the function is shown.
- 11. GUIDED PRACTICE for Example 4 VOTING 8. The presidential election in 1972 was the first election in which 18-year-olds were allowed to vote. The table shows the number (to the nearest million) of votes cast in presidential elections both before and since 1972. Years before or –12 –8 –4 0 4 8 12 since 1972 Votes (millions) 69 71 73 78 82 87 93
- 12. GUIDED PRACTICE for Example 4 a. Explain how you know the graph represents a function. ANSWER The table represents a function because each input has exactly one output.
- 13. GUIDED PRACTICE for Example 4 b. Graph the function represented by the table. ANSWER
- 14. GUIDED PRACTICE for Example 4 c. Describe any trend in the number of votes cast. ANSWER Sample answer: Before 1972, the number of votes cast increased by 2 million every 4 years. In 1972, the number increased by 5 million and continued to increase by more than 2 million every four years since 1972.
- 15. • Graphing functions Assignment: P. 210 (#24-26, 28, 36, 37) • You will need graph paper