Triunfo Participações e Investimentos S.A. reported its 3Q13 and 9M13 earnings presentation. Key highlights included:
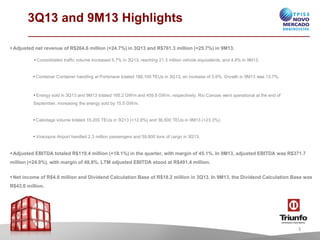
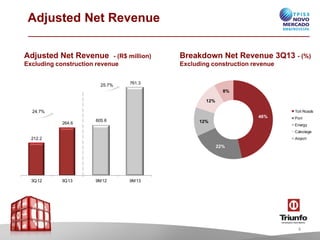
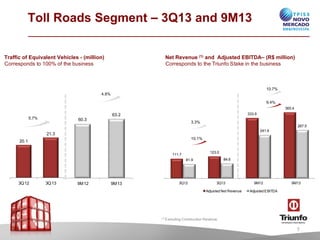
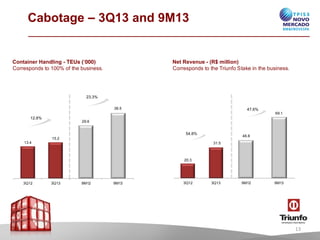
- Adjusted net revenue increased 24.7% in 3Q13 and 25.7% in 9M13. Consolidated traffic volume grew 5.7% in 3Q13 and 4.8% in 9M13.
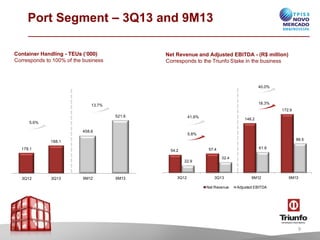
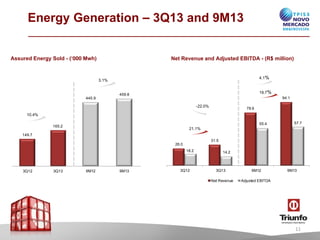
- Container handling at Portonave increased 5.6% in 3Q13 and 13.7% in 9M13. Energy sold grew 4.1% in 3Q13 and 3.1% in 9M13.
- Adjusted EBITDA increased 18.1% to R$119.4 million in