Download to read offline
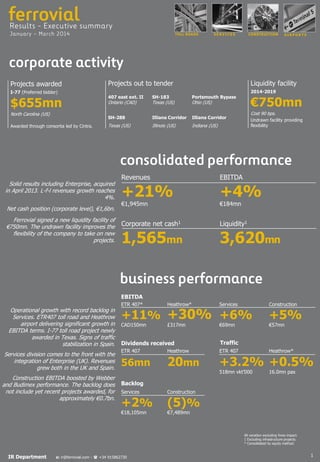

Ferrovial reported solid results for 2013, with revenues growing 4% and EBITDA increasing 21%. The services division saw significant growth due to the integration of Enterprise in the UK. Construction EBITDA was boosted by the performance of Budimex and Webber. Toll roads ETR407 and Heathrow airport delivered substantial EBITDA growth. The backlog reached a record high for services but does not yet include recent project awards worth €0.7 billion. Net cash at the corporate level was €1.565 billion at the end of March 2014.


