Download to read offline


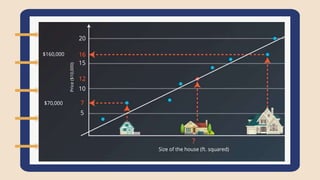


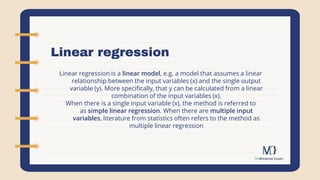


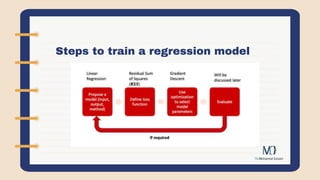


The document discusses linear regression, an algorithm used in machine learning and statistics. Linear regression is a simple and well-understood algorithm that finds a linear relationship between input variables (x) and an output variable (y). It assumes the dependence of y on x1, x2, etc. is linear. The document provides examples of using linear regression to predict house prices based on characteristics or advertising sales based on budgets. It also discusses calculating the mean squared error to evaluate a regression model's performance and the gradient descent algorithm used to minimize error and learn the model's weights.