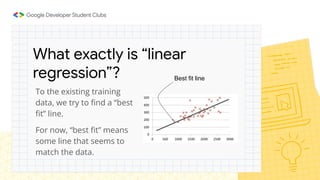
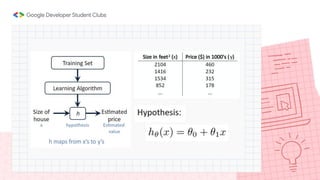
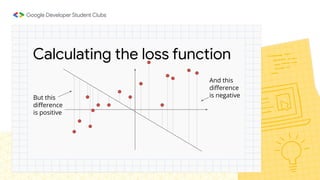
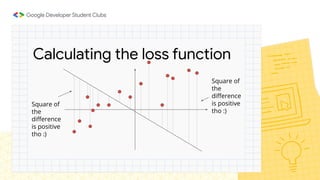
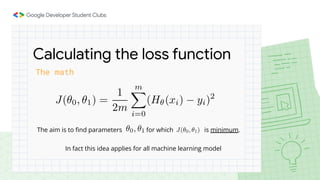
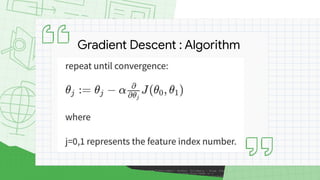
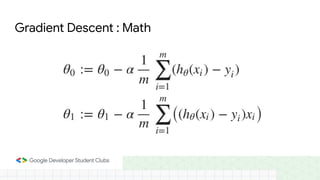
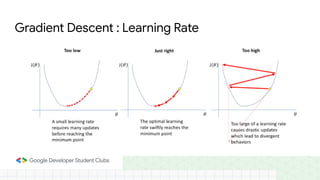
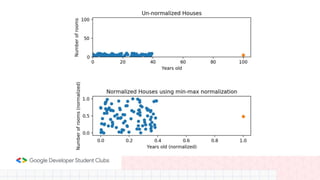
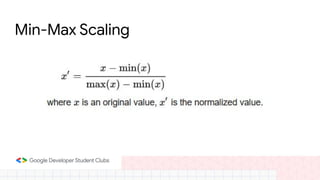
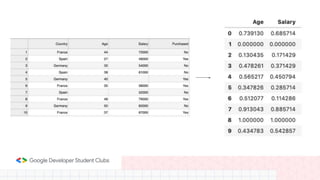
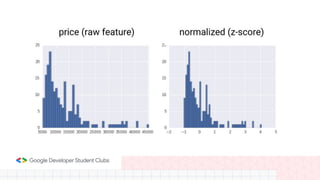
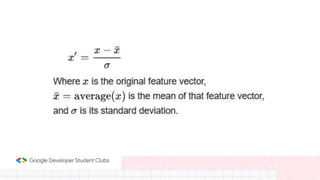
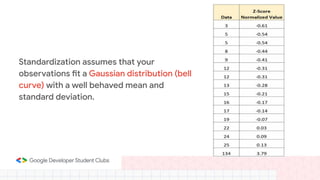
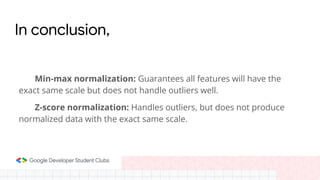
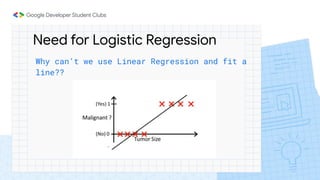
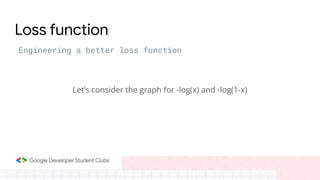
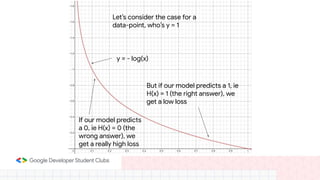
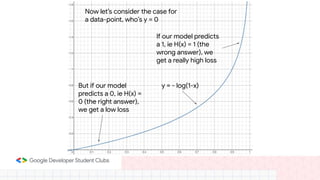
Welcome to
Explore ML!
Day 2
Linear Regression
Fitting Linear Models
Premise
What are we trying to achieve?
We are trying to solve or
predict something, based on
what we already know.
This is a regression problem,
that is, we want predict a real
valued output.
?
What exactly is “linear
regression”?
To the existing training
data, we try to find a “best
fit” line.
For now, “best fit” means
some line that seems to
match the data.
Best fit line
This is an example of
___________
This is an example of
Supervised Learning
Recall your high school
math classes.
y = mx + c
Model parameters :
Model Representation
Tweaking the value of the parameters
Loss function
Formalizing the notion of best fit line
How exactly do you say one line fits better than the
other?
Let’s look at what exactly is loss and the loss function.
Loss function
H(xi
) - yi
Loss function
Oops,
Looks like
the errors
became
bigger
Calculating the loss function
Add all the
differences
between
predicted
values and
our data
points
Calculating the loss function
But this
difference
is positive
And this
difference
is negative
Calculating the loss function
Square of
the
difference
is positive
tho :)
Square of
the
difference
is positive
tho :)
The math
Calculating the loss function
In fact this idea applies for all machine learning model
The aim is to find parameters for which is minimum.
This function is the reason why models can learn things. It makes the
model descend the gradient of errors to reach a place of perfection. It
involves some mathematical calculation to minimize the error between
the actual value and the predicted value.
Optimization Algorithm
Gradient Descent
Gradient Descent : Intuition
Gradient Descent : Algorithm
Gradient Descent : Math
Gradient Descent : Learning Rate
Feature Scaling
Most of the real-life datasets that you will be dealing with will have
many features ranging from a wide range of values.
If you were asked to predict the price of a house, you will be provided
with a dataset with multiple features like no.of. bedrooms, square feet
area of the house, etc.
There’s a problem though.
For example,
The range of data in each feature will vary wildly.
For example, the number of bedrooms can vary from, say, 1 to 5 and
square feet area can range from 500 to 3000.
How is this a problem?
How do you solve this?
Feature Scaling
Feature Scaling is a data preprocessing step used to normalize the
features in the dataset to make sure that all the features lie in a similar
range.
It is one of the most critical steps during the pre-processing of data
before creating a machine learning model.
If a feature’s variance is orders of magnitude more than the variance of
other features, that particular feature might dominate other features in
the dataset, which is not something we want happening in our model.
Why?
Two important scaling techniques:
1. Normalisation
2. Standardisation
Normalisation
Normalization is the concept of scaling the range of values in a feature
between 0 to 1.
This is referred as Min-Max Scaling.
Min-Max Scaling
Standardisation
Standardisation is a scaling technique where the values are centered
around the mean with a unit standard deviation.
Standardisation is required when features of input data set have large
differences between their ranges, or simply when they are measured in
different measurement units, i.e. kwh, Meters, Miles and more.
Z-score is one of the most popular methods to standardise data, and
can be done by subtracting the mean and dividing by the standard
deviation for each value of each feature.
Standardization assumes that your
observations fit a Gaussian distribution (bell
curve) with a well behaved mean and
standard deviation.
In conclusion,
Min-max normalization: Guarantees all features will have the
exact same scale but does not handle outliers well.
Z-score normalization: Handles outliers, but does not produce
normalized data with the exact same scale.
Time to apply what you’ve learnt!
___________
Before we get started
Go to kaggle.com and register for a
new account.
Before we get started
Now go to
bit.ly/gdsc-linear-reg-kaggle and
click on ‘Copy and Edit’ button
(top-right corner of the page).
Time to code!
Time to eat!
Logistic Regression
Learning to say “Yes” or “No”
Need for Logistic Regression
Why can’t we use Linear Regression and fit a
line??
Inaccurate Predictions
Out of Range Problem
For classification y=0 or y=1
In Linear Regression h(x) can be >1 or <0
But for Logistic Regression 0<= h(X) <= 1, must hold true
Hypothesis Representation
hθ
(x) = θT
X for linear regression.
But here we want 0<=hθ
(x)<=1
Sigmoid Function
hθ
(x) = g(θT
X), where g is the sigmoid function
Interpretation of hypothesis
hθ
(x) = Probability that y=1 given input x
For eg:
In cancer detection problem,
y = 1 signifies that a person has tested +ve for cancer
y = 0 signifies that a person has tested -ve for cancer
What does hθ
(x) = 0.7 mean for an example input x??
Decision Boundary
Predict y = 1 if hθ
(x)>=0.5 & y = 0 if hθ
(x)<0.5
Hence for y = 1:
⇒ hθ
(x)>=0.5
⇒ θT
X > 0
How does the model know when to
predict y =1 or y=0 ?
Say we find that θ1
= -3, θ2
= 1, θ3
= 1
Hence, on substitution :
Predict y=1 if -3+x1
+x2
> 0 , else predict y=0
hθ
(x) = 0 is called the decision boundary
i.e -3+x1
+x2
= 0 is the decision boundary
Loss Function
Recall from linear regression where we used this formula for
calculating the loss of our model
It turns out, although this same method gives a metric for loss of the
model, it has a lot of local minima
Loss function
Let’s consider the graph for -log(x) and -log(1-x)
Engineering a better loss function
-log(x)
-log(1 -x)
Let’s consider the case for a
data-point, who’s y = 1
If our model predicts
a 0, ie H(x) = 0 (the
wrong answer), we
get a really high loss
But if our model predicts a 1, ie
H(x) = 1 (the right answer), we
get a low loss
y = - log(x)
Now let’s consider the case for
a data-point, who’s y = 0
If our model predicts
a 1, ie H(x) = 1 (the
wrong answer), we
get a really high loss
But if our model
predicts a 0, ie H(x) =
0 (the right answer),
we get a low loss
y = - log(1-x)
Loss Function
Cool math trick!
Time to code again!
___________
Head over to bit.ly/gdsc-logistic-reg-kaggle and
click on ‘Copy and Edit’
Don’t forget to sign in!
K-Means Clustering
Finding Clusters in Data
K-means Clustering : Theory
K-Means Clustering is an Unsupervised Machine
Learning algorithm. Here, the algorithm can identify
the similarities and differences in the data and divide
the data into several groups called clusters. K is the
number of clusters. We can determine that K value
according to the dataset.
K means Clustering : Algorithm
Step 1 : Choose the number of clusters (K value) according to the dataset.
K = 2 here.
K means Clustering : Algorithm
Step 2 : Select the centroid points at random K points
Step 3 : Assign each data point to the closest centroid. That forms K clusters.
K mean Clustering : Algorithm
K means Clustering : Algorithm
Euclidean Distance : If (x1
, y1
) and (x2
, y2
) are two points, then the
distance between them is given by
Step 4 : Compute and place the new centroid of each cluster
K means Clustering : Algorithm
Step 5 : Reassign each data point to the new closest centroid. This step
repeats till no reassignment takes place
K means Clustering : Algorithm
Step 6 : Model is ready
K means Clustering :
Choosing the correct number of clusters
K means Clustering :
Elbow Method
Quick Recap!
Machine Learning
Roadmap!
We want to know how we did!
Please fill out the feedback form given below:
https://bit.ly/gdsc-ml-feedback
Registered participants who’ve filled the form will
be eligible for certificates.
We want to know how we did!
We request all of you to check your inbox from
email from GDSC Event Platform. You will get it
soon.
Registered participants who’ve filled the form will
be eligible for certificates.
RESOURCES!
bit.ly/gdsc-explore-ml
Thank You!

Explore ml day 2

  • 1.
  • 2.
  • 3.
    Premise What are wetrying to achieve? We are trying to solve or predict something, based on what we already know. This is a regression problem, that is, we want predict a real valued output. ?
  • 4.
    What exactly is“linear regression”? To the existing training data, we try to find a “best fit” line. For now, “best fit” means some line that seems to match the data. Best fit line
  • 6.
    This is anexample of ___________
  • 7.
    This is anexample of Supervised Learning
  • 8.
    Recall your highschool math classes. y = mx + c Model parameters : Model Representation
  • 11.
    Tweaking the valueof the parameters
  • 13.
    Loss function Formalizing thenotion of best fit line How exactly do you say one line fits better than the other? Let’s look at what exactly is loss and the loss function.
  • 14.
  • 15.
  • 16.
    Calculating the lossfunction Add all the differences between predicted values and our data points
  • 17.
    Calculating the lossfunction But this difference is positive And this difference is negative
  • 18.
    Calculating the lossfunction Square of the difference is positive tho :) Square of the difference is positive tho :)
  • 19.
    The math Calculating theloss function In fact this idea applies for all machine learning model The aim is to find parameters for which is minimum.
  • 20.
    This function isthe reason why models can learn things. It makes the model descend the gradient of errors to reach a place of perfection. It involves some mathematical calculation to minimize the error between the actual value and the predicted value. Optimization Algorithm Gradient Descent
  • 21.
  • 22.
  • 23.
  • 24.
  • 25.
    Gradient Descent :Learning Rate
  • 26.
  • 27.
    Most of thereal-life datasets that you will be dealing with will have many features ranging from a wide range of values.
  • 28.
    If you wereasked to predict the price of a house, you will be provided with a dataset with multiple features like no.of. bedrooms, square feet area of the house, etc. There’s a problem though. For example,
  • 29.
    The range ofdata in each feature will vary wildly. For example, the number of bedrooms can vary from, say, 1 to 5 and square feet area can range from 500 to 3000. How is this a problem?
  • 32.
    How do yousolve this?
  • 33.
  • 34.
    Feature Scaling isa data preprocessing step used to normalize the features in the dataset to make sure that all the features lie in a similar range. It is one of the most critical steps during the pre-processing of data before creating a machine learning model.
  • 35.
    If a feature’svariance is orders of magnitude more than the variance of other features, that particular feature might dominate other features in the dataset, which is not something we want happening in our model. Why?
  • 36.
    Two important scalingtechniques: 1. Normalisation 2. Standardisation
  • 37.
  • 39.
    Normalization is theconcept of scaling the range of values in a feature between 0 to 1. This is referred as Min-Max Scaling.
  • 40.
  • 42.
  • 44.
    Standardisation is ascaling technique where the values are centered around the mean with a unit standard deviation. Standardisation is required when features of input data set have large differences between their ranges, or simply when they are measured in different measurement units, i.e. kwh, Meters, Miles and more.
  • 45.
    Z-score is oneof the most popular methods to standardise data, and can be done by subtracting the mean and dividing by the standard deviation for each value of each feature.
  • 47.
    Standardization assumes thatyour observations fit a Gaussian distribution (bell curve) with a well behaved mean and standard deviation.
  • 48.
    In conclusion, Min-max normalization:Guarantees all features will have the exact same scale but does not handle outliers well. Z-score normalization: Handles outliers, but does not produce normalized data with the exact same scale.
  • 49.
    Time to applywhat you’ve learnt! ___________
  • 50.
    Before we getstarted Go to kaggle.com and register for a new account.
  • 51.
    Before we getstarted Now go to bit.ly/gdsc-linear-reg-kaggle and click on ‘Copy and Edit’ button (top-right corner of the page).
  • 52.
  • 53.
  • 54.
    Logistic Regression Learning tosay “Yes” or “No”
  • 55.
    Need for LogisticRegression Why can’t we use Linear Regression and fit a line??
  • 56.
  • 57.
    Out of RangeProblem For classification y=0 or y=1 In Linear Regression h(x) can be >1 or <0 But for Logistic Regression 0<= h(X) <= 1, must hold true
  • 58.
    Hypothesis Representation hθ (x) =θT X for linear regression. But here we want 0<=hθ (x)<=1
  • 59.
    Sigmoid Function hθ (x) =g(θT X), where g is the sigmoid function
  • 60.
    Interpretation of hypothesis hθ (x)= Probability that y=1 given input x For eg: In cancer detection problem, y = 1 signifies that a person has tested +ve for cancer y = 0 signifies that a person has tested -ve for cancer What does hθ (x) = 0.7 mean for an example input x??
  • 61.
    Decision Boundary Predict y= 1 if hθ (x)>=0.5 & y = 0 if hθ (x)<0.5 Hence for y = 1: ⇒ hθ (x)>=0.5 ⇒ θT X > 0
  • 62.
    How does themodel know when to predict y =1 or y=0 ?
  • 64.
    Say we findthat θ1 = -3, θ2 = 1, θ3 = 1 Hence, on substitution : Predict y=1 if -3+x1 +x2 > 0 , else predict y=0 hθ (x) = 0 is called the decision boundary i.e -3+x1 +x2 = 0 is the decision boundary
  • 65.
    Loss Function Recall fromlinear regression where we used this formula for calculating the loss of our model It turns out, although this same method gives a metric for loss of the model, it has a lot of local minima
  • 66.
    Loss function Let’s considerthe graph for -log(x) and -log(1-x) Engineering a better loss function
  • 67.
  • 68.
    Let’s consider thecase for a data-point, who’s y = 1 If our model predicts a 0, ie H(x) = 0 (the wrong answer), we get a really high loss But if our model predicts a 1, ie H(x) = 1 (the right answer), we get a low loss y = - log(x)
  • 69.
    Now let’s considerthe case for a data-point, who’s y = 0 If our model predicts a 1, ie H(x) = 1 (the wrong answer), we get a really high loss But if our model predicts a 0, ie H(x) = 0 (the right answer), we get a low loss y = - log(1-x)
  • 70.
  • 71.
    Time to codeagain! ___________
  • 72.
    Head over tobit.ly/gdsc-logistic-reg-kaggle and click on ‘Copy and Edit’ Don’t forget to sign in!
  • 73.
  • 74.
    K-means Clustering :Theory K-Means Clustering is an Unsupervised Machine Learning algorithm. Here, the algorithm can identify the similarities and differences in the data and divide the data into several groups called clusters. K is the number of clusters. We can determine that K value according to the dataset.
  • 75.
    K means Clustering: Algorithm Step 1 : Choose the number of clusters (K value) according to the dataset. K = 2 here.
  • 76.
    K means Clustering: Algorithm Step 2 : Select the centroid points at random K points
  • 77.
    Step 3 :Assign each data point to the closest centroid. That forms K clusters. K mean Clustering : Algorithm
  • 78.
    K means Clustering: Algorithm Euclidean Distance : If (x1 , y1 ) and (x2 , y2 ) are two points, then the distance between them is given by
  • 79.
    Step 4 :Compute and place the new centroid of each cluster K means Clustering : Algorithm
  • 80.
    Step 5 :Reassign each data point to the new closest centroid. This step repeats till no reassignment takes place K means Clustering : Algorithm
  • 81.
    K means Clustering: Algorithm Step 6 : Model is ready
  • 82.
    K means Clustering: Choosing the correct number of clusters
  • 83.
    K means Clustering: Elbow Method
  • 84.
  • 85.
  • 86.
    We want toknow how we did! Please fill out the feedback form given below: https://bit.ly/gdsc-ml-feedback Registered participants who’ve filled the form will be eligible for certificates.
  • 87.
    We want toknow how we did! We request all of you to check your inbox from email from GDSC Event Platform. You will get it soon. Registered participants who’ve filled the form will be eligible for certificates.
  • 89.
  • 90.