Downloaded 10 times
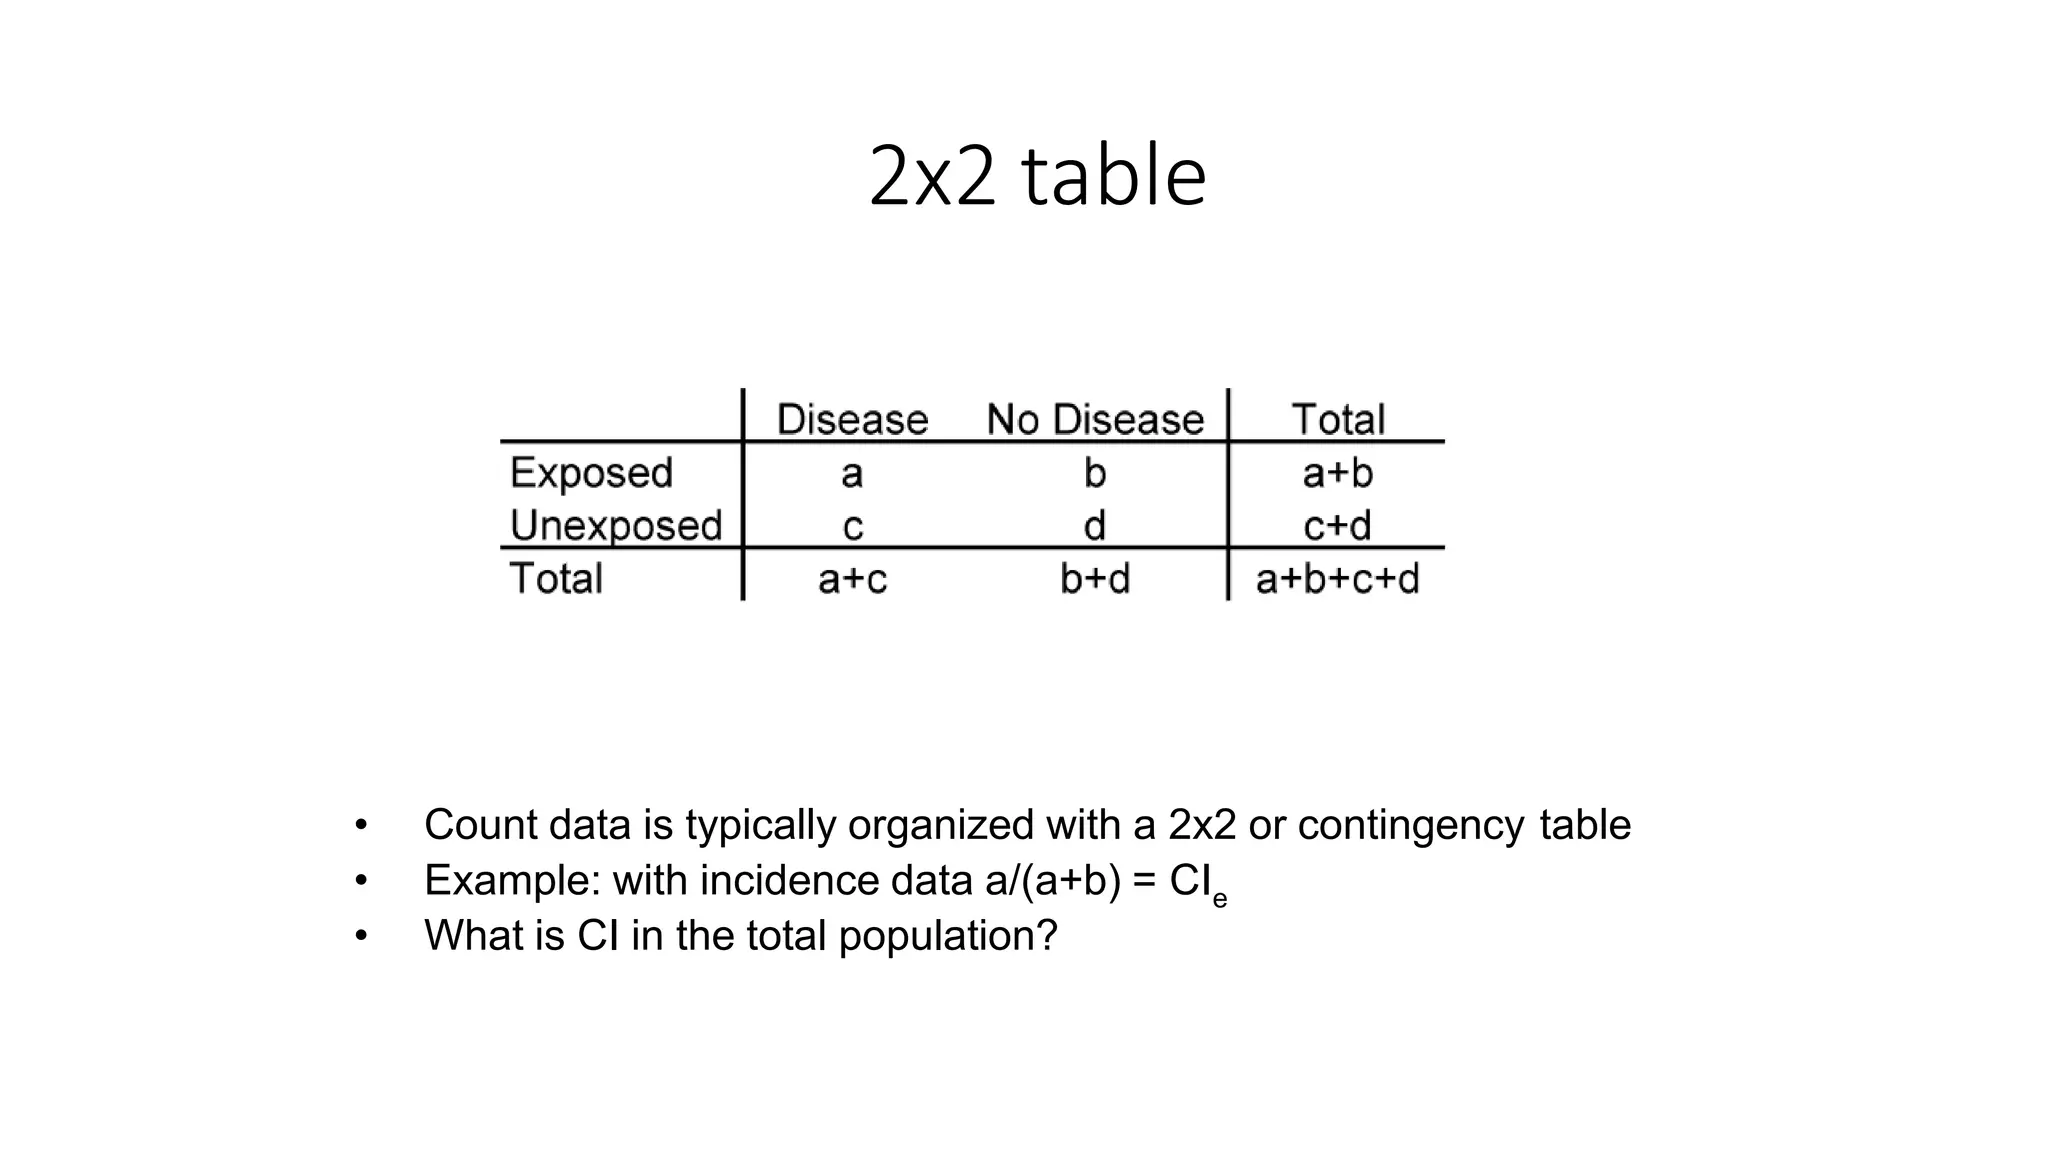
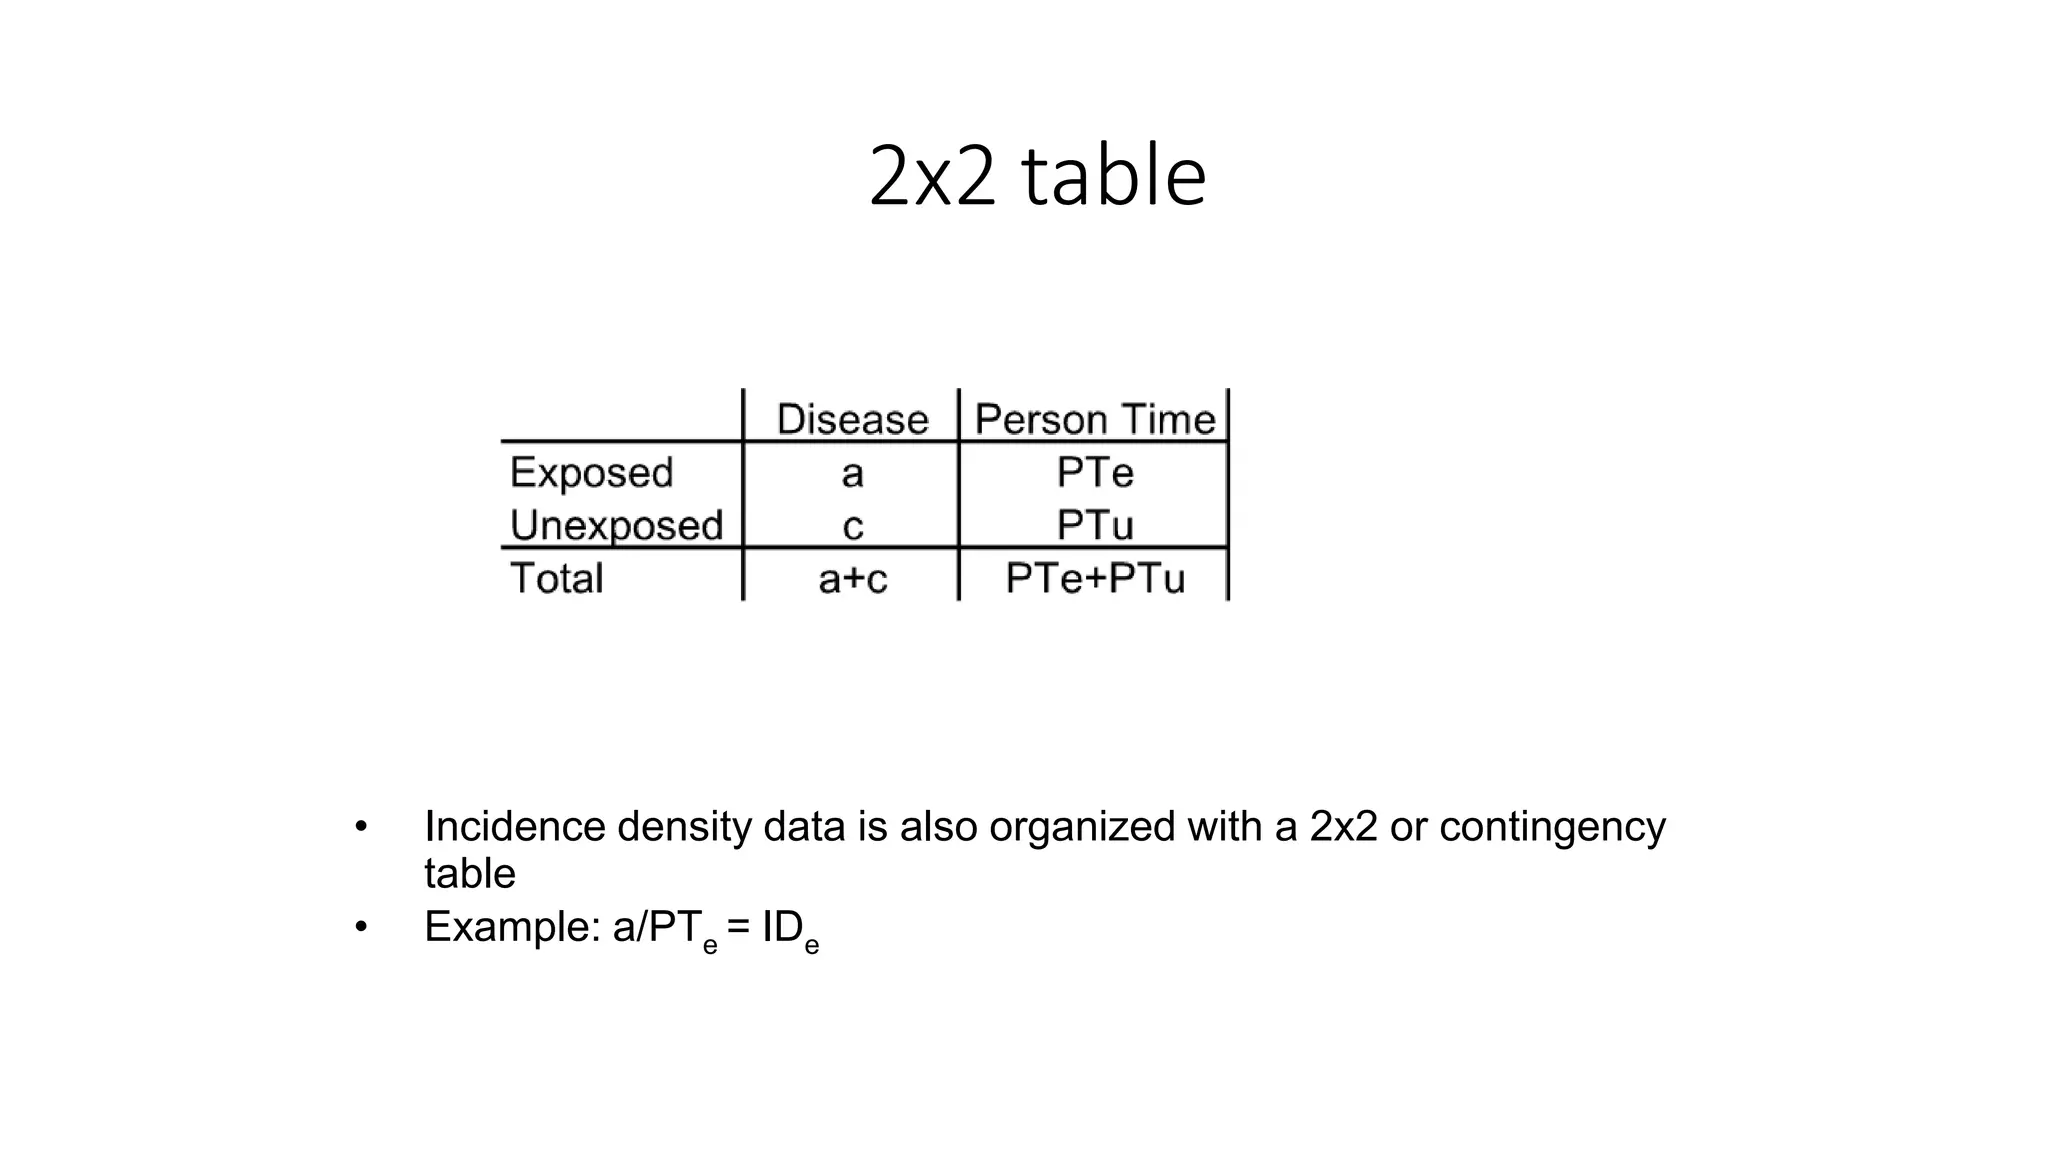
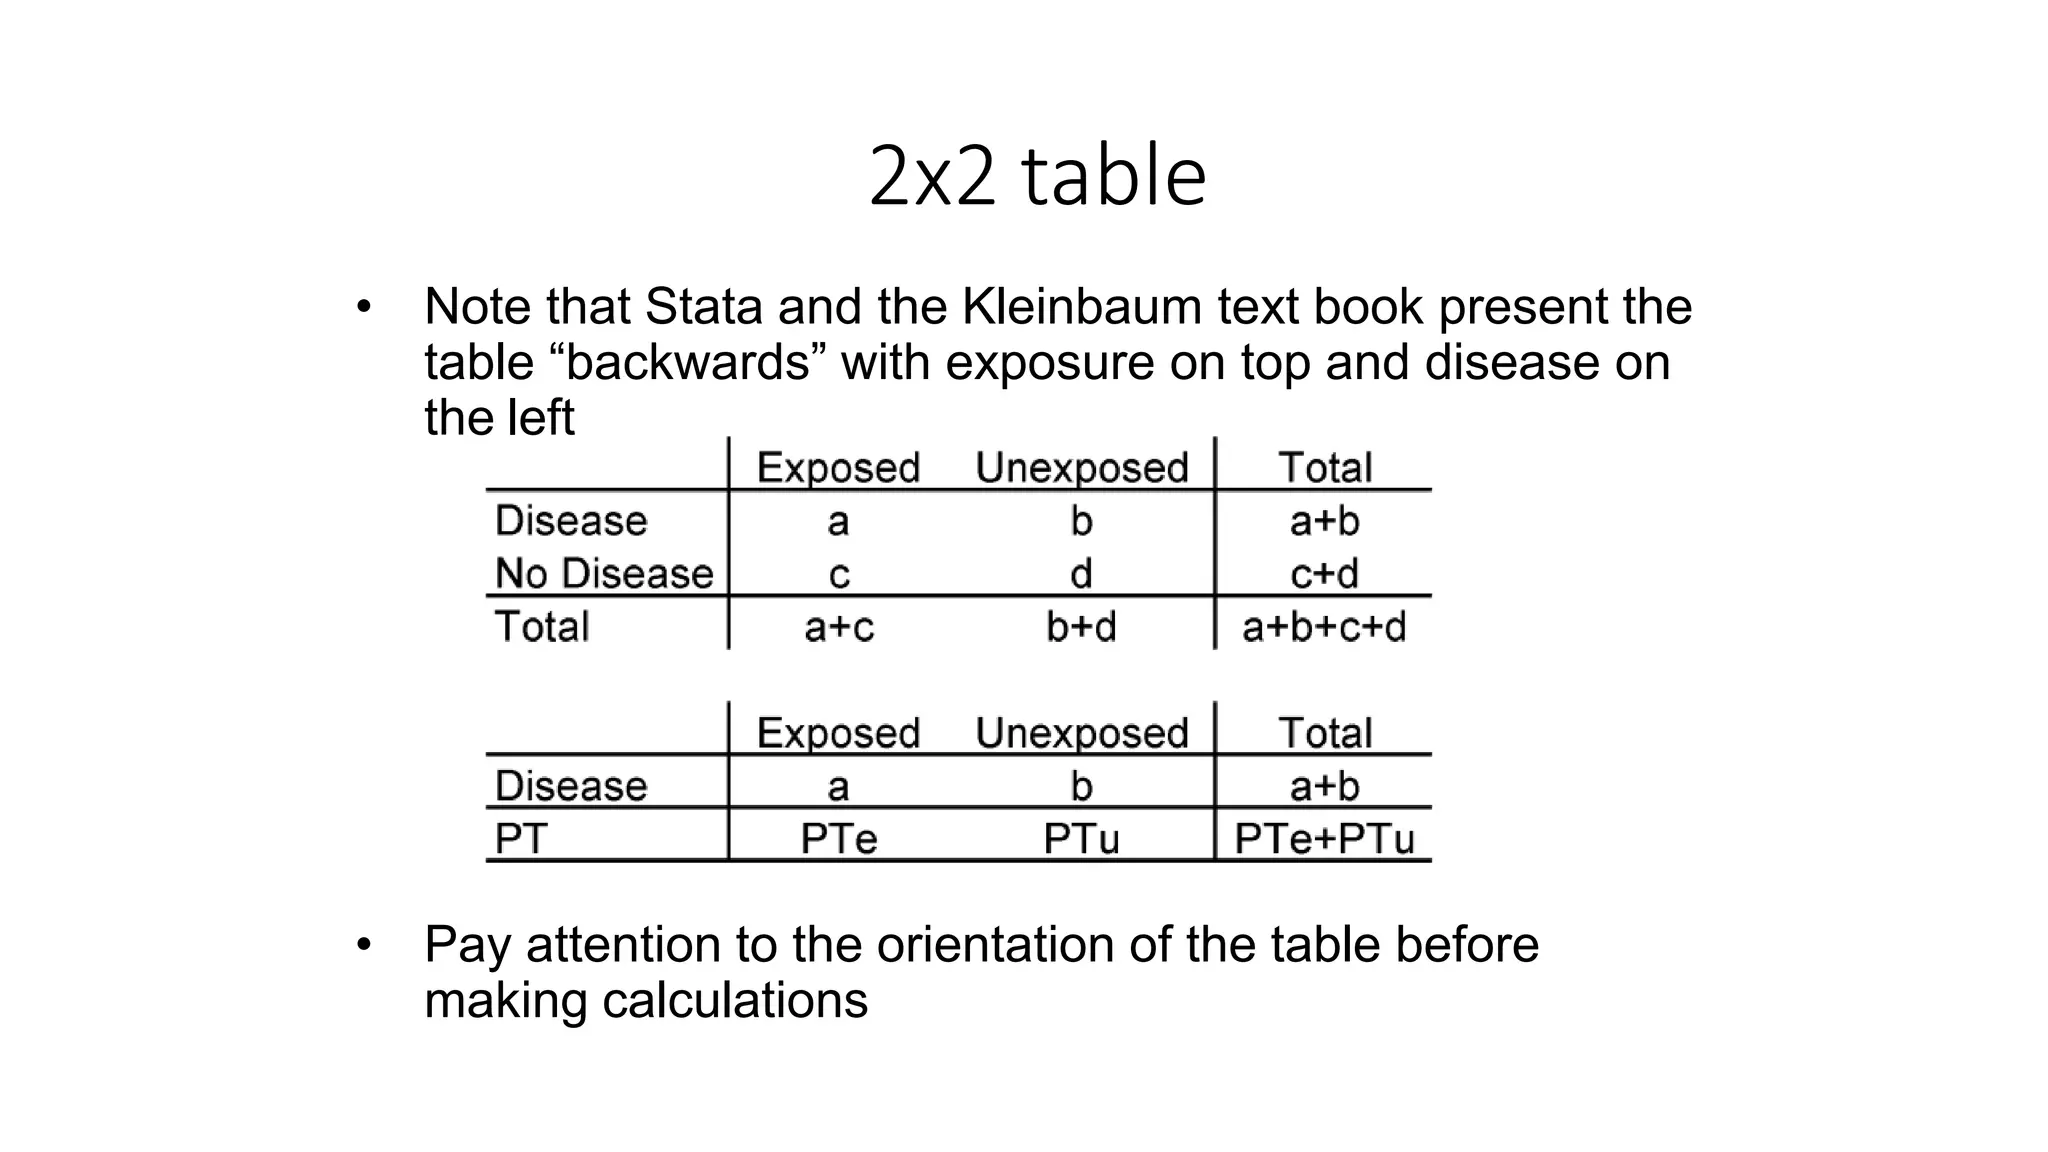
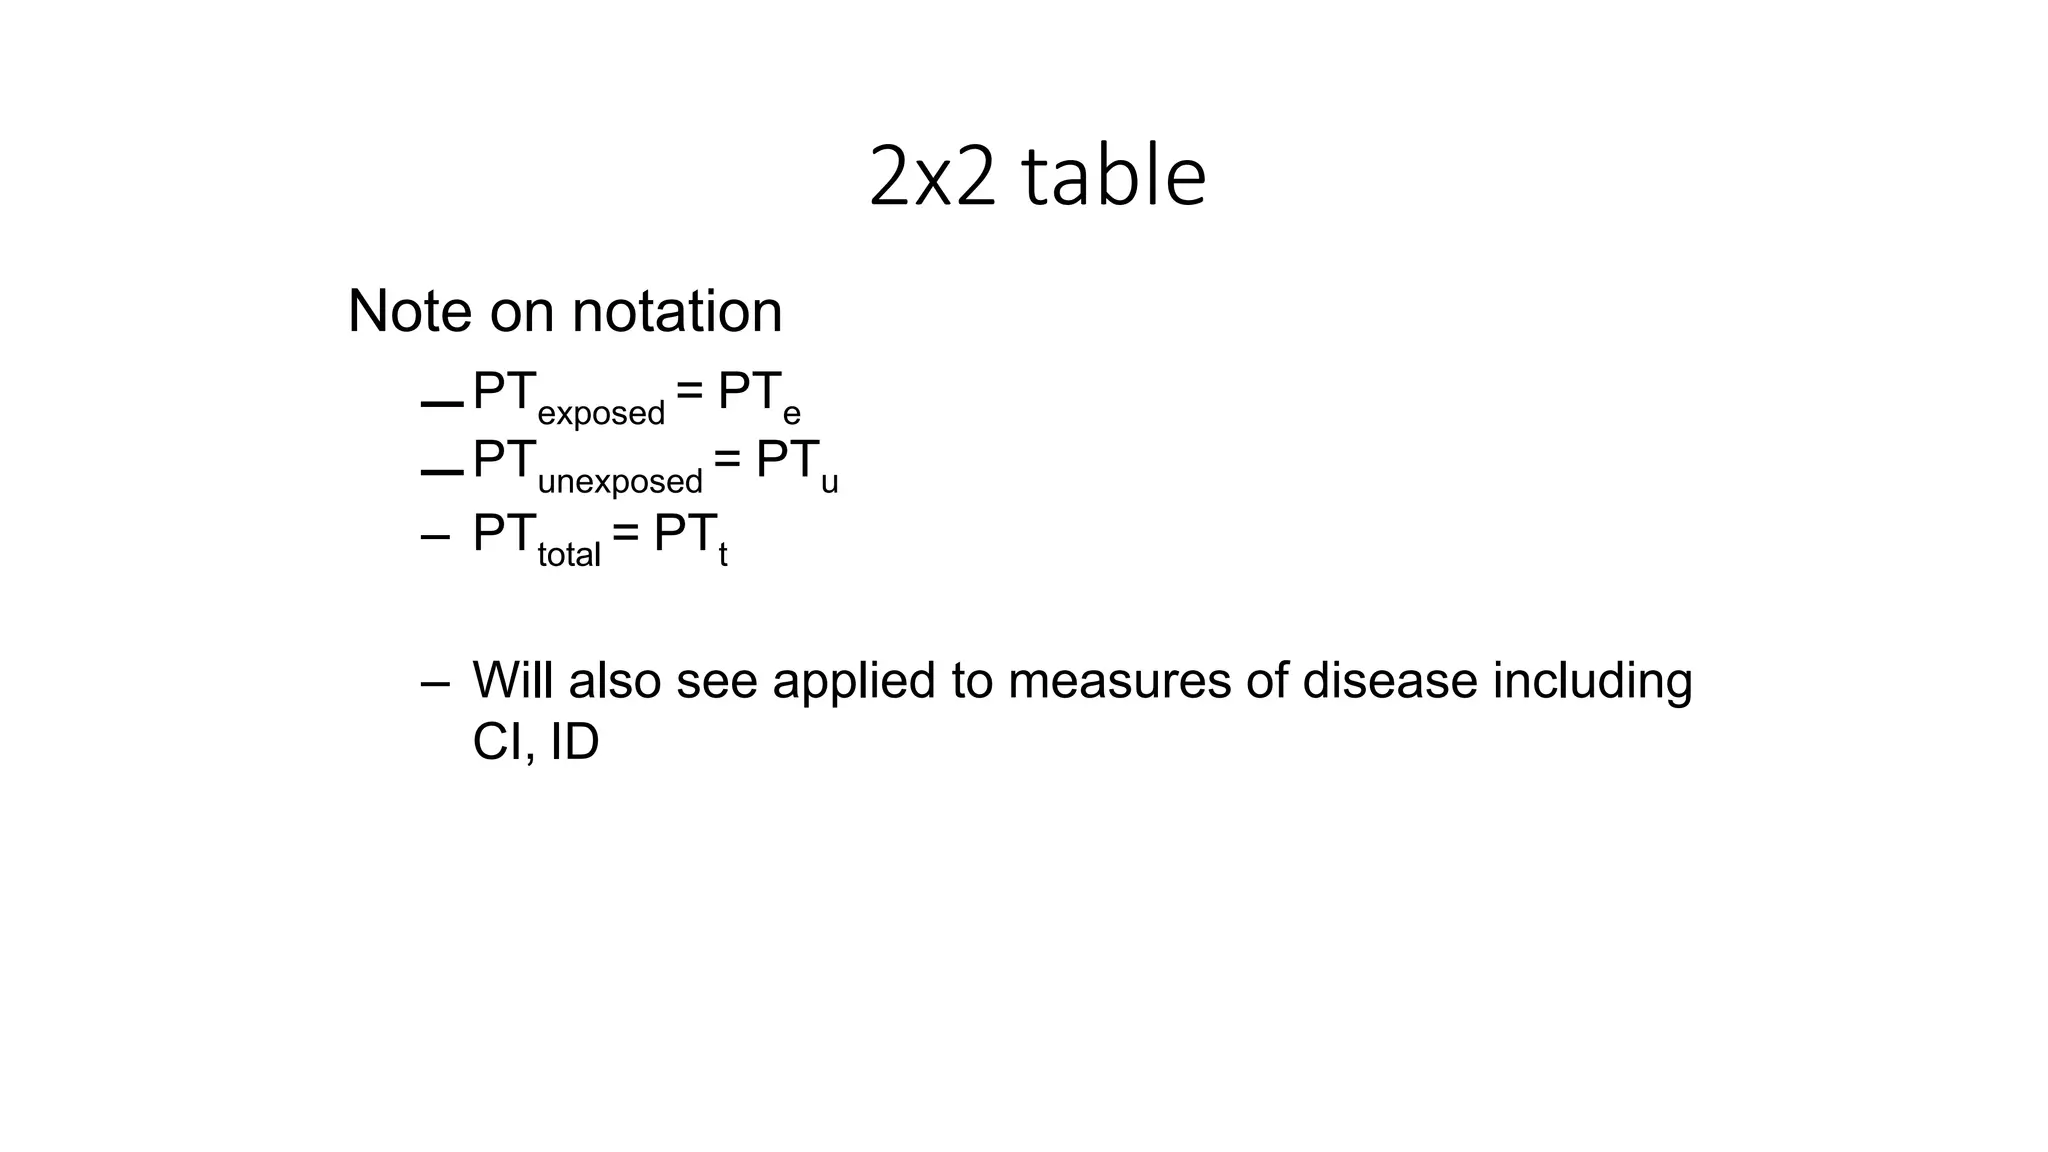
This document discusses organizing count data using a 2x2 contingency table, with examples of how incidence data and incidence density data can be represented in these tables. It notes that some references present the 2x2 table with exposure on top and disease on the left, so it is important to pay attention to the orientation before making calculations. The document also provides notation for elements of a 2x2 table, including exposed and unexposed population totals and total population.


