Download to read offline
![International Journal of Civil Engineering and Technology (IJCIET), ISSN 0976 – 6308
(Print), ISSN 0976 – 6316(Online) Volume 4, Issue 6, November – December (2013), © IAEME
Conventional hydrological model, to estimate runoff model input parameters have to be determined
through ground truth measurements which still need huge economic and time labor consuming.
Therefore remote sensing can also provide information about runoff input data most cost-effective
cost
and large-land coverage.
Direct measurement of runoff is the accurate way of measurement but in most it is not
possible at desired time and location, thus use of hydrological model for estimating run depth has
runoff
become increasingly popular.
Al-adeem River basin lies in the Iraqi land. It originates at mountainous parts in north eastern
adeem
of Iraq, from the southern foots of (Karadagh), (Skermahdagh), (Tasslugga) and (Shwan) mountains
in Sulaymania governorate. The height of these mountains varies from 1400 to 1800m above sea
rnorate.
level. Studied area is about 13000km²; Al-adeem River is considered one of the main Tigris
Al adeem
tributaries. It occupies most of Kirkuk governorate area and discharges in Tigris River south of
so
Ballad city .The basin extends between the two basins of Lesser Zab River at the north and Diyala
River at the south in the region located between the latitudes 340 and 350 34’nourh and the
longitudes 43030’ and 450 30’ east . The important valleys that the river originates from (Khassa
Chai), (Tawok Chai),and (Quri Chai).
The area of this region is about (11000km2) which forms (85%) from the whole basin area.
The basin has an erodible and weak top soil which is easily washed out towards the stream after rain
strea
storms, thus causing an increase of sediments loads in River water. So, Al-adeem River peak flow
Al adeem
badly influences domestic water at Baghdad city, especially when Tigris has low levels because of
the difficulties of purifying the water from fine sediments [1].
fin
All Iraqi rivers are considered as mixing river where they are fed by rain, ice and ground water,
except Al-adeem River which is classified as a rain–fed river due to its main dependence on rainfall
adeem
rain fed
in feeding its basin [2].
3.
MATERIALS AND METHOD
A Satellite image of Landsat7 ETM corrected was used in this research as shown in Fig. (1)
Landsat7-ETM
The satellite data was visually interoperated and accuracy was checked on the ground. Digital
Elevation Model (DEM) was created using Global Mapper.11 Fig. (2).
Fig. (1) Satellite image Landsat 7-ETM
7
for studied basin
Fig (2) Digital elevation model (DEM)
for studied basin Global Mapper 11
209](https://image.slidesharecdn.com/20320130406021-2-3-140108042922-phpapp01/85/20320130406021-2-3-2-320.jpg)
![International Journal of Civil Engineering and Technology (IJCIET), ISSN 0976 – 6308
(Print), ISSN 0976 – 6316(Online) Volume 4, Issue 6, November – December (2013), © IAEME
The DEM map used for drive slope map for the catchment area by using the same software
(Global Mapper .11), Fig.(3) shows the slope map for the studied catchment area.
Fig. (3) Slope map for studied basin Global Mapper 11.1
ERDAS 8.4 software used for produce supervised classification map[3] depending on the
produce
Hydraulic Soil Group map (HSG) for the catchment area that constructed by using Arc Veiw GIS 3.3
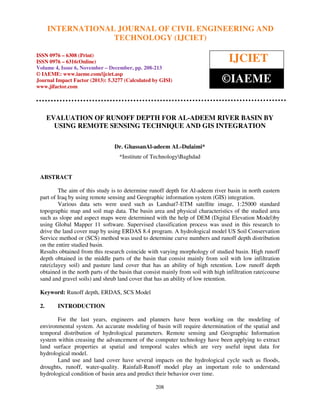
software depending on the soil data for the catchment area as shown in Fig.(4) and Fig.(5). The basin
dived into four sub-basins according to the variety in soil type, land cover and divide flow Fig.(6).
basins
Fig.(4) Hydraulic soil group (HSG)
map for studied basin ArcVeiw GIS 3.3
Fig.(5) Supervised classification map
for studied basin ERDAS 8.4
210](https://image.slidesharecdn.com/20320130406021-2-3-140108042922-phpapp01/85/20320130406021-2-3-3-320.jpg)
![International Journal of Civil Engineering and Technology (IJCIET), ISSN 0976 – 6308
(Print), ISSN 0976 – 6316(Online) Volume 4, Issue 6, November – December (2013), © IAEME
The Soil Conservation Model (SCS)[4]was used in this research as a hydrological model to
drive the runoff depth in catchment area, the main input data in this model is the rainfall data which
collected from Kirkuk metrological station. Average rainfall data found by using Isohyetal method.
The soil conservation model (SCS) developed by United states Department of Agriculture (USDA)
computes direct runoff through an empirical equation that requires the rainfall and a watershed
coefficient as inputs. The SCS has developed an index, which is called the runoff curve number
(CN), to represent the combined hydrologic effect of soil, land use, agricultural, land treatment class
hydrologic condition, and antecedent soil moisture condition.
General equation for the SCS curve number method is as follows [5]:
F
Q
ൌ
… … … . . ሺ1ሻ
S PെI
Where P: rainfall depth (mm), F: actual retention (mm), S: watershed storage (mm), Q: actual direct
runoff (mm), I: initial abstraction.
From the continuity principle:
F ൌ ሺP െ Iሻ െ Q … … … ሺ2ሻ
The SCS method defined the value of initial abstraction (I) to be approximately equal to 20% of
watershed storage (S).
ܫൌ 0.2 ൈ S … … … … … … … . ሺ3ሻ
Solving equation (1) and (2)
simultaneously:
ܳൌ
ሺܲ െ 0.2ܵሻଶ
ܲ 0.8ܵ
… … . . ሺ4ሻ
The watershed storage S and curve number CN are related
ܵൌ
25400
െ 254 … … … ሺ5ሻ
ܰܥ
The parameter CN, having a range of value between 0 and 100, called the curve number. In
this method a curve number (CN) assigned to each watershed or portion of watershed based on soil
type, land use and treatment .Fig.(7) shows curve number (CN) value for each sub-basin depending
on soil type and land cover by using SCS tables.
211](https://image.slidesharecdn.com/20320130406021-2-3-140108042922-phpapp01/85/20320130406021-2-3-4-320.jpg)

The document evaluates runoff depth for the Al-Adeem River basin in Iraq using remote sensing and GIS integration. Land cover classification was performed on a Landsat image to identify soil and land use types. A digital elevation model was used to derive slope and aspect maps. The basin was divided into four sub-basins based on soil and land cover variability. The SCS hydrological model was applied using curve numbers derived from soil and land cover to calculate runoff depth for each sub-basin. Higher runoff depths were found in sub-basins with clayey soils and pasture land covers, while lower depths occurred in areas with sandy soils and shrubland. The results matched the varying physical characteristics of