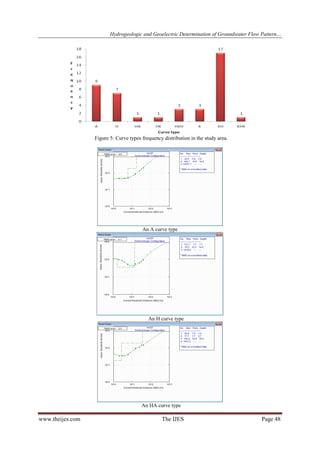
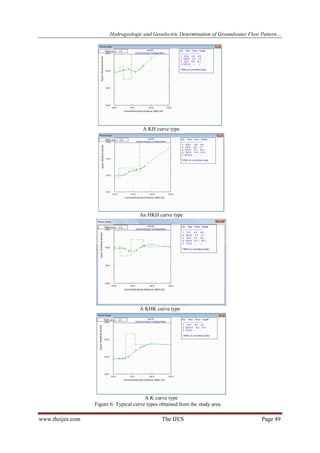
This document presents a study that delineates the groundwater flow pattern in Alaba-Apatapiti layouts in Akure, Nigeria, utilizing hydrogeologic measurements and geoelectric soundings. The research shows that groundwater predominantly flows from the central and north-central areas towards the southwestern part of the region, with significant findings presented in various maps and charts. Ultimately, it concludes that geoelectric methods can effectively determine groundwater flow directions, especially in areas lacking well data.

![Hydrogeologic and Geoelectric Determination of Groundwater Flow Pattern…
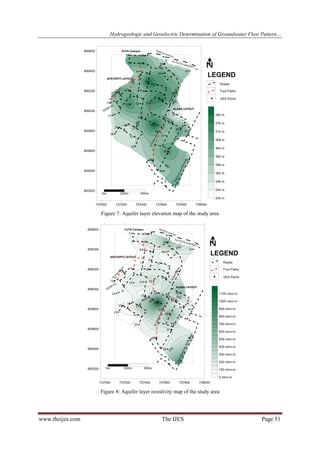
Figure 9: Comparison of groundwater elevation (a) and aquifer resistivity (b) maps
REFERENCES
[1]
[2]
[3]
[4]
[5]
[6]
[7]
[8]
[9]
[10]
[11]
[12]
[13]
[14]
[15]
[16]
Adeyemo, I.A. and G.O. Omosuyi, Hydrogeologic and Geoelectric Determination of Water Table at Aule Area, Akure, in the
Hard Rock Terrain of Southwestern Nigeria, Journal of Emerging Trend in Engineering and Applied Sciences, 3 (2), 2012, pp.
368-373.
Bhattacharya, P.K. and H.P. Patra, 1968, Direct Current Geoelectric Sounding, Elsevier Pub. Co., Amsterdam, 1968, pp. 135.
J.W. Delleur, Elementary Groundwater Flow and Transport Processes, In Handbook of Groundwater Engineering, Edited by J.W.
Delleur, 1999, 41p.
Keller, G.V. and F.C. Frishchnecht, Electrical Methods in Geophysical Prospecting. Pergamon Press, New York, 1966, pp. 96.
Koefoed, O., Geosounding Principles 1. Resistivity Measurements. Elsevier Scientific Publishing, Amsterdam,
Netherlands.
1979, pp. 275.
Kosinski, W.K. and W. E. Kelly, Geoelectric Sounding for Predicting Aquifer Properties, Groundwater, Vol. 9, No. 2, 1981,
pp163-171.
Mogaji, K.A., G.O. Omosuyi, and G.M. Olayanju, Groundwater System Evaluation and Protective Capacity of Overburden
Materials at Ile-Oluji, Southwestern Nigeria. Journal of Geology and Mining Research. Vol. 3(11), 2011, pp. 294-304.
Olayanju, G.M., M.A. Ayuk and A.O. Adelusi, Geotechnical Mapping of the Groundwater Regime
around
the
Federal
Polytechnic, Ado-Ekiti, Southwestern Nigeria. Journal of Geology and Mining Research, Vol. 3(8), 2011, pp. 201-210.
Olorunfemi, M.O., J.S. Ojo and O.M. Akintunde, Hydrogeophysical Evaluation of the Groundwater Potential of
Akure
Metropolis, South-Western Nigeria. Journal of Mining and Geology, 35(2), 1999, pp. 207-228.
Omosuyi, G.O., I.A. Adeyemo and A. O. Adegoke, Investigation of Groundwater Prospect Using Electromagnetic and
Geoelectric Sounding at Afunbiowo, near Akure, Southwestern Nigeria. The Pacific Journal of Science
and Technology. Vol.8, No. 2, 2007, pp. 172-182.
Omosuyi, G.O., J.S. Ojo and P.A. Enikanselu, 2003. Geophysical Investigation for Groundwater around Obanla-Obakekere in
Akure area within the Basement Complex of South-Western Nigeria. Journal of Mining and Geology. 39(2):1, 2003, pp. 109116.
Orellana, E. and H.M. Mooney, Master tables and Curves for Vertical Electrical Sounding over Layered Structures,
Madrid
Interciecia, 1966, 150 pp., 66 tables.
Owoyemi, F.B., 1996, A Geological-Geophysical Investigation of Rain-Induced Erosional Features in Akure Metropolis.
Unpublished. M.Tech Thesis, Federal University of Technology: Akure, Nigeria, pp. 11-18.
Rahaman, M.A., 1989. Review of the Basements Geology of Southwestern Nigeria, In Kogbe, C.A (Edited). Geology of Nigeria,
pp 39-56.
Vander Velpen, B. P. A., 2004, WinRESIST Software Version 1.0. ITC, IT-RSG/GSD, Delft, Netherlands.
Zohdy, A.A.R., 1965, The Auxiliary Method of Electrical Sounding Interpretation and its Relationship to the
Dar Zarrouk Parameters, Geophysics. Vol. 30, No. 4, pp. 644-660.
www.theijes.com
The IJES
Page 52](https://image.slidesharecdn.com/h0324044052-140228051638-phpapp01/85/H0324044052-9-320.jpg)


![Getting Started with Apache Spark: Big Data Made Simple [Free Meetup]](https://cdn.slidesharecdn.com/ss_thumbnails/apachesparkgettingstarted-260203175547-8361bcc3-thumbnail.jpg?width=640&height=640&fit=bounds)


