Download to read offline


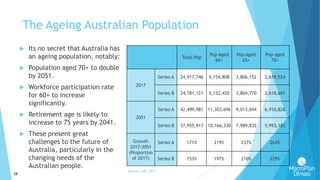
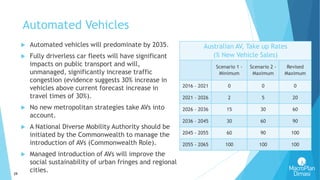


This document provides an overview and outlook of the Australian property market in 2018. It discusses factors like the national economic context, key growth sectors like tourism and education, demographic trends like an aging population, and future transformations from technology like automated vehicles. The global, national, and sector-specific outlooks indicate continued economic growth, shifting investment patterns towards services, and demand driven by population increases and new job growth.


