Downloaded 12 times


![66 Performance
Snam Fact Book 2015
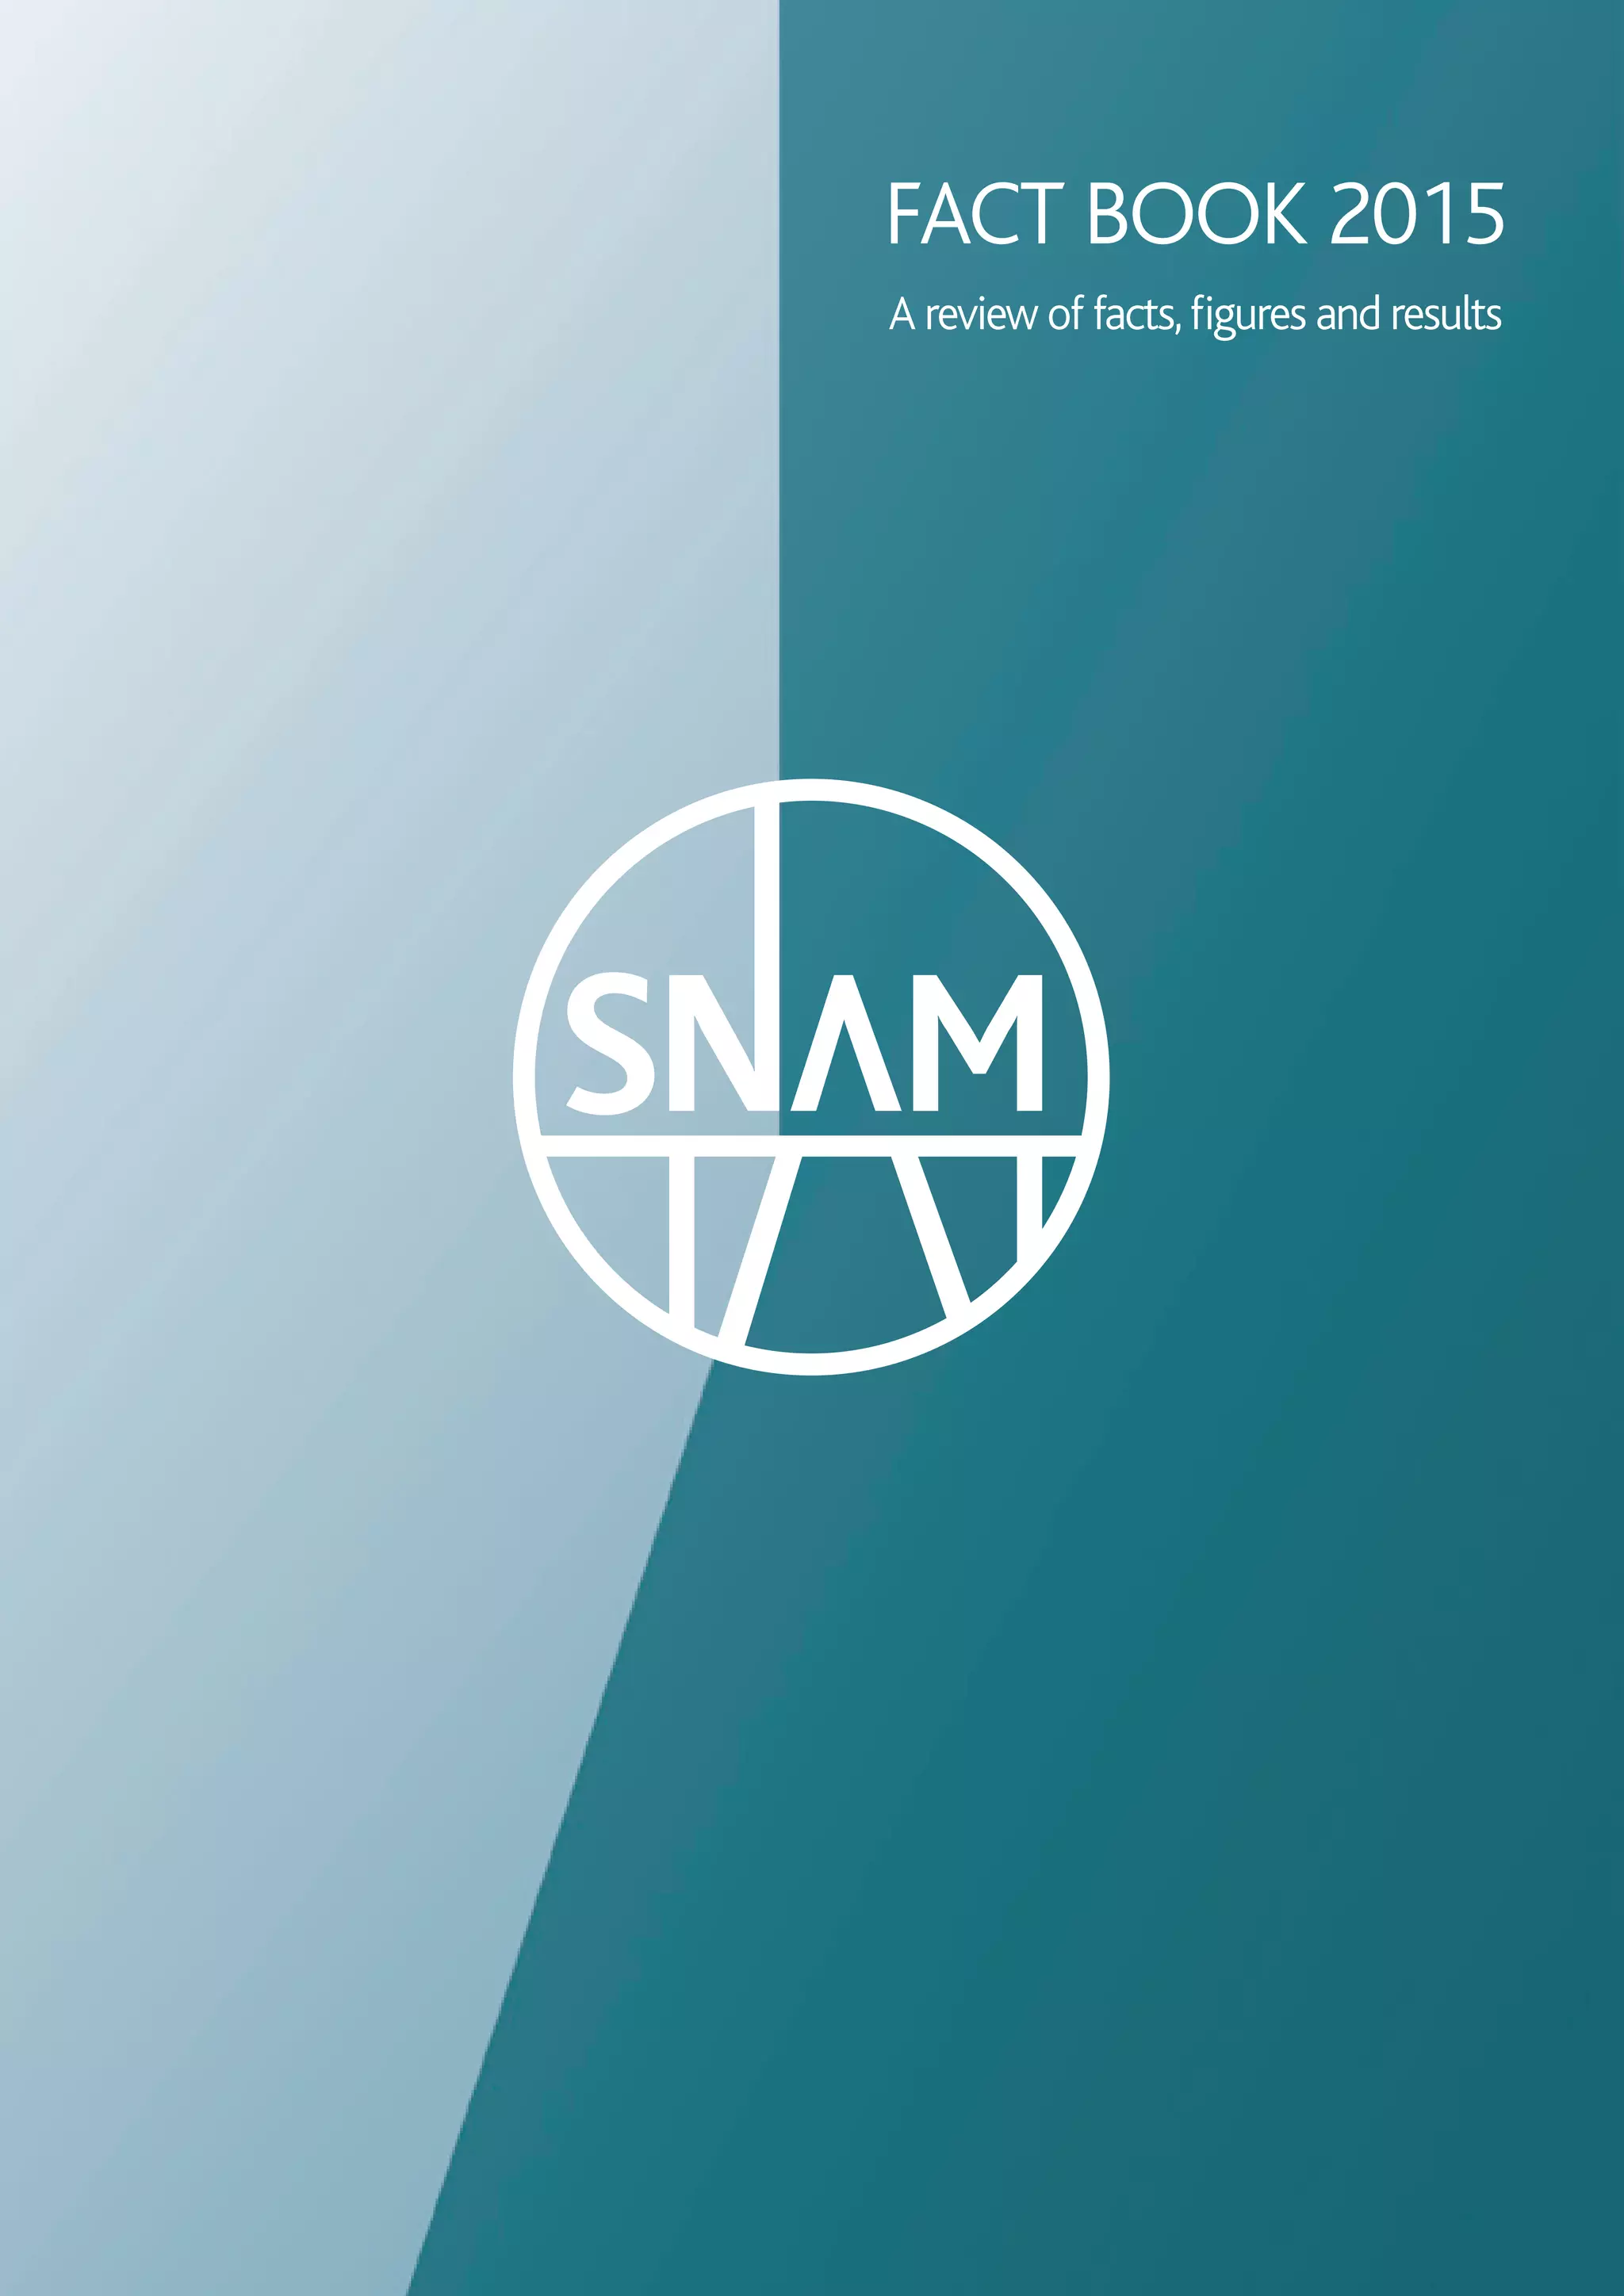
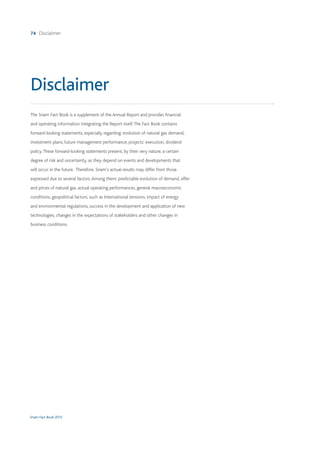
Environmental performance
2012 2013 2014
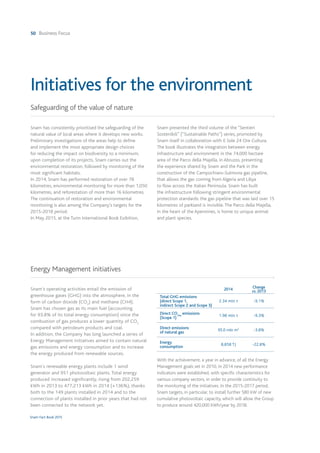
Energy consumption (TJ) 12,801 11,467 8,858
Natural gas emissions (106
m3
) 98.4 98.8 95
GHG emissions scope 1-2-3 (103
t CO2eq) 2,631 2,574 2,341
GHG emissions scope 1 (103
t CO2eq) 2,234 2,181 1,978
GHG emissions scope 2 (103
t CO2eq) 33.1 32.2 31.5
GHG emissions scope 3 (103
t CO2eq) 360 361 333
NOx emissions (t) 985 837 497
CO emissions (t) 363 327 265
Total waste production (t) 31,865 61,217 57,819
Non-hazardous waste production (t) 30,117 58,039 54,144
Hazardous waste production (t) 1,748 3,178 3,676
Waste recovered from production activities (%) 47 96 54
Freshwater procurement (103
m3
) 460 281 339
Freshwater discharged (103
m3
) 199 188 258
Sea water procurement (103
m3
) 4,000 4,000 4,000
Sea water discharged (103
m3
) 4,000 4,000 4,000
Snam Group
CO2 emissions/energy used (kg/GJ) 54 54.3 54
NOx emissions/energy used (kg/GJ) 0.077 0.073 0.056
Natural gas transport
Energy consumption/energy compressed (%) 0.27 0.25 0.23
CO2 emissions/gas compressed (kg/106
m3
) 5,991 5,834 5,941
Natural gas emissions/km of network (m3
/km) 1,288 1,238 1,151
NOx emissions/gas compressed (kg/106
m3
) 8.3 7.5 6.3
Average rated turbine NOx emissions/total installed capacity ([mg/Nm3
]/MW) 5.9 5.7 5.4
DLE turbine hours of operation/total turbine hours of operation (%) 75 76 87
Liquefied natural gas regasification
Energy consumption/LNG injected into the network (%) 1.44 (*) (*)
CO2eq emissions/LNG injected into the network (kg/106
m3
) 47,553 (*) (*)
Natural gas storage
Natural gas emissions for storage/gas stored (%) 0.07 0.061 0.067
NOx emissions/gas stored kg/106
m3
45.6 39.1 28
Average rated turbine NOx emissions/total installed capacity ([mg/Nm3
]/MW) 13.6 9.6 6.2
Natural gas distribution
Natural gas emissions/km of network (m3
/km) 840 828 813
CO2eq emissions/gas distributed (kg/106
m3
) 96,000 97,712 111,475
(*) Data not significant due to reduced regasification activity
KPI description KPI date Pre-set target Target achieved in 2014 Status Activities
Natural gas recovered out of total potential
emissions from maintenance activities
2010 Recover 30% in 2014 37% Transportation
Contain natural gas emissions
in the transportation network
2014
Keep annual emissions of natural
gas below 1,240 m3
/km until 2017
1,151 m3
/km Transportation
Replacement of cast-iron networks 2010
Replace the entire grey
cast-iron network by 2015
298 km Distribution
Contain natural gas emissions
in the distribution network
2014
Reach emissions of natural gas
of 790 m3
/km in 2017
802 m3
/km Distribution](https://image.slidesharecdn.com/factbook-151027075316-lva1-app6892/85/Snam-Fact-Book-2015-68-320.jpg)
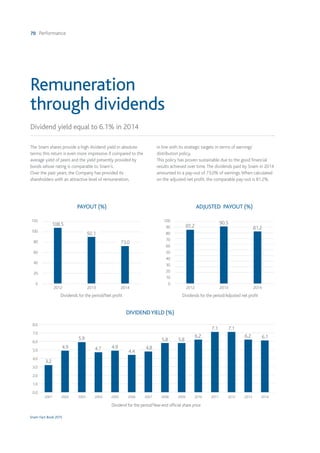


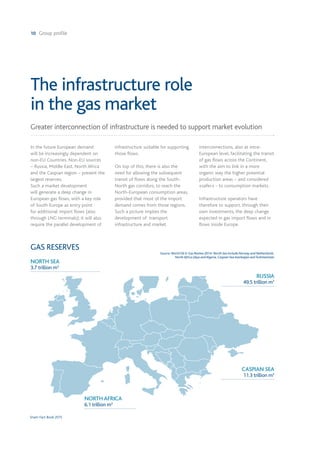
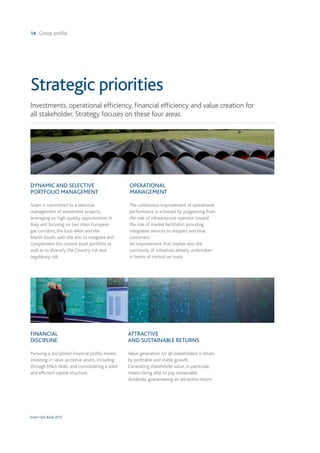
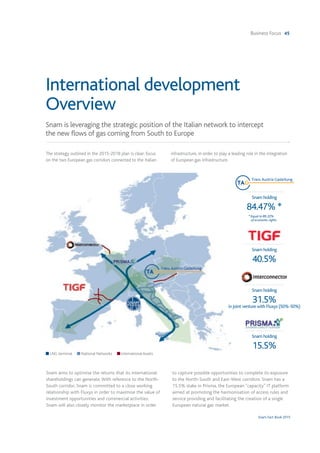
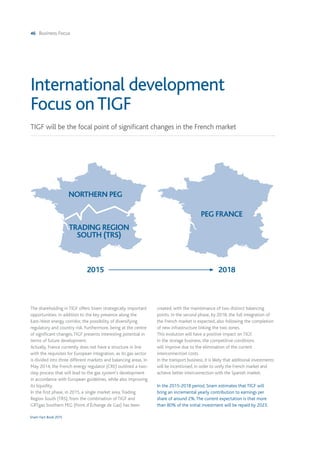
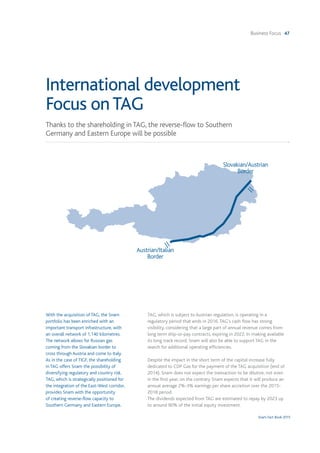
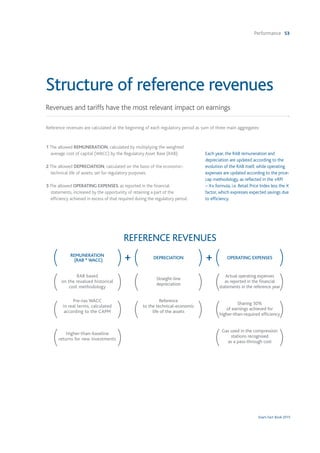
This document provides an overview of Snam Group, a European leader in natural gas infrastructure. It discusses Snam's vision, integrated infrastructure network across Europe, management team, and the evolving European natural gas market landscape. The market is expected to become more dependent on imports from outside Europe, requiring further development of infrastructure to transport gas from southern European entry points to consumption areas in northern Europe. Snam aims to efficiently manage gas systems and promote a more integrated European network to support the changing market.


