Download as PDF, PPTX

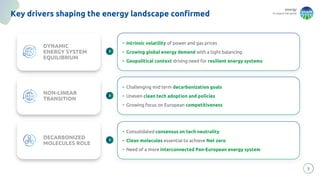
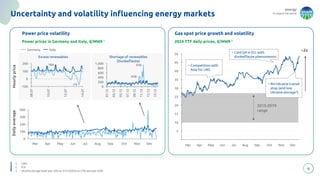

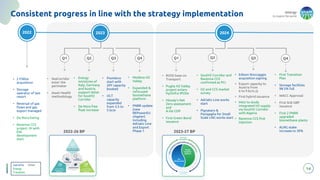
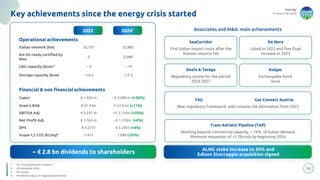
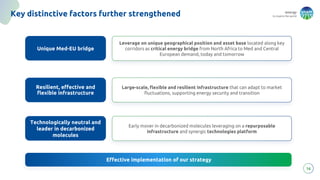
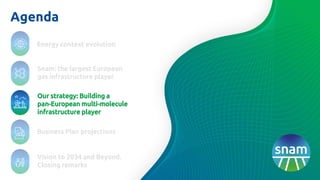
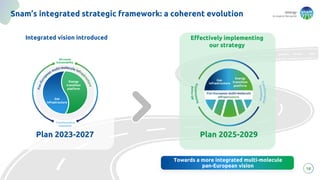

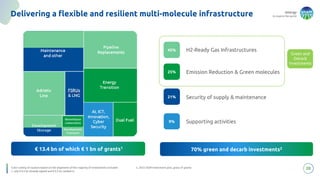


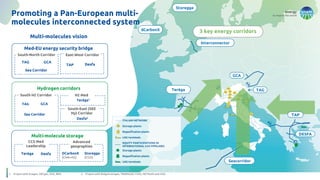
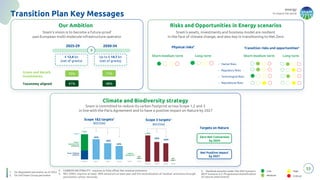


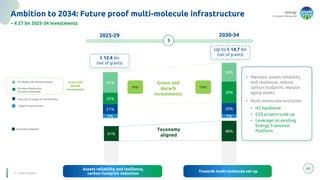

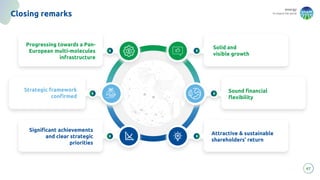


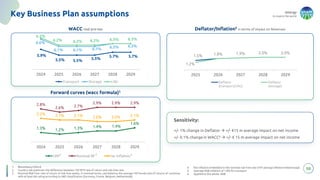
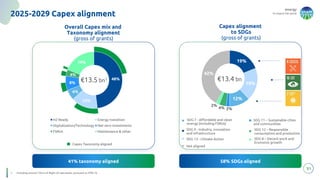


The document outlines Snam's strategic plan to develop a pan-European multi-molecule infrastructure by 2034, addressing the evolving energy landscape shaped by decarbonization, geopolitical resilience, and market volatility. It highlights the projected growth in renewable energy sources and the essential role of clean gas and hydrogen in achieving net zero emissions, while positioning Italy as a leader in biomethane and decarbonized molecules. Key achievements since the energy crisis include significant investments and strategic partnerships to enhance infrastructure capacity and meet changing energy demands.


