Download to read offline

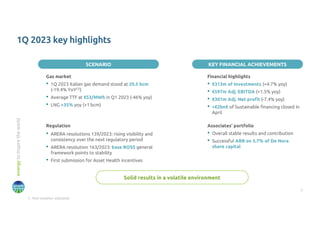
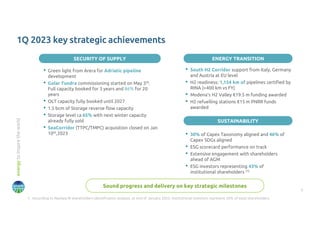
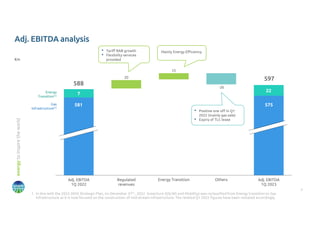
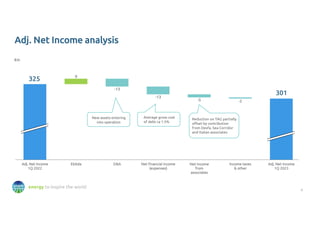
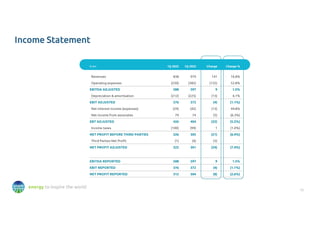
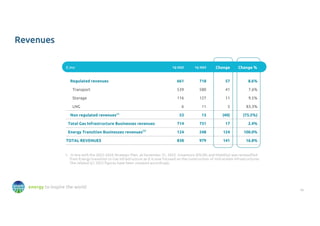
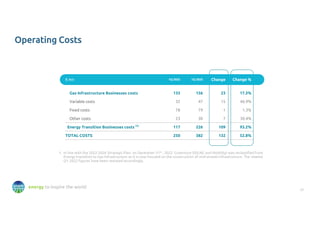
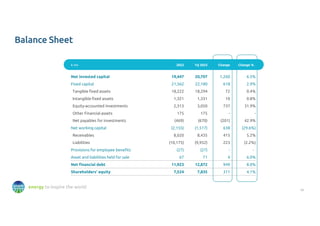
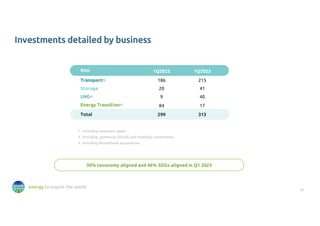

Snam reported its consolidated results for the first quarter of 2023. Key highlights include: - Revenues of €979 million, up 16.8% year-over-year, driven by growth in regulated revenues. - Adjusted EBITDA of €597 million, up 1.5% year-over-year. - Adjusted net profit of €301 million, down 7.4% year-over-year mainly due to higher net interest expenses. - Investments of €313 million in the quarter, focused on energy transition and infrastructure security. - Sound progress on strategic initiatives including the Adriatic pipeline and Golar Tundra commissioning.


