Download as PDF, PPTX


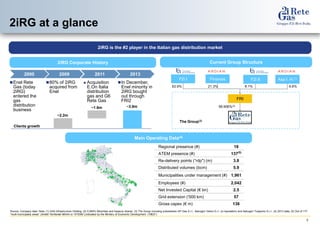
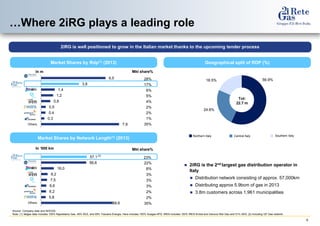
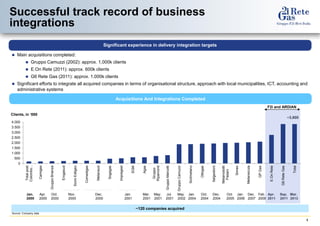
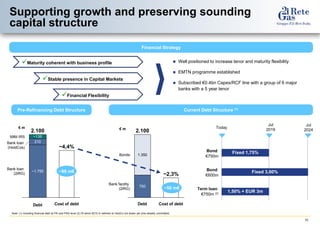

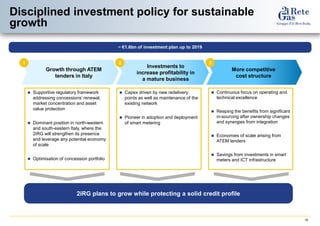
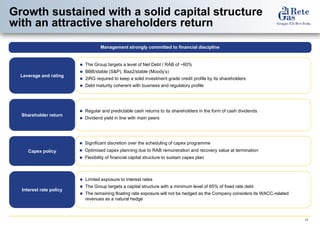


2irg is the second largest player in the Italian gas distribution market, managing a network of approximately 57,000 km and serving around 3.8 million customers across 1,961 municipalities. The company has experienced significant growth through acquisitions and is well-positioned for future expansion via upcoming tender processes for gas distribution areas. Financially, 2irg aims to maintain a solid investment-grade credit profile while implementing a strategic investment plan focused on smart metering and operational efficiencies.


