Download to read offline

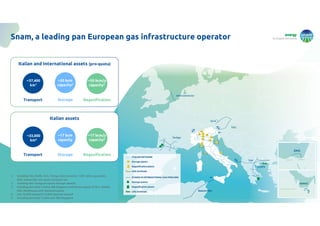
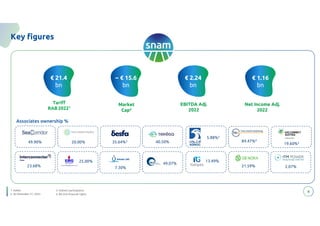


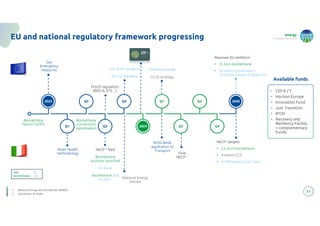
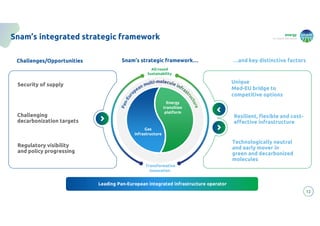
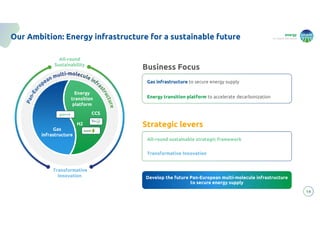
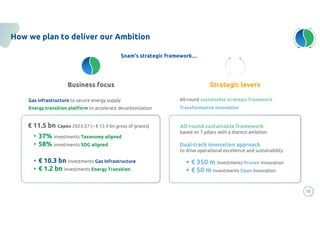
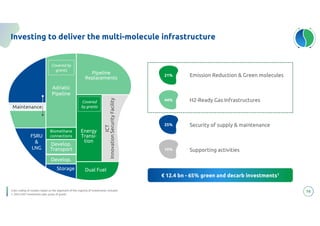
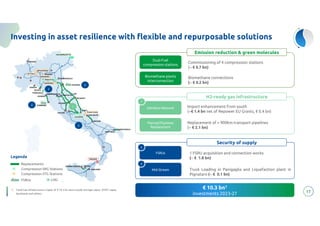
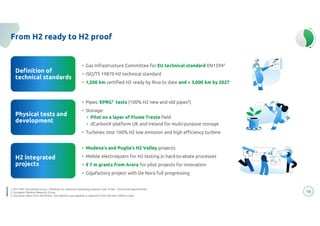
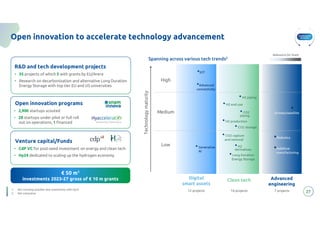
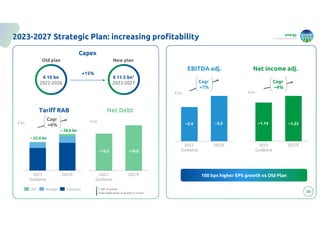


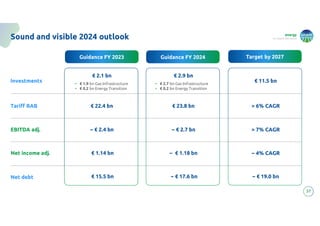
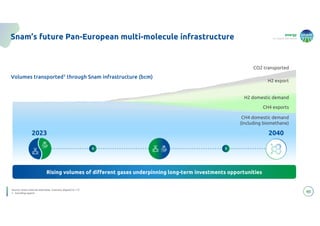
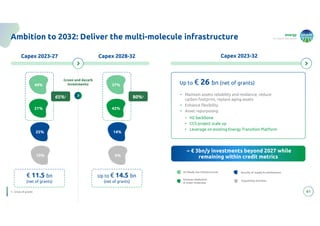
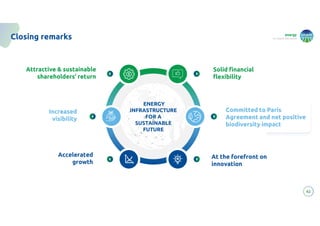

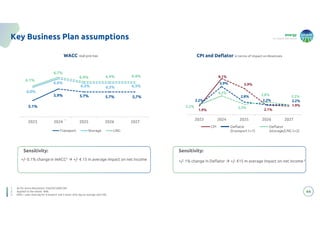
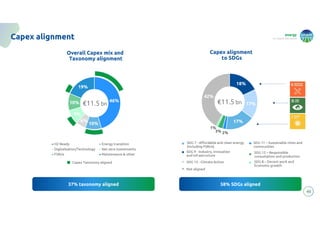
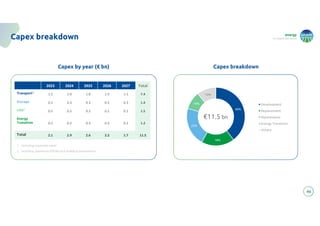
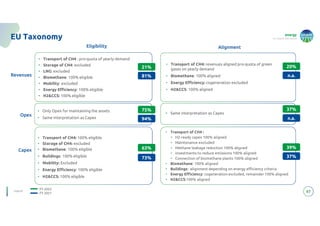
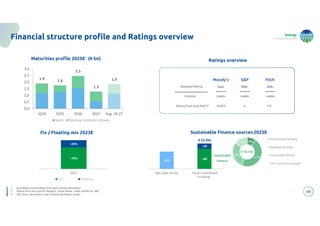

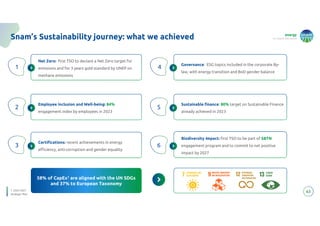
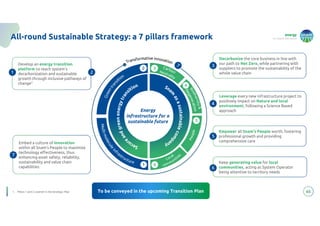
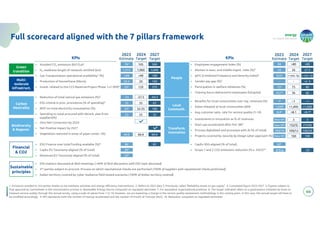


The document discusses Snam's strategic plan to develop energy infrastructure for a sustainable future. It outlines Snam's vision to become a leading pan-European multi-molecule infrastructure operator through investments in gas, hydrogen, carbon capture and storage networks. Key points include plans to invest €11.5 billion from 2023-2027, with 37% of investments aligned with EU taxonomy and 58% with UN Sustainable Development Goals. A focus is on developing hydrogen and making existing gas networks hydrogen-ready to enable the energy transition while maintaining security of energy supply across Europe.


