Download as PDF, PPTX

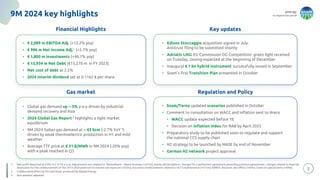
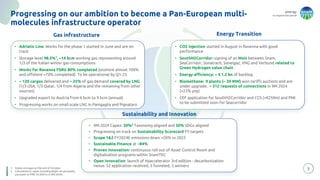
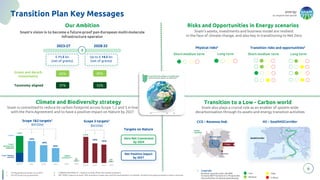
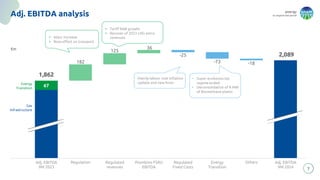
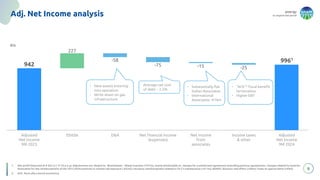
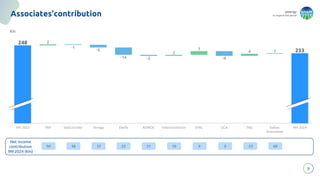
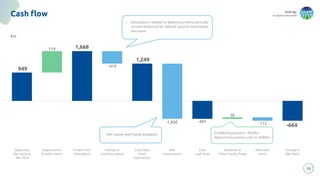
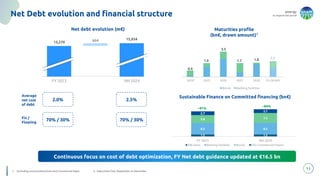
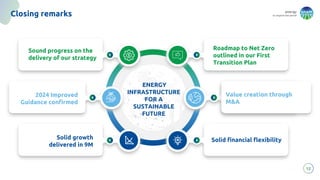

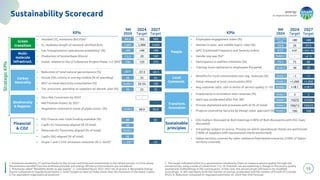
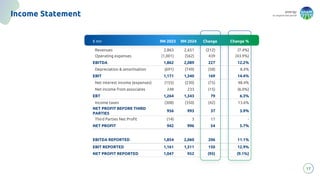
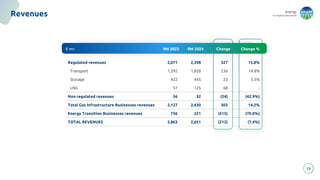
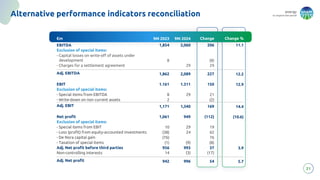
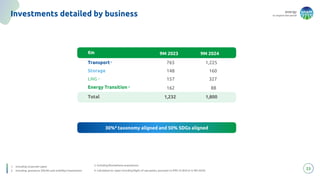

In the first nine months of 2024, Snam reported a net profit of €952 million, down 9.1% year-over-year, affected by adjustments related to biomethane and associates. The company outlined its strategy to transition to a sustainable future, with notable financial highlights including an adjusted EBITDA of €2,089 million and investments totaling €1,800 million. Snam is actively progressing on projects related to green hydrogen and carbon capture, reflecting its commitment to reducing emissions and enhancing energy efficiency.


