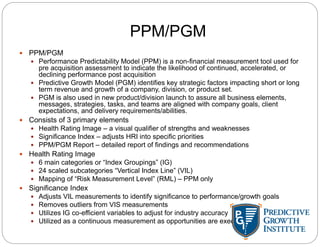
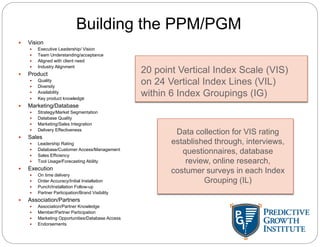
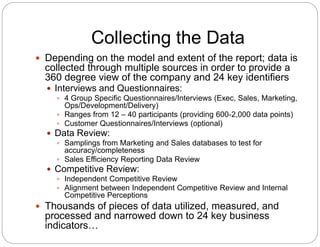
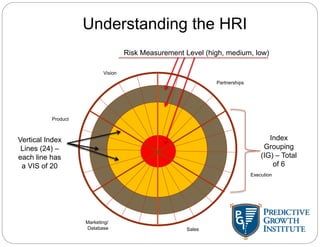
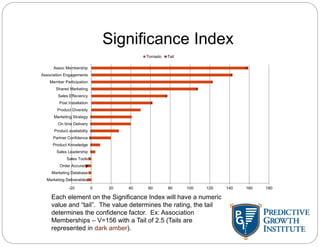
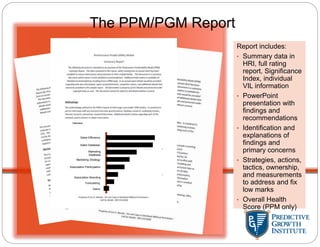
Performance Predictability/Predictive
Growth Modeling - Overview
Predictive Growth Institute
PPM/PGM
 PPM/PGM
 Performance Predictability Model (PPM) is a non-financial measurement tool used for
pre acquisition assessment to indicate the likelihood of continued, accelerated, or
declining performance post acquisition
 Predictive Growth Model (PGM) identifies key strategic factors impacting short or long
term revenue and growth of a company, division, or product set.
 PGM is also used in new product/division launch to assure all business elements,
messages, strategies, tasks, and teams are aligned with company goals, client
expectations, and delivery requirements/abilities.
 Consists of 3 primary elements
 Health Rating Image – a visual qualifier of strengths and weaknesses
 Significance Index – adjusts HRI into specific priorities
 PPM/PGM Report – detailed report of findings and recommendations
 Health Rating Image
 6 main categories or “Index Groupings” (IG)
 24 scaled subcategories “Vertical Index Line” (VIL)
 Mapping of “Risk Measurement Level” (RML) – PPM only
 Significance Index
 Adjusts VIL measurements to identify significance to performance/growth goals
 Removes outliers from VIS measurements
 Utilizes IG co-efficient variables to adjust for industry accuracy
 Utilized as a continuous measurement as opportunities are executed
20 point Vertical Index Scale (VIS)
on 24 Vertical Index Lines (VIL)
within 6 Index Groupings (IG)
 Vision
 Executive Leadership/ Vision
 Team Understanding/acceptance
 Aligned with client need
 Industry Alignment
 Product
 Quality
 Diversity
 Availability
 Key product knowledge
 Marketing/Database
 Strategy/Market Segmentation
 Database Quality
 Marketing/Sales Integration
 Delivery Effectiveness
 Sales
 Leadership Rating
 Database/Customer Access/Management
 Sales Efficiency
 Tool Usage/Forecasting Ability
 Execution
 On time delivery
 Order Accuracy/Initial Installation
 Punch/Installation Follow-up
 Partner Participation/Brand Visibility
 Association/Partners
 Association/Partner Knowledge
 Member/Partner Participation
 Marketing Opportunities/Database Access
 Endorsements
Data collection for VIS rating
established through, interviews,
questionnaires, database
review, online research,
costumer surveys in each Index
Grouping (IL)
Building the PPM/PGM
Collecting the Data
 Depending on the model and extent of the report; data is
collected through multiple sources in order to provide a
360 degree view of the company and 24 key identifiers
 Interviews and Questionnaires:
 4 Group Specific Questionnaires/Interviews (Exec, Sales, Marketing,
Ops/Development/Delivery)
 Ranges from 12 – 40 participants (providing 600-2,000 data points)
 Customer Questionnaires/Interviews (optional)
 Data Review:
 Samplings from Marketing and Sales databases to test for
accuracy/completeness
 Sales Efficiency Reporting Data Review
 Competitive Review:
 Independent Competitive Review
 Alignment between Independent Competitive Review and Internal
Competitive Perceptions
 Thousands of pieces of data utilized, measured, and
processed and narrowed down to 24 key business
indicators…
For each point on the Vertical Index Lines (VIL); multiple
data points are evaluated in order to create a “360 degree”
view. Whether through research, live interviews, or online
forms – multiple questions asked in multiple ways, of
multiple influencers are combined and calculated to create
the single value point on each VIL. Once collected, data is
valued and plotted on each of the 24 VIL spokes to create
the Health Rating Image
Turning Data in to an Image
Vision
Partnerships
Product
Execution
Sales
Marketing
/Database
Health Rating Image
Understanding the HRI
Vision
Partnerships
Product
Execution
Marketing/
Database
Vertical Index
Lines (24) –
each line has
a VIS of 20
Index
Grouping
(IG) – Total
of 6
Risk Measurement Level (high, medium, low)
Sales
Once the data points are established on the HRI,
each point is run through a set of additional
algorithms to determine the significance and
confidence of that data. The significance is the
Significance Index – the confidence is the Tail
Turning the HRI into Action
Significance Index
Each element on the Significance Index will have a numeric
value and “tail”. The value determines the rating, the tail
determines the confidence factor. Ex: Association
Memberships – V=156 with a Tail of 2.5 (Tails are
represented in dark amber).
-20 0 20 40 60 80 100 120 140 160 180
Marketing Deliverables
Marketing Database
Order Accuracy
Sales Tools
Sales Leadership
Product Knowledge
Partner Confidence
Product availability
On time Delivery
Marketing Strategy
Product Diversity
Post Installation
Sales Effeciency
Shared Marketing
Member Participation
Association Engagements
Assoc Membership
Tornado Tail
All the data collected is published in a
final report identifying methodologies,
results, recommendations, and
calculations and data findings
Final Report
Report
Report includes:
• Summary data in
HRI, full rating
report, Significance
Index, individual
VIL information
• PowerPoint
presentation with
findings and
recommendations
• Identification and
explanations of
findings and
primary concerns
• Strategies, actions,
tactics, ownership,
and measurements
to address and fix
low marks
• Overall Health
Score (PPM only)
Sales Efficiency
Sales Database
Marketing
Database
Marketing Strategy
Association Participation
Association Branding
Forecasting
Vision
The PPM/PGM Report

2016 Overview-3

  • 1.
    Performance Predictability/Predictive Growth Modeling- Overview Predictive Growth Institute
  • 2.
    PPM/PGM  PPM/PGM  PerformancePredictability Model (PPM) is a non-financial measurement tool used for pre acquisition assessment to indicate the likelihood of continued, accelerated, or declining performance post acquisition  Predictive Growth Model (PGM) identifies key strategic factors impacting short or long term revenue and growth of a company, division, or product set.  PGM is also used in new product/division launch to assure all business elements, messages, strategies, tasks, and teams are aligned with company goals, client expectations, and delivery requirements/abilities.  Consists of 3 primary elements  Health Rating Image – a visual qualifier of strengths and weaknesses  Significance Index – adjusts HRI into specific priorities  PPM/PGM Report – detailed report of findings and recommendations  Health Rating Image  6 main categories or “Index Groupings” (IG)  24 scaled subcategories “Vertical Index Line” (VIL)  Mapping of “Risk Measurement Level” (RML) – PPM only  Significance Index  Adjusts VIL measurements to identify significance to performance/growth goals  Removes outliers from VIS measurements  Utilizes IG co-efficient variables to adjust for industry accuracy  Utilized as a continuous measurement as opportunities are executed
  • 3.
    20 point VerticalIndex Scale (VIS) on 24 Vertical Index Lines (VIL) within 6 Index Groupings (IG)  Vision  Executive Leadership/ Vision  Team Understanding/acceptance  Aligned with client need  Industry Alignment  Product  Quality  Diversity  Availability  Key product knowledge  Marketing/Database  Strategy/Market Segmentation  Database Quality  Marketing/Sales Integration  Delivery Effectiveness  Sales  Leadership Rating  Database/Customer Access/Management  Sales Efficiency  Tool Usage/Forecasting Ability  Execution  On time delivery  Order Accuracy/Initial Installation  Punch/Installation Follow-up  Partner Participation/Brand Visibility  Association/Partners  Association/Partner Knowledge  Member/Partner Participation  Marketing Opportunities/Database Access  Endorsements Data collection for VIS rating established through, interviews, questionnaires, database review, online research, costumer surveys in each Index Grouping (IL) Building the PPM/PGM
  • 4.
    Collecting the Data Depending on the model and extent of the report; data is collected through multiple sources in order to provide a 360 degree view of the company and 24 key identifiers  Interviews and Questionnaires:  4 Group Specific Questionnaires/Interviews (Exec, Sales, Marketing, Ops/Development/Delivery)  Ranges from 12 – 40 participants (providing 600-2,000 data points)  Customer Questionnaires/Interviews (optional)  Data Review:  Samplings from Marketing and Sales databases to test for accuracy/completeness  Sales Efficiency Reporting Data Review  Competitive Review:  Independent Competitive Review  Alignment between Independent Competitive Review and Internal Competitive Perceptions  Thousands of pieces of data utilized, measured, and processed and narrowed down to 24 key business indicators…
  • 5.
    For each pointon the Vertical Index Lines (VIL); multiple data points are evaluated in order to create a “360 degree” view. Whether through research, live interviews, or online forms – multiple questions asked in multiple ways, of multiple influencers are combined and calculated to create the single value point on each VIL. Once collected, data is valued and plotted on each of the 24 VIL spokes to create the Health Rating Image Turning Data in to an Image
  • 6.
  • 7.
    Understanding the HRI Vision Partnerships Product Execution Marketing/ Database VerticalIndex Lines (24) – each line has a VIS of 20 Index Grouping (IG) – Total of 6 Risk Measurement Level (high, medium, low) Sales
  • 8.
    Once the datapoints are established on the HRI, each point is run through a set of additional algorithms to determine the significance and confidence of that data. The significance is the Significance Index – the confidence is the Tail Turning the HRI into Action
  • 9.
    Significance Index Each elementon the Significance Index will have a numeric value and “tail”. The value determines the rating, the tail determines the confidence factor. Ex: Association Memberships – V=156 with a Tail of 2.5 (Tails are represented in dark amber). -20 0 20 40 60 80 100 120 140 160 180 Marketing Deliverables Marketing Database Order Accuracy Sales Tools Sales Leadership Product Knowledge Partner Confidence Product availability On time Delivery Marketing Strategy Product Diversity Post Installation Sales Effeciency Shared Marketing Member Participation Association Engagements Assoc Membership Tornado Tail
  • 10.
    All the datacollected is published in a final report identifying methodologies, results, recommendations, and calculations and data findings Final Report
  • 11.
    Report Report includes: • Summarydata in HRI, full rating report, Significance Index, individual VIL information • PowerPoint presentation with findings and recommendations • Identification and explanations of findings and primary concerns • Strategies, actions, tactics, ownership, and measurements to address and fix low marks • Overall Health Score (PPM only) Sales Efficiency Sales Database Marketing Database Marketing Strategy Association Participation Association Branding Forecasting Vision The PPM/PGM Report