Download as PDF, PPTX
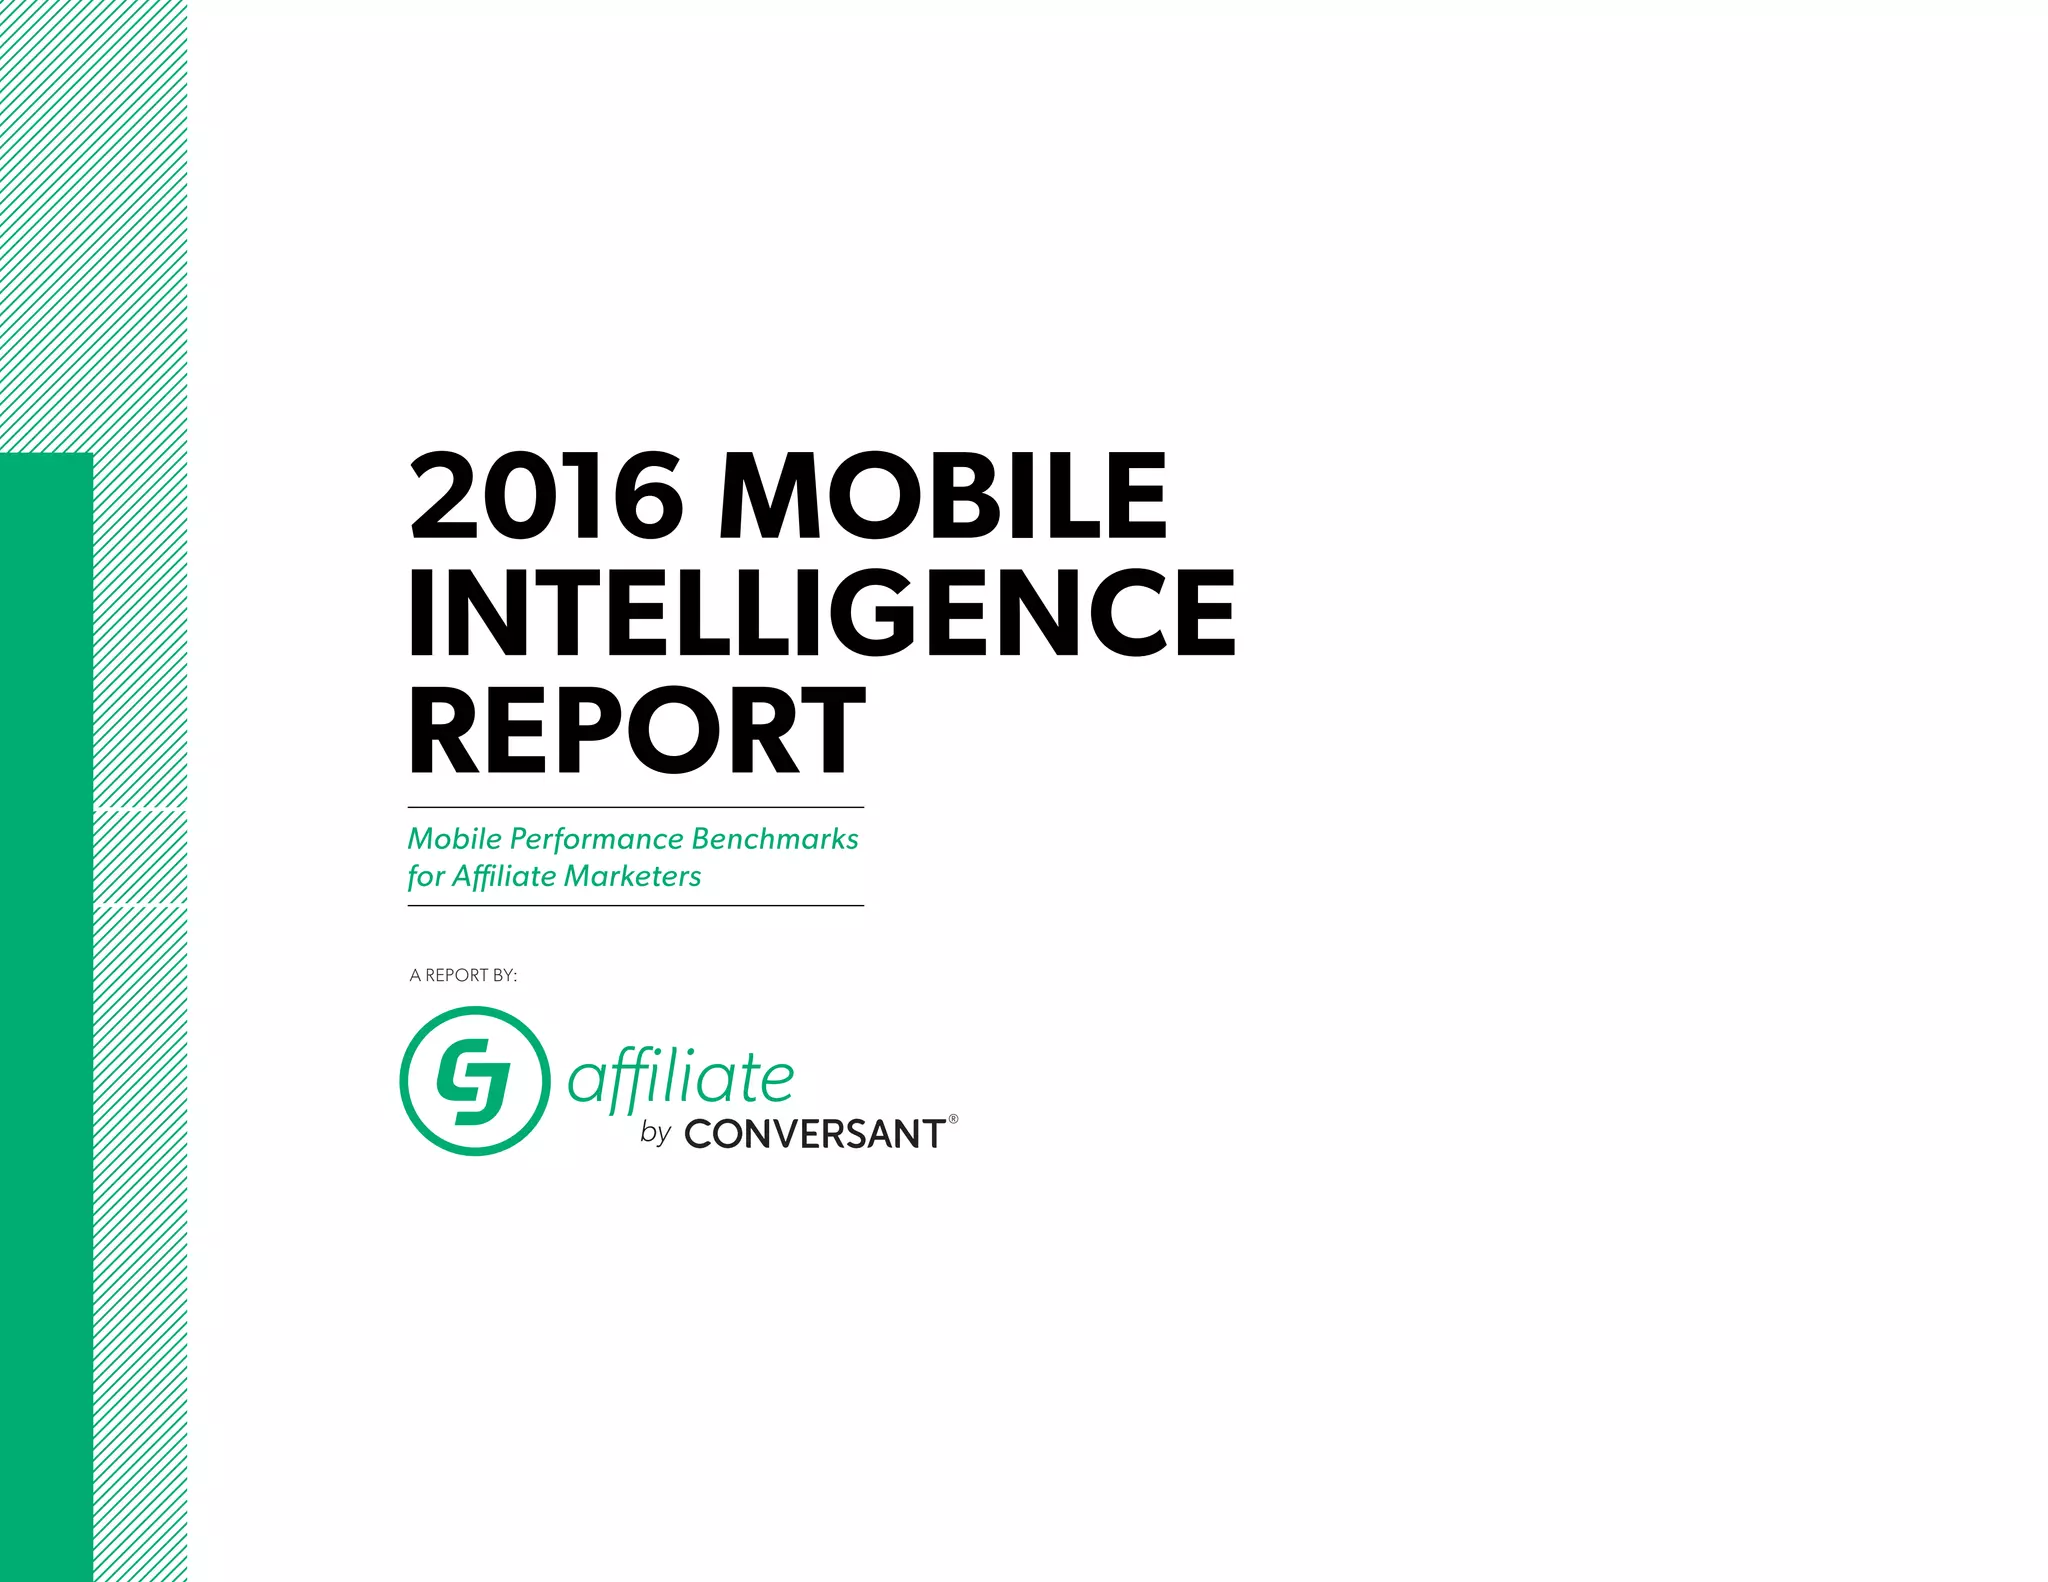
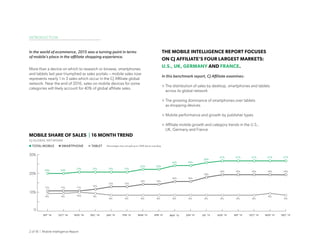


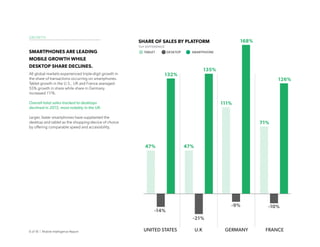
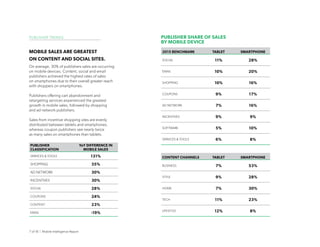
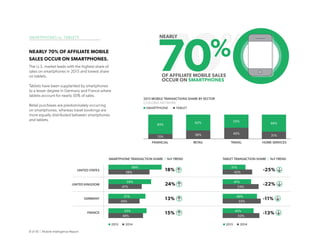
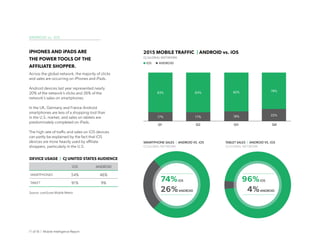
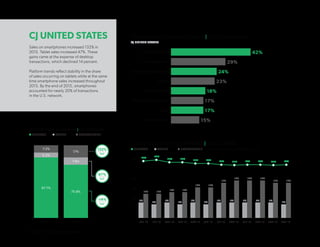
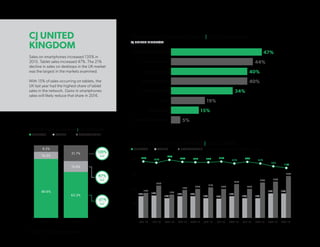
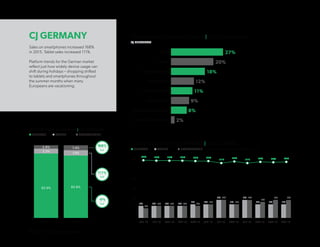
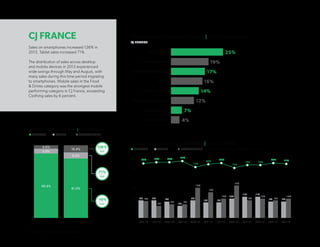


The 2016 Mobile Intelligence Report highlights the significant rise of mobile sales in the affiliate marketing space, indicating that nearly one in three sales on the CJ Affiliate network now occur via mobile devices, with projections suggesting mobile will account for 40% of global affiliate sales by the end of 2016. The report analyzes mobile performance across major markets including the U.S., UK, Germany, and France, revealing that smartphones dominate mobile transactions while tablets are still relevant in certain regions. Key strategies for marketers emphasize app optimization and diversification of affiliate programs to maximize mobile reach and sales.


