Download to read offline


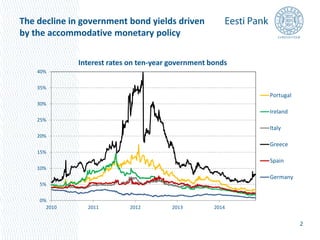
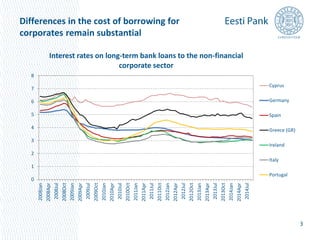
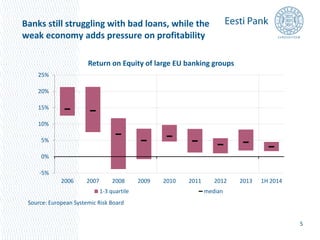

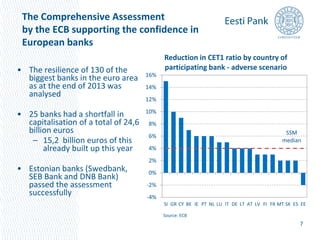

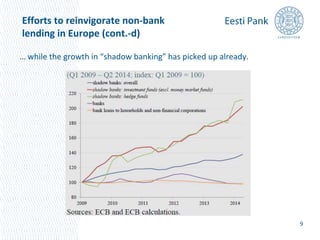

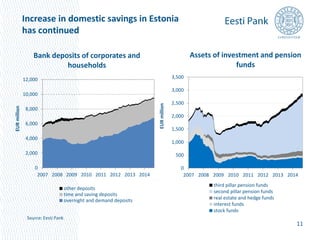
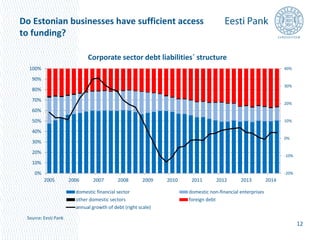


The document discusses recent developments in the European financial system. It notes that government bond yields have declined due to accommodative monetary policy. However, interest rates on loans to corporations still vary substantially between countries. While the European Central Bank has implemented new supervisory mechanisms, banks continue struggling with bad loans and weak profitability. The document also examines the Estonian banking sector, which has strong capitalization and profitability compared to other countries. It notes early promising signs of growth in alternative funding sources for Estonian businesses like private equity funds, but the capital markets remain underdeveloped.


