Download to read offline
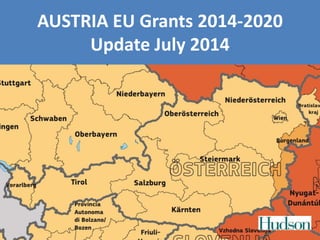
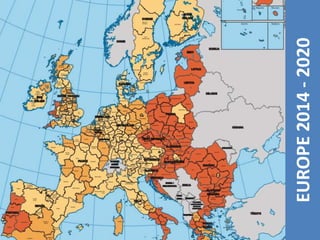
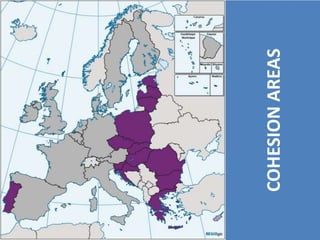
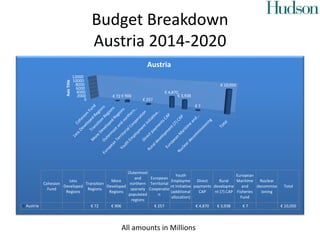
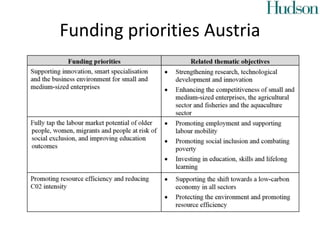


The document provides an update on Austria's EU grants for the period 2014-2020, detailing regional aid maps and the maximum aid percentages for investment projects based on company size. It highlights a population coverage in eligible regions of 25.87% and notes a slight decrease in aid intensity, aligning with new regional aid guidelines focused on disadvantaged regions. It also outlines the status of partnership agreements and operational programs submission across various EU member states as of May 2014.


