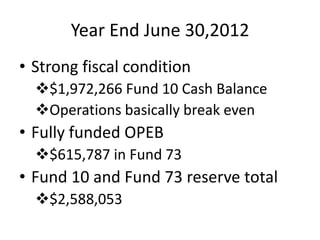
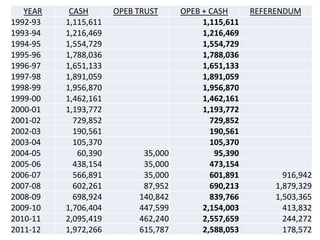
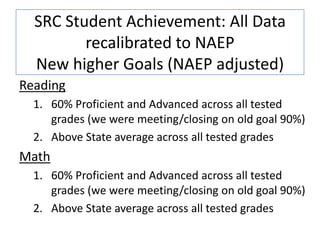
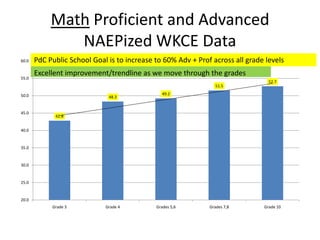
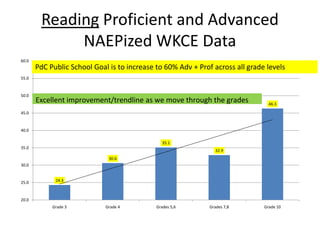
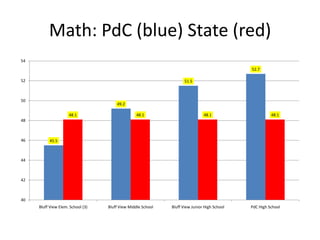
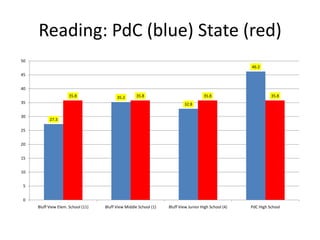
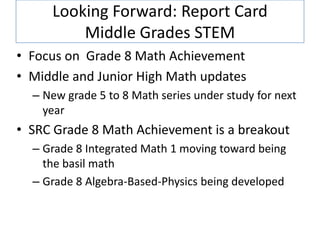
School Board Meeting

       Finances
      School Start
Year End June 30,2012
• Strong fiscal condition
  $1,972,266 Fund 10 Cash Balance
  Operations basically break even
• Fully funded OPEB
  $615,787 in Fund 73
• Fund 10 and Fund 73 reserve total
  $2,588,053
YEAR    CASH       OPEB TRUST     OPEB + CASH      REFERENDUM
1992-93   1,115,611                       1,115,611
1993-94   1,216,469                       1,216,469
1994-95   1,554,729                       1,554,729
1995-96   1,788,036                       1,788,036
1996-97   1,651,133                       1,651,133
1997-98   1,891,059                       1,891,059
1998-99   1,956,870                       1,956,870
1999-00   1,462,161                       1,462,161
2000-01   1,193,772                       1,193,772
2001-02     729,852                         729,852
2002-03     190,561                         190,561
2003-04     105,370                         105,370
2004-05      60,390         35,000           95,390
2005-06     438,154         35,000          473,154
2006-07     566,891         35,000          601,891          916,942
2007-08     602,261         87,952          690,213        1,879,329
2008-09     698,924        140,842          839,766        1,503,365
2009-10   1,706,404        447,599        2,154,003          413,832
2010-11   2,095,419        462,240        2,557,659          244,272
2011-12   1,972,266        615,787        2,588,053          178,572
Bluff View (EL,MS,JH)
Confluence of more pressures, new
   initiatives, growing expectations
• More challenges than almost any time in the
  history of public education in our nation.
• Greater accountability and assessments are
  converging on local school districts requiring
  attention and implementation.
  –   Educator and principal effectiveness
  –   “NAEPizing” of the WKCE
  –   New Student Information System
  –   Smarter Balance
  –   Public ratings and competition
Another New Accountability Era

This is the base year of the new
  School Report Cards (SRC)
    Still embargoed as only in draft format
        DPI will release later this month

      Next slides are not the report card
        The NAEP recalibrated scores
                  (base year)
SRC Student Achievement: All Data
         recalibrated to NAEP
  New higher Goals (NAEP adjusted)
Reading
  1. 60% Proficient and Advanced across all tested
     grades (we were meeting/closing on old goal 90%)
  2. Above State average across all tested grades
Math
  1. 60% Proficient and Advanced across all tested
     grades (we were meeting/closing on old goal 90%)
  2. Above State average across all tested grades
Math Proficient and Advanced
               NAEPized WKCE Data
60.0   PdC Public School Goal is to increase to 60% Adv + Prof across all grade levels
       Excellent improvement/trendline as we move through the grades
55.0
                                                                                 52.7
                                                                51.5

50.0                                           49.2
                              48.3


45.0
             42.8


40.0


35.0


30.0


25.0


20.0
            Grade 3          Grade 4         Grades 5,6       Grades 7,8       Grade 10
Reading Proficient and Advanced
             NAEPized WKCE Data
60.0
       PdC Public School Goal is to increase to 60% Adv + Prof across all grade levels
55.0


50.0
       Excellent improvement/trendline as we move through the grades             46.3

45.0


40.0

                                               35.1
35.0
                                                                32.9
                              30.6
30.0


25.0         24.3


20.0
            Grade 3          Grade 4         Grades 5,6       Grades 7,8       Grade 10
Math: PdC (blue) State (red)
54
                                                                                              52.7

52                                                                   51.5


50
                                       49.2

                     48.1                         48.1                         48.1                     48.1
48


46        45.5


44


42


40
     Bluff View Elem. School (3)   Bluff View Middle School   Bluff View Junior High School   PdC High School
Reading: PdC (blue) State (red)
50
                                                                                                       46.2
45


40
                      35.8                35.2       35.8                             35.8                       35.8
35                                                                         32.8

30
           27.3

25


20


15


10


 5


 0
     Bluff View Elem. School (11)   Bluff View Middle School (1)   Bluff View Junior High School (4)   PdC High School
SRC Student Growth (base year):
(2)

How much knowledge changes from
year to year.
    *Point credits for students
    moving to higher performance
    levels
    *Negative credit for students
    declining below proficiency.
SRC Closing Gaps (base year):
(3)

Need to lift all students – show
gaps are closing.
   *Students with disabilities
   *Economically disadvantaged
   students
School Report Card
        (4)

College and Career Ready Milestones
• Graduation Rate (high School)
• Attendance Rate
• Grade 3 Reading (elementary)
• Grade 8 Math (junior high)
• ACT participation and
  performance (high School)
              Note ACT may become hs test
Looking Forward: SRC
    Elementary Student Achievement
• Elementary increased reading/math expectations
  – Common Core (Quasi National Standards) Smarter Balanced test
  – State K Reading Test / Third grade Reading Test
• Readying for increased Elementary expectations
  – PK to grade 4 updated elementary math
  – Grade 1 piloting new reading series; possible study of that
    Reading adoption across the elementary
  – The Engineering is Elementary® (EiE) project
     • Fosters engineering and technological literacy
     • Research-based, standards-driven, and tested
     • Integrates engineering and technology concepts and skills with
       elementary science
Looking Forward: Report Card
         Middle Grades STEM
• Focus on Grade 8 Math Achievement
• Middle and Junior High Math updates
  – New grade 5 to 8 Math series under study for next
    year
• SRC Grade 8 Math Achievement is a breakout
  – Grade 8 Integrated Math 1 moving toward being
    the basil math
  – Grade 8 Algebra-Based-Physics being developed
Looking Forward
• College and Career Ready – All students
  educated to high level; not just a select few
• College/career ready work in High School
  – Advanced Placement level is new floor (adding)
  – Career Technical programming will need to be
    continuously updated
     • AG - added science level classes
     • Bus - added computer programming, looking at second
       class
     • FCE - added science level classes
     • Tech Ed - PLTW
Questions

Thank you for your support
     of your schools

2012.10.08 school board meeting

  • 1.
    School Board Meeting Finances School Start
  • 2.
    Year End June30,2012 • Strong fiscal condition $1,972,266 Fund 10 Cash Balance Operations basically break even • Fully funded OPEB $615,787 in Fund 73 • Fund 10 and Fund 73 reserve total $2,588,053
  • 3.
    YEAR CASH OPEB TRUST OPEB + CASH REFERENDUM 1992-93 1,115,611 1,115,611 1993-94 1,216,469 1,216,469 1994-95 1,554,729 1,554,729 1995-96 1,788,036 1,788,036 1996-97 1,651,133 1,651,133 1997-98 1,891,059 1,891,059 1998-99 1,956,870 1,956,870 1999-00 1,462,161 1,462,161 2000-01 1,193,772 1,193,772 2001-02 729,852 729,852 2002-03 190,561 190,561 2003-04 105,370 105,370 2004-05 60,390 35,000 95,390 2005-06 438,154 35,000 473,154 2006-07 566,891 35,000 601,891 916,942 2007-08 602,261 87,952 690,213 1,879,329 2008-09 698,924 140,842 839,766 1,503,365 2009-10 1,706,404 447,599 2,154,003 413,832 2010-11 2,095,419 462,240 2,557,659 244,272 2011-12 1,972,266 615,787 2,588,053 178,572
  • 5.
  • 6.
    Confluence of morepressures, new initiatives, growing expectations • More challenges than almost any time in the history of public education in our nation. • Greater accountability and assessments are converging on local school districts requiring attention and implementation. – Educator and principal effectiveness – “NAEPizing” of the WKCE – New Student Information System – Smarter Balance – Public ratings and competition
  • 7.
    Another New AccountabilityEra This is the base year of the new School Report Cards (SRC) Still embargoed as only in draft format DPI will release later this month Next slides are not the report card The NAEP recalibrated scores (base year)
  • 8.
    SRC Student Achievement:All Data recalibrated to NAEP New higher Goals (NAEP adjusted) Reading 1. 60% Proficient and Advanced across all tested grades (we were meeting/closing on old goal 90%) 2. Above State average across all tested grades Math 1. 60% Proficient and Advanced across all tested grades (we were meeting/closing on old goal 90%) 2. Above State average across all tested grades
  • 9.
    Math Proficient andAdvanced NAEPized WKCE Data 60.0 PdC Public School Goal is to increase to 60% Adv + Prof across all grade levels Excellent improvement/trendline as we move through the grades 55.0 52.7 51.5 50.0 49.2 48.3 45.0 42.8 40.0 35.0 30.0 25.0 20.0 Grade 3 Grade 4 Grades 5,6 Grades 7,8 Grade 10
  • 10.
    Reading Proficient andAdvanced NAEPized WKCE Data 60.0 PdC Public School Goal is to increase to 60% Adv + Prof across all grade levels 55.0 50.0 Excellent improvement/trendline as we move through the grades 46.3 45.0 40.0 35.1 35.0 32.9 30.6 30.0 25.0 24.3 20.0 Grade 3 Grade 4 Grades 5,6 Grades 7,8 Grade 10
  • 11.
    Math: PdC (blue)State (red) 54 52.7 52 51.5 50 49.2 48.1 48.1 48.1 48.1 48 46 45.5 44 42 40 Bluff View Elem. School (3) Bluff View Middle School Bluff View Junior High School PdC High School
  • 12.
    Reading: PdC (blue)State (red) 50 46.2 45 40 35.8 35.2 35.8 35.8 35.8 35 32.8 30 27.3 25 20 15 10 5 0 Bluff View Elem. School (11) Bluff View Middle School (1) Bluff View Junior High School (4) PdC High School
  • 13.
    SRC Student Growth(base year): (2) How much knowledge changes from year to year. *Point credits for students moving to higher performance levels *Negative credit for students declining below proficiency.
  • 14.
    SRC Closing Gaps(base year): (3) Need to lift all students – show gaps are closing. *Students with disabilities *Economically disadvantaged students
  • 15.
    School Report Card (4) College and Career Ready Milestones • Graduation Rate (high School) • Attendance Rate • Grade 3 Reading (elementary) • Grade 8 Math (junior high) • ACT participation and performance (high School) Note ACT may become hs test
  • 16.
    Looking Forward: SRC Elementary Student Achievement • Elementary increased reading/math expectations – Common Core (Quasi National Standards) Smarter Balanced test – State K Reading Test / Third grade Reading Test • Readying for increased Elementary expectations – PK to grade 4 updated elementary math – Grade 1 piloting new reading series; possible study of that Reading adoption across the elementary – The Engineering is Elementary® (EiE) project • Fosters engineering and technological literacy • Research-based, standards-driven, and tested • Integrates engineering and technology concepts and skills with elementary science
  • 17.
    Looking Forward: ReportCard Middle Grades STEM • Focus on Grade 8 Math Achievement • Middle and Junior High Math updates – New grade 5 to 8 Math series under study for next year • SRC Grade 8 Math Achievement is a breakout – Grade 8 Integrated Math 1 moving toward being the basil math – Grade 8 Algebra-Based-Physics being developed
  • 18.
    Looking Forward • Collegeand Career Ready – All students educated to high level; not just a select few • College/career ready work in High School – Advanced Placement level is new floor (adding) – Career Technical programming will need to be continuously updated • AG - added science level classes • Bus - added computer programming, looking at second class • FCE - added science level classes • Tech Ed - PLTW
  • 19.
    Questions Thank you foryour support of your schools