Jesse Ketchum Public School is located at Bay Street and Davenport Road near Yorkville Village. The school was established 179 years ago and the present building dates from 1914. The school is named after Jesse Ketchum, a philanthropist who donated the land to the School Board to build the school and to the city for the park.
The school serves almost 400 students, coming from all over the world and from all socio-economic groups. There are 40 different languages spoken in the homes of our students. At Jesse Ketchum our students build self-esteem and confidence, learn to work together in mutual respect and trust, and to value diversity.
EQAO ensures greater accountability and better quality in Ontario’s publicly funded school system. An arm’s-length agency of the provincial government, EQAO provides parents, teachers and the public with accurate and reliable information about student achievement. EQAO also makes recommendations for improvement that educators, parents, policy-makers and others in the education community can use to improve learning and teaching.
Rosedale Junior Public School Gr JK - 6 - EQAO School ReportEvanSage
Rosedale Junior Public School has been providing a high level of academics, artistic enrichment and community involvement for the children of Rosedale and nearby neighbourhoods for over a century. Founded in 1891, the kindergarten through grade six community school was re-constructed to its present location in 1957.
Our school's motto, "integrity and scholarship" is evidenced in our school's safe and nurturing environment. The parents, who are very involved with the schooling of their children, work closely with the staff in mutual advocacy for happy, healthy children who take pride in being independent learners, well-informed citizens and responsible leaders.
EQAO ensures greater accountability and better quality in Ontario’s publicly funded school system. An arm’s-length agency of the provincial government, EQAO provides parents, teachers and the public with accurate and reliable information about student achievement. EQAO also makes recommendations for improvement that educators, parents, policy-makers and others in the education community can use to improve learning and teaching.
Whitney Junior Public School Gr JK - 6 - EQAO School ReportEvanSage
Whitney is located in a well-established residential district in the Rosedale/Moore Park area. The first school was built in 1926 and the current building in 1964. Some parents and grandparents of our students also attended the school. In May 2001, we celebrated the school's 75th anniversary.
* The school population is approximately 315, and most students live in the school's catchment area.
* The school has a child care centre and an outstanding record of parental involvement.
* Staff and parents work together to support the School Improvement Plan initiatives and provide enrichment opportunities and experiences for the students.
EQAO ensures greater accountability and better quality in Ontario’s publicly funded school system. An arm’s-length agency of the provincial government, EQAO provides parents, teachers and the public with accurate and reliable information about student achievement. EQAO also makes recommendations for improvement that educators, parents, policy-makers and others in the education community can use to improve learning and teaching.
Brown Junior Public School - EQAO School ReportEvanSage
Brown school is situated on Avenue Road just south of St. Clair Avenue. The first school was built in 1910 and was replaced with a new building in 1972. Brown is celebrating its 100th anniversary in 2010. This is a special year for our school celebrating 100 years of excellence. For a century, Brown School has had a tradition of strong academic achievement and close relationships with our families and community. Our staff is a team of dedicated teachers and support staff who bring unique talents to our classrooms, along with many co-curricular activies. Each child is encouraged to strive for academic excellence while also adding balance to the day by pursuing an interest or talent from an extensive number of activities that are offered.
EQAO ensures greater accountability and better quality in Ontario’s publicly funded school system. An arm’s-length agency of the provincial government, EQAO provides parents, teachers and the public with accurate and reliable information about student achievement. EQAO also makes recommendations for improvement that educators, parents, policy-makers and others in the education community can use to improve learning and teaching.
Deer Park Junior and Senior Public School Gr JK - 8 - EQAO School ReportEvanSage
Deer Park Jr. & Sr. Public School is located at Ferndale Avenue, just east of Yonge Street and north of St. Clair Ave. Consisting of a three storey building, with classrooms dedicated to visual arts, design technology, science, family studies, music, drama and dance for Grades 7 & 8. The school hosts a gym and swimming pool enabling all students to benefit from a swim program as part of their physical education. Our facility houses two daycare centres for toddlers, pre-schoolers and school-age children.
EQAO ensures greater accountability and better quality in Ontario’s publicly funded school system. An arm’s-length agency of the provincial government, EQAO provides parents, teachers and the public with accurate and reliable information about student achievement. EQAO also makes recommendations for improvement that educators, parents, policy-makers and others in the education community can use to improve learning and teaching.
Cottingham Junior Public School Gr JK - 6 - EQAO School ReportEvanSage
Cottingham is committed to providing a learning environment that fully prepares children for successful living in a challenging world and that encourages self-directed problem solving and active participation. Teaching and learning focus on the acquisition and application of knowledge, attitudes, and skills. Evaluation consists of varied approaches; student progress is communicated to both parents and students. Expectations for achievement and work habits are high and consider individual differences.
EQAO ensures greater accountability and better quality in Ontario’s publicly funded school system. An arm’s-length agency of the provincial government, EQAO provides parents, teachers and the public with accurate and reliable information about student achievement. EQAO also makes recommendations for improvement that educators, parents, policy-makers and others in the education community can use to improve learning and teaching.
Brown Junior Public School - EQAO Board ReportEvanSage
Brown school is situated on Avenue Road just south of St. Clair Avenue. The first school was built in 1910 and was replaced with a new building in 1972. Brown is celebrating its 100th anniversary in 2010. This is a special year for our school celebrating 100 years of excellence. For a century, Brown School has had a tradition of strong academic achievement and close relationships with our families and community. Our staff is a team of dedicated teachers and support staff who bring unique talents to our classrooms, along with many co-curricular activies. Each child is encouraged to strive for academic excellence while also adding balance to the day by pursuing an interest or talent from an extensive number of activities that are offered.
EQAO ensures greater accountability and better quality in Ontario’s publicly funded school system. An arm’s-length agency of the provincial government, EQAO provides parents, teachers and the public with accurate and reliable information about student achievement. EQAO also makes recommendations for improvement that educators, parents, policy-makers and others in the education community can use to improve learning and teaching.
Jarvis Collegiate Institute Gr 9 - 12 - EQAO School ReportEvanSage
Jarvis Collegiate Institute is a high school located in downtown Toronto. Founded in 1807 during the frontier days of Upper Canada, it is the oldest secondary school in Toronto with over 200 years of tradition.
EQAO ensures greater accountability and better quality in Ontario’s publicly funded school system. An arm’s-length agency of the provincial government, EQAO provides parents, teachers and the public with accurate and reliable information about student achievement. EQAO also makes recommendations for improvement that educators, parents, policy-makers and others in the education community can use to improve learning and teaching.
Ace Maths Unit Five: Building assessment into teaching and learning (Word)PiLNAfrica
This unit explores outcomes-based assessment of mathematics in terms of five main questions – Why assess? (the purposes of assessment); What to assess? (achievement of outcomes, but also understanding, reasoning and problem-solving ability); How to assess? (methods, tools and techniques); How to interpret the results of assessment? (the importance of criteria and rubrics for outcomes-based assessment) ; and How to report on assessment? (developing meaningful report cards).
Cottingham Junior Public School Gr JK - 6 - EQAO Board ReportEvanSage
Cottingham is committed to providing a learning environment that fully prepares children for successful living in a challenging world and that encourages self-directed problem solving and active participation. Teaching and learning focus on the acquisition and application of knowledge, attitudes, and skills. Evaluation consists of varied approaches; student progress is communicated to both parents and students. Expectations for achievement and work habits are high and consider individual differences.
EQAO ensures greater accountability and better quality in Ontario’s publicly funded school system. An arm’s-length agency of the provincial government, EQAO provides parents, teachers and the public with accurate and reliable information about student achievement. EQAO also makes recommendations for improvement that educators, parents, policy-makers and others in the education community can use to improve learning and teaching.
Rosedale Junior Public School Gr JK - 6 - EQAO Board ReportEvanSage
Rosedale Junior Public School has been providing a high level of academics, artistic enrichment and community involvement for the children of Rosedale and nearby neighbourhoods for over a century. Founded in 1891, the kindergarten through grade six community school was re-constructed to its present location in 1957.
Our school's motto, "integrity and scholarship" is evidenced in our school's safe and nurturing environment. The parents, who are very involved with the schooling of their children, work closely with the staff in mutual advocacy for happy, healthy children who take pride in being independent learners, well-informed citizens and responsible leaders.
EQAO ensures greater accountability and better quality in Ontario’s publicly funded school system. An arm’s-length agency of the provincial government, EQAO provides parents, teachers and the public with accurate and reliable information about student achievement. EQAO also makes recommendations for improvement that educators, parents, policy-makers and others in the education community can use to improve learning and teaching.
Whitney is located in a well-established residential district in the Rosedale/Moore Park area. The first school was built in 1926 and the current building in 1964. Some parents and grandparents of our students also attended the school. In May 2001, we celebrated the school's 75th anniversary.
* The school population is approximately 315, and most students live in the school's catchment area.
* The school has a child care centre and an outstanding record of parental involvement.
* Staff and parents work together to support the School Improvement Plan initiatives and provide enrichment opportunities and experiences for the students.
EQAO ensures greater accountability and better quality in Ontario’s publicly funded school system. An arm’s-length agency of the provincial government, EQAO provides parents, teachers and the public with accurate and reliable information about student achievement. EQAO also makes recommendations for improvement that educators, parents, policy-makers and others in the education community can use to improve learning and teaching.
Deer Park Junior and Senior Public School Gr JK - 8 - EQAO Board ReportEvanSage
Deer Park Jr. & Sr. Public School is located at Ferndale Avenue, just east of Yonge Street and north of St. Clair Ave. Consisting of a three storey building, with classrooms dedicated to visual arts, design technology, science, family studies, music, drama and dance for Grades 7 & 8. The school hosts a gym and swimming pool enabling all students to benefit from a swim program as part of their physical education. Our facility houses two daycare centres for toddlers, pre-schoolers and school-age children.
EQAO ensures greater accountability and better quality in Ontario’s publicly funded school system. An arm’s-length agency of the provincial government, EQAO provides parents, teachers and the public with accurate and reliable information about student achievement. EQAO also makes recommendations for improvement that educators, parents, policy-makers and others in the education community can use to improve learning and teaching.
Jesse Ketchum Junior and Senior Public School Gr JK - 8 - EQAO Board ReportEvanSage
Jesse Ketchum Public School is located at Bay Street and Davenport Road near Yorkville Village. The school was established 179 years ago and the present building dates from 1914. The school is named after Jesse Ketchum, a philanthropist who donated the land to the School Board to build the school and to the city for the park.
The school serves almost 400 students, coming from all over the world and from all socio-economic groups. There are 40 different languages spoken in the homes of our students. At Jesse Ketchum our students build self-esteem and confidence, learn to work together in mutual respect and trust, and to value diversity.
EQAO ensures greater accountability and better quality in Ontario’s publicly funded school system. An arm’s-length agency of the provincial government, EQAO provides parents, teachers and the public with accurate and reliable information about student achievement. EQAO also makes recommendations for improvement that educators, parents, policy-makers and others in the education community can use to improve learning and teaching.
Jarvis Collegiate Institute Gr 9 - 12 - EQAO Board ReportEvanSage
Jarvis Collegiate Institute is a high school located in downtown Toronto. Founded in 1807 during the frontier days of Upper Canada, it is the oldest secondary school in Toronto with over 200 years of tradition.
EQAO ensures greater accountability and better quality in Ontario’s publicly funded school system. An arm’s-length agency of the provincial government, EQAO provides parents, teachers and the public with accurate and reliable information about student achievement. EQAO also makes recommendations for improvement that educators, parents, policy-makers and others in the education community can use to improve learning and teaching.
The data analysis in this presentation is based on the data from Smith Middle School 2007-2011 reading results. We will be comparing our schools data to the data of the district. This information is being presented to the school PTA so parents know where the students currently are academically compared to the district, administrations plans for improving academic growth, and how to plan to continue growing in the areas we are already showing academic growth.
The data analysis in this presentation is based on the data from Smith Middle School 2007-2011 reading results. We will be comparing our schools data to the data of the district. This information is being presented to the school PTA so parents know where the students currently are academically compared to the district, administrations plans for improving academic growth, and how to plan to continue growing in the areas we are already showing academic growth.
American Journal of Multidisciplinary Research and Development is indexed, refereed and peer-reviewed journal, which is designed to publish research articles.
American Journal of Multidisciplinary Research and Development is indexed, refereed and peer-reviewed journal, which is designed to publish research articles.
Lincolnton Middle School is one of the most diverse schools in the state with 33 indicators and 8 subgroups under NCLB. Come hear about how our school went from years of sanctions to finally meeting AYP two years in a row and achieving School of Distinction status last year.
Does early grading affect educational choices? To answer this question, I exploit a curriculum reform which postponed grade assignment in Swedish compulsory schools. The staggered implementation of the reform allows me to identify short- and long-term effects of early grading, for students with different academic ability and socioeconomic status (SES). When graded early on, high-ability students (especially if high-SES) exhibit higher grades in compulsory school, and are more likely to choose academic courses. Low-ability students react in the opposite way, with particularly negative reactions among low-SES students. High school attainment increases for high-ability low-SES students; college attainment decreases for low-ability low-SES students. None of these effects carry over to the labor market: early grading allows students to better sort into education early on. I show that the short-term effects are consistent with predictions from a learning model in which children are uncertain
about academic ability, have different priors depending on SES, and use grading information to re-optimize educational choices. I find no evidence of demotivating effects for low-ability students, an alternative mechanism through which grades might affect education choices, and the main motivation behind the grading reform.
637 Lake Shore Boulevard West PH14 - Tip-Top Lofts, Toronto - $579,000
One of the cities greatest examples of Art Deco Architecture, The Tip Top Lofts. This is the ultimate penthouse loft with a huge terrace for sunbathing, reading and entertaining. Ideal location for any executive who wants to feel a little space from the core, but still wants to be a few minutes from the action. A nice walk to the office, stroll to Liberty Village and King West or race to the ferry just before take off with Porter Air. The landscaped terrace has two walk outs and is finished with a Weber Genesis gas barbecue, landscaping and a Napoleon gas fireplace to cuddle up beside on those cooler fall evenings. The master has a south view over the Toronto Island and custom designed walk In dressing room with laundry and make-up vanity. The second bedroom has built ins to be fitted as an office with walk out to the landscaped terrace. It could easily be converted back to a second bedroom or nursery. The bathroom has a jet tub, walk in shower and is prepped for a steam unit. All of the furniture is available to be purchased if desired.
For more details visit http://Tip-TopLofts.com/
Presented By:
Evan Sage, Sales Representative
Sage Real Estate Ltd., Brokerage
Phone: (416)483-8000
Whitney Junior Public School Gr JK - 6 ProfileEvanSage
Whitney is located in a well-established residential district in the Rosedale/Moore Park area. The first school was built in 1926 and the current building in 1964. Some parents and grandparents of our students also attended the school. In May 2001, we celebrated the school's 75th anniversary.
* The school population is approximately 315, and most students live in the school's catchment area.
* The school has a child care centre and an outstanding record of parental involvement.
* Staff and parents work together to support the School Improvement Plan initiatives and provide enrichment opportunities and experiences for the students.
Rosedale Junior Public School Gr JK - 6 ProfileEvanSage
Rosedale Junior Public School has been providing a high level of academics, artistic enrichment and community involvement for the children of Rosedale and nearby neighbourhoods for over a century. Founded in 1891, the kindergarten through grade six community school was re-constructed to its present location in 1957.
Our school's motto, "integrity and scholarship" is evidenced in our school's safe and nurturing environment. The parents, who are very involved with the schooling of their children, work closely with the staff in mutual advocacy for happy, healthy children who take pride in being independent learners, well-informed citizens and responsible leaders.
Jesse Ketchum Junior and Senior Public School Gr JK - 8 ProfileEvanSage
Jesse Ketchum Public School is located at Bay Street and Davenport Road near Yorkville Village. The school was established 179 years ago and the present building dates from 1914. The school is named after Jesse Ketchum, a philanthropist who donated the land to the School Board to build the school and to the city for the park.
The school serves almost 400 students, coming from all over the world and from all socio-economic groups. There are 40 different languages spoken in the homes of our students. At Jesse Ketchum our students build self-esteem and confidence, learn to work together in mutual respect and trust, and to value diversity.
Jarvis Collegiate Institute Gr 9 - 12 ProfileEvanSage
Jarvis Collegiate Institute is a high school located in downtown Toronto. Founded in 1807 during the frontier days of Upper Canada, it is the oldest secondary school in Toronto with over 200 years of tradition.
Deer Park Junior and Senior Public School Gr JK - 8 ProfileEvanSage
Deer Park Jr. & Sr. Public School is located at Ferndale Avenue, just east of Yonge Street and north of St. Clair Ave. Consisting of a three storey building, with classrooms dedicated to visual arts, design technology, science, family studies, music, drama and dance for Grades 7 & 8. The school hosts a gym and swimming pool enabling all students to benefit from a swim program as part of their physical education. Our facility houses two daycare centres for toddlers, pre-schoolers and school-age children.
Cottingham Junior Public School Gr JK - 6 ProfileEvanSage
Cottingham is committed to providing a learning environment that fully prepares children for successful living in a challenging world and that encourages self-directed problem solving and active participation. Teaching and learning focus on the acquisition and application of knowledge, attitudes, and skills. Evaluation consists of varied approaches; student progress is communicated to both parents and students. Expectations for achievement and work habits are high and consider individual differences.
Brown school is situated on Avenue Road just south of St. Clair Avenue. The first school was built in 1910 and was replaced with a new building in 1972. Brown is celebrating its 100th anniversary in 2010. This is a special year for our school celebrating 100 years of excellence. For a century, Brown School has had a tradition of strong academic achievement and close relationships with our families and community. Our staff is a team of dedicated teachers and support staff who bring unique talents to our classrooms, along with many co-curricular activies. Each child is encouraged to strive for academic excellence while also adding balance to the day by pursuing an interest or talent from an extensive number of activities that are offered.
Synthetic Fiber Construction in lab .pptxPavel ( NSTU)
Synthetic fiber production is a fascinating and complex field that blends chemistry, engineering, and environmental science. By understanding these aspects, students can gain a comprehensive view of synthetic fiber production, its impact on society and the environment, and the potential for future innovations. Synthetic fibers play a crucial role in modern society, impacting various aspects of daily life, industry, and the environment. ynthetic fibers are integral to modern life, offering a range of benefits from cost-effectiveness and versatility to innovative applications and performance characteristics. While they pose environmental challenges, ongoing research and development aim to create more sustainable and eco-friendly alternatives. Understanding the importance of synthetic fibers helps in appreciating their role in the economy, industry, and daily life, while also emphasizing the need for sustainable practices and innovation.
Embracing GenAI - A Strategic ImperativePeter Windle
Artificial Intelligence (AI) technologies such as Generative AI, Image Generators and Large Language Models have had a dramatic impact on teaching, learning and assessment over the past 18 months. The most immediate threat AI posed was to Academic Integrity with Higher Education Institutes (HEIs) focusing their efforts on combating the use of GenAI in assessment. Guidelines were developed for staff and students, policies put in place too. Innovative educators have forged paths in the use of Generative AI for teaching, learning and assessments leading to pockets of transformation springing up across HEIs, often with little or no top-down guidance, support or direction.
This Gasta posits a strategic approach to integrating AI into HEIs to prepare staff, students and the curriculum for an evolving world and workplace. We will highlight the advantages of working with these technologies beyond the realm of teaching, learning and assessment by considering prompt engineering skills, industry impact, curriculum changes, and the need for staff upskilling. In contrast, not engaging strategically with Generative AI poses risks, including falling behind peers, missed opportunities and failing to ensure our graduates remain employable. The rapid evolution of AI technologies necessitates a proactive and strategic approach if we are to remain relevant.
2024.06.01 Introducing a competency framework for languag learning materials ...Sandy Millin
http://sandymillin.wordpress.com/iateflwebinar2024
Published classroom materials form the basis of syllabuses, drive teacher professional development, and have a potentially huge influence on learners, teachers and education systems. All teachers also create their own materials, whether a few sentences on a blackboard, a highly-structured fully-realised online course, or anything in between. Despite this, the knowledge and skills needed to create effective language learning materials are rarely part of teacher training, and are mostly learnt by trial and error.
Knowledge and skills frameworks, generally called competency frameworks, for ELT teachers, trainers and managers have existed for a few years now. However, until I created one for my MA dissertation, there wasn’t one drawing together what we need to know and do to be able to effectively produce language learning materials.
This webinar will introduce you to my framework, highlighting the key competencies I identified from my research. It will also show how anybody involved in language teaching (any language, not just English!), teacher training, managing schools or developing language learning materials can benefit from using the framework.
Introduction to AI for Nonprofits with Tapp NetworkTechSoup
Dive into the world of AI! Experts Jon Hill and Tareq Monaur will guide you through AI's role in enhancing nonprofit websites and basic marketing strategies, making it easy to understand and apply.
Instructions for Submissions thorugh G- Classroom.pptxJheel Barad
This presentation provides a briefing on how to upload submissions and documents in Google Classroom. It was prepared as part of an orientation for new Sainik School in-service teacher trainees. As a training officer, my goal is to ensure that you are comfortable and proficient with this essential tool for managing assignments and fostering student engagement.
Biological screening of herbal drugs: Introduction and Need for
Phyto-Pharmacological Screening, New Strategies for evaluating
Natural Products, In vitro evaluation techniques for Antioxidants, Antimicrobial and Anticancer drugs. In vivo evaluation techniques
for Anti-inflammatory, Antiulcer, Anticancer, Wound healing, Antidiabetic, Hepatoprotective, Cardio protective, Diuretics and
Antifertility, Toxicity studies as per OECD guidelines
How to Make a Field invisible in Odoo 17Celine George
It is possible to hide or invisible some fields in odoo. Commonly using “invisible” attribute in the field definition to invisible the fields. This slide will show how to make a field invisible in odoo 17.
Jesse Ketchum Junior and Senior Public School Gr JK - 8 - EQAO School Report
1. School Report Jesse Ketchum Jr & Sr PS (282693)
School Report
Assessments of Reading, Writing and Mathematics
Primary Division (Grades 1–3) and Junior Division (Grades 4–6), 2008–2009
School: Jesse Ketchum Jr & Sr PS (282693)
Board: Toronto DSB (66052)
WHERE TO FIND . . . PAGE
Grade 3 Grade 6
I am pleased to provide you with this report on the Percentages of all students at or above the provincial standard:
Assessments of Reading, Writing and Mathematics, Primary · 2008–2009 .................................................................. 1 1
· Over time .................................................................... 2 3
Division (Grades 1–3) and Junior Division (Grades 4–6), for
2008–2009. Included are student results for the current year, Tips for using this report ................................................................ 4 4
those from previous years and, to put these results in Contextual information: 2008–2009 ............................................... 5 9
context, information about the local student populations.
Results for groups of students: 2008–2009
· All students ............................................................... 6 10
Throughout the province and since the inception of the · Participating students .............................................. 7 11
agency, EQAO results have helped inform professional · Students by gender................................................... 8 12
practice and have served as a catalyst for improving student Contextual information: Over time ............................................... 13 17
achievement. This report has been designed to assist you in Results for all students: Over time ............................................... 14–16 18–20
your conversations about improved student learning. Results for all students: Over time by gender.............................. 21 22
Student questionnaire results ....................................................... 23–26 27–30
We believe that every student deserves the best outcome
Explanation of terms ...................................................................... 31 31
from public education. That’s why, in close collaboration
with Ontario educators, EQAO continues to develop
assessments that gauge the achievement of all Ontario
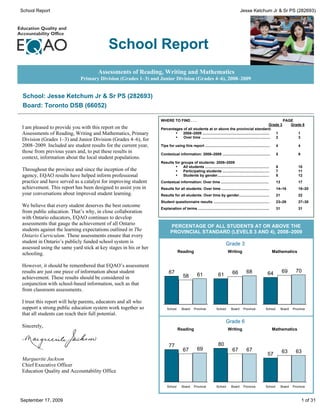
PERCENTAGE OF ALL STUDENTS AT OR ABOVE THE
students against the learning expectations outlined in The PROVINCIAL STANDARD (LEVELS 3 AND 4), 2008–2009
Ontario Curriculum. These assessments ensure that every
student in Ontario’s publicly funded school system is Grade 3
assessed using the same yard stick at key stages in his or her
Reading Writing Mathematics
schooling.
However, it should be remembered that EQAO’s assessment
results are just one piece of information about student 67 66 68 64 69 70
58 61 61
achievement. These results should be considered in
conjunction with school-based information, such as that
from classroom assessments.
I trust this report will help parents, educators and all who
support a strong public education system work together so School Board Province School Board Province School Board Province
that all students can reach their full potential.
Grade 6
Sincerely,
Reading Writing Mathematics
77 80
67 69 67 67 63 63
57
Marguerite Jackson
Chief Executive Officer
Education Quality and Accountability Office
School Board Province School Board Province School Board Province
September 17, 2009 1 of 31
2. School Report Jesse Ketchum Jr & Sr PS (282693)
RESULTS FOR ALL STUDENTS AT OR ABOVE THE PROVINCIAL STANDARD (LEVELS 3 AND 4) OVER TIME
Percentage of Students: Grade 3
Reading Writing Mathematics
81
67 69 67 71 69
66 64
61
50 53 50 48 47
SCHOOL 39
66 65 66 66 67 69
61 64 64 64
56 59 57 57 58
BOARD
66 68 66 68 69 68 70
62 62 61 61 61 64 64
59
PROVINCE
2004–2005 2005–2006 2006–2007 2007–2008 2008–2009
Total Number of Grade 3 Students
2004–2005 2005–2006 2006–2007 2007–2008 2008–2009
School 45 32 48 36 33
Board 19 094 18 401 17 813 17 210 17 392
Province 135 740 132 782 131 012 128 660 125 481
September 17, 2009 2 of 31
3. School Report Jesse Ketchum Jr & Sr PS (282693)
RESULTS FOR ALL STUDENTS AT OR ABOVE THE PROVINCIAL STANDARD (LEVELS 3 AND 4) OVER TIME
Percentage of Students: Grade 6
Reading Writing Mathematics
84 81 80
75 77
67 71 67 71
58 61 58 57
56
50
SCHOOL
63 63 67 66 67 63
61 61 59 61 61 62 60 59 60
BOARD
66 69 67 67
63 64 64 61 61 60 61 61 63
59 59
PROVINCE
2004–2005 2005–2006 2006-2007 2007-2008 2008-2009
Total Number of Grade 6 Students
2004–2005 2005–2006 2006–2007 2007–2008 2008–2009
School 42 31 32 36 30
Board 18 492 19 238 19 086 18 355 17 552
Province 143 421 146 711 145 901 140 420 136 076
September 17, 2009 3 of 31
4. School Report Jesse Ketchum Jr & Sr PS (282693)
TIPS ABOUT THIS SCHOOL OR BOARD REPORT
Each school or board is This report shows how well students have met curriculum expectations to the end of the
unique. To appreciate the Primary Division and the end of the Junior Division. Students complete a set of test
distinctive character of a booklets that allow them to show what they have learned in reading, writing and
school or board, look at the mathematics. The assessments are based on The Ontario Curriculum.
contextual information to
understand the features and
characteristics of the This report includes
community it serves. ¨ results for this year
– ¨ a comparison of results over the past four years to aid in monitoring
improvement
Every assessment captures ¨ information about the characteristics of the students who participated
the performance of students
at one point in time each ¨ summary graphs showing the percentage of students achieving the provincial
year. Consider the results standard in reading, writing and mathematics
along with other information ¨ detailed tables and graphs showing results for all levels of achievement, results
about students’ achievement
in reading, writing and
for gender and participation information
mathematics. ¨ student questionnaire results
¨ an explanation of all terms used in this report.
–
Exercise caution when
interpreting results for small HOW TO USE THIS REPORT
schools or boards. Results
may vary considerably from ¨ Examine the contextual information to understand the similarities and differences
year to year, and differences between the school, the board and the province; the board and the province.
may look exaggerated. For Consider the challenges that any differences might present.
example, in a school of 20
students, a difference of 10% ¨ Examine the results for reading, writing and mathematics.
represents only two students. · Are these results consistent with what you would expect?
· How do the school results compare to the board and the province; the board
– results compare to the province?
· How do these results compare over time?
Trends may be difficult to
identify or to interpret. This is · What influence might students’ attitudes have on student performance (refer
especially true in small
schools or boards, or in to the questionnaire results)?
schools where there is a high ¨ Speak to school or board staff about the goals for school improvement related to
turnover in the student reading, writing and mathematics.
population.
–
EQAO values students’
privacy. Results are not
reported publicly for schools
where fewer than 15
students participated,
because it might be possible The Education Quality and Accountability Office is an independent agency that gathers information
to identify individual about student achievement through province-wide assessments. Each year, all Grade 3 and Grade 6
students across Ontario take part in these assessments of reading, writing and mathematics.
students. Individual results are reported to students and to parents and guardians. School, board and provincial
results are released publicly.
Learn more about us at www.eqao.com.
September 17, 2009 4 of 31
5. School Report Jesse Ketchum Jr & Sr PS (282693)
Assessments of Reading, Writing and Mathematics, Primary and Junior Divisions, 2008–2009
Contextual Information: Grade 3*
This information provides a context for interpreting the school’s results.
Demographic Information School Board Province
Enrolment
Number of Grade 3 students 33 17 392 125 481
Number of classes with Grade 3 students 3 1 578 9 385
Number of schools with Grade 3 classes Not applicable 400 3 399
Number Percent Number Percent Number Percent
Gender
Female 19 58% 8 453 49% 60 999 49%
Male 14 42% 8 939 51% 64 482 51%
Gender not specified 0 0% 0 0% 0 0%
Student Status
English language learners** 0 0% 670 4% 11 281 9%
Students with special needs (excluding gifted)** 3 9% 3 193 18% 18 291 15%
Place of Birth
Born in Canada 21 64% 13 419 77% 111 561 89%
Born outside Canada 12 36% 3 959 23% 13 717 11%
In Canada less than one year 0 0% 152 1% 804 1%
In Canada one year or more but less than three years 5 15% 835 5% 2 893 2%
In Canada three years or more 7 21% 2 403 14% 8 946 7%
Language
First language learned at home was other than English 23 70% 8 230 47% 27 084 22%
Year Student Entered Current School
Year of the assessment 6 18% 2 274 13% 16 746 13%
Year prior to the assessment 8 24% 2 174 12% 14 545 12%
2 years prior to the assessment 3 9% 2 289 13% 16 821 13%
3 or more years prior to the assessment 16 48% 10 607 61% 76 849 61%
Data not available 0 0% 48 <1% 520 <1%
Year Student Entered Current Board
Year of the assessment 4 12% 1 140 7% 8 720 7%
Year prior to the assessment 6 18% 1 193 7% 8 048 6%
2 years prior to the assessment 1 3% 1 480 9% 11 982 10%
3 or more years prior to the assessment 22 67% 13 467 77% 93 098 74%
Data not available 0 0% 112 1% 3 633 3%
* Contextual data pertaining to gender, student status, place of birth, language learned at home and year entered school and board are provided by schools and/or boards
through the Student Data Collection process. Some data may be missing because they were not provided by the school or the board.
** See the Explanation of Terms.
September 17, 2009 5 of 31
6. School Report Jesse Ketchum Jr & Sr PS (282693)
Results in Reading, Writing and Mathematics, 2008–2009
Grade 3: All Students††
Grade 3: Reading* Percentage of All Grade 3 Students at All Levels: Reading*
School Board Province
Number of Students 33 16 062 121 787
# % % %
Level 4 2 6% 8% 7%
Level 3 20 61% 50% 53%
61
Level 2 4 12% 24% 26% 50 53
Level 1 3 9% 8% 7%
NE1** 0 0% 2% 2% 24 26
Participating 9 8 12 8
29 88% 92% 95% 7 6 7
Students 0 2 2
No Data 1 3% 2% 1%
NE1 Level 1 Level 2 Level 3 Level 4
Exempt 3 9% 6% 4%
At or Above School Board Province
Provincial Standard 67% 58% 61%
(Levels 3 and 4) †
Grade 3: Writing* Percentage of All Grade 3 Students at All Levels: Writing*
School Board Province
Number of Students 33 16 062 121 788
# % % %
Level 4 1 3% 5% 4%
Level 3 19 58% 61% 63% 63
58 61
Level 2 9 27% 26% 28%
Level 1 0 0% <1% <1%
NE1** 0 0% <1% <1% 27 26 28
Participating
29 88% 92% 96% 5 4
Students 0 <1 <1 0 <1 <1 3
No Data 1 3% 2% 1%
NE1 Level 1 Level 2 Level 3 Level 4
Exempt 3 9% 6% 3%
At or Above School Board Province
Provincial Standard 61% 66% 68%
(Levels 3 and 4) †
Grade 3: Mathematics* Percentage of All Grade 3 Students at All Levels: Mathematics*
School Board Province
Number of Students 33 17 388 125 464
# % % %
Level 4 6 18% 16% 12%
Level 3 15 45% 53% 58%
58
Level 2 7 21% 21% 23% 53
45
Level 1 1 3% 2% 2%
NE1** 0 0% <1% <1% 23
21 21 18
Participating 16 12
29 88% 93% 96%
Students 0 <1 <1 3 2 2
No Data 1 3% 2% 1%
NE1 Level 1 Level 2 Level 3 Level 4
Exempt 3 9% 5% 3%
At or Above School Board Province
Provincial Standard 64% 69% 70%
(Levels 3 and 4) †
* Because percentages in tables and graphs are rounded, and because graphs do not show all reporting categories, percentages may not add to 100.
** See the Explanation of Terms.
† These percentages are based on the actual number of students and cannot be calculated simply by adding the rounded percentages of students at Levels 3 and 4.
†† Some French Immersion students do not write all components of the assessment in Grade 3; the numbers shown reflect those students who were expected to write
each component as determined by the French Immersion participation option selected by boards.
September 17, 2009 6 of 31
7. School Report Jesse Ketchum Jr & Sr PS (282693)
Results in Reading, Writing and Mathematics, 2008–2009
Grade 3: Participating Students (excludes “no data” and “exempt” categories)
Grade 3: Reading* Percentage of Participating Grade 3 Students at All Levels: Reading*
School Board Province
Number of Students 29 14 761 116 256
# % % %
Level 4 2 7% 9% 7%
Level 3 20 69% 54% 56% 69
Level 2 4 14% 27% 27% 54 56
Level 1 3 10% 8% 8%
NE1** 0 0% 2% 2% 27 27
At or Above 10 14
8 8 7 9 7
Provincial Standard 76% 63% 63% 0 2 2
(Levels 3 and 4) †
NE1 Level 1 Level 2 Level 3 Level 4
School Board Province
Grade 3: Writing* Percentage of Participating Grade 3 Students at All Levels: Writing*
School Board Province
Number of Students 29 14 817 116 812
# % % %
Level 4 1 3% 6% 5%
Level 3 19 66% 66% 66% 66 66 66
Level 2 9 31% 28% 29%
Level 1 0 0% <1% <1%
31 28 29
NE1** 0 0% <1% <1%
At or Above
69% 71% 71% 3 6 5
Provincial Standard 0 <1 <1 0 <1 <1
(Levels 3 and 4) †
NE1 Level 1 Level 2 Level 3 Level 4
School Board Province
Grade 3: Mathematics* Percentage of Participating Grade 3 Students at All Levels: Mathematics*
School Board Province
Number of Students 29 16 183 120 405
# % % %
Level 4 6 21% 17% 13%
Level 3 15 52% 57% 60%
57 60
Level 2 7 24% 23% 24% 52
Level 1 1 3% 2% 2%
NE1** 0 0% <1% <1% 24 23 24 21 17
At or Above 13
Provincial Standard 72% 74% 73% 0 <1 <1 3 2 2
(Levels 3 and 4) †
NE1 Level 1 Level 2 Level 3 Level 4
School Board Province
* Because percentages in tables and graphs are rounded, percentages may not add to 100.
** See the Explanation of Terms.
† These percentages are based on the actual number of students and cannot be calculated simply by adding the rounded percentages of students at Levels 3 and 4.
September 17, 2009 7 of 31
8. School Report Jesse Ketchum Jr & Sr PS (282693)
Results in Reading, Writing and Mathematics, 2008–2009
Grade 3: Gender††
Grade 3: School* Percentage of All Grade 3 Students
Reading Writing Mathematics at or Above Provincial Standard: School†
Female Male Female Male Female Male
Number of Students Reading Writing Mathematics
N/R N/R N/R N/R N/R N/R
Level 4 N/R N/R N/R N/R N/R N/R
Level 3 N/R N/R N/R N/R N/R N/R
Level 2 N/R N/R N/R N/R N/R N/R
Level 1 N/R N/R N/R N/R N/R N/R
NE1** N/R N/R N/R N/R N/R N/R
Participating
N/R N/R N/R N/R N/R N/R
Students
N/R N/R N/R N/R N/R N/R
No Data N/R N/R N/R N/R N/R N/R
Exempt N/R N/R N/R N/R N/R N/R
At or Above Female Male
Provincial Standard N/R N/R N/R N/R N/R N/R
(Levels 3 and 4)†
Grade 3: Board* Percentage of All Grade 3 Students
Reading Writing Mathematics at or Above Provincial Standard: Board†
Female Male Female Male Female Male
Number of Students 7 722 Reading Writing Mathematics
8 340 7 722 8 340 8 450 8 938
Level 4 10% 6% 7% 3% 16% 16%
Level 3 53% 47% 65% 56% 55% 52%
73 71
Level 2 22% 26% 21% 31% 21% 22% 63 67
59
Level 1 7% 8% <1% <1% 2% 2% 53
NE1** 2% 3% <1% <1% <1% 1%
Participating
94% 90% 94% 91% 95% 92%
Students
No Data 2% 2% 2% 2% 2% 2%
Exempt 5% 8% 4% 7% 4% 7%
At or Above Female Male
Provincial Standard 63% 53% 73% 59% 71% 67%
(Levels 3 and 4)†
Grade 3: Province* Percentage of All Grade 3 Students
Reading Writing Mathematics at or Above Provincial Standard: Province†
Female Male Female Male Female Male
Number of Students 58 888 Reading Writing Mathematics
62 899 58 889 62 899 60 985 64 479
Level 4 9% 5% 6% 3% 12% 12%
Level 3 56% 51% 69% 58% 59% 56%
75 72
Level 2 24% 28% 22% 34% 23% 24% 65 69
61
56
Level 1 6% 8% <1% <1% 2% 2%
NE1** 1% 2% <1% <1% <1% <1%
Participating
97% 94% 97% 95% 97% 95%
Students
No Data 1% 1% 1% 1% 1% 1%
Exempt 3% 5% 2% 4% 2% 4%
At or Above Female Male
Provincial Standard 65% 56% 75% 61% 72% 69%
(Levels 3 and 4)†
* Because percentages in tables are rounded, percentages may not add to 100.
** See the Explanation of Terms.
† These percentages are based on the actual number of students and cannot be calculated simply by adding the rounded percentages of students at Levels 3 and 4.
†† Results include only students for whom gender data were available.
September 17, 2009 8 of 31
9. School Report Jesse Ketchum Jr & Sr PS (282693)
Assessments of Reading, Writing and Mathematics, Primary and Junior Divisions, 2008–2009
Contextual Information: Grade 6*
This information provides a context for interpreting the school’s results.
Demographic Information School Board Province
Enrolment
Number of Grade 6 students 30 17 552 136 076
Number of classes with Grade 6 students 2 1 308 8 285
Number of schools with Grade 6 classes Not applicable 330 3 216
Number Percent Number Percent Number Percent
Gender
Female 17 57% 8 545 49% 66 276 49%
Male 13 43% 9 007 51% 69 800 51%
Gender not specified 0 0% 0 0% 0 0%
Student Status
English language learners** 0 0% 651 4% 7 538 6%
Students with special needs (excluding gifted)** 3 10% 3 601 21% 24 326 18%
Place of Birth
Born in Canada 21 70% 12 613 72% 118 305 87%
Born outside Canada 9 30% 4 931 28% 17 592 13%
In Canada less than one year 0 0% 147 1% 768 1%
In Canada one year or more but less than three years 3 10% 873 5% 2 991 2%
In Canada three years or more 6 20% 3 382 19% 12 798 9%
Language
First language learned at home was other than English 12 40% 8 609 49% 27 824 20%
Year Student Entered Current School
Year of the assessment 10 33% 6 519 37% 30 253 22%
Year prior to the assessment 1 3% 1 370 8% 13 485 10%
2 years prior to the assessment 3 10% 1 637 9% 12 503 9%
3 or more years prior to the assessment 16 53% 7 996 46% 79 176 58%
Data not available 0 0% 30 <1% 659 <1%
Year Student Entered Current Board
Year of the assessment 6 20% 1 053 6% 9 175 7%
Year prior to the assessment 1 3% 995 6% 7 907 6%
2 years prior to the assessment 2 7% 974 6% 7 896 6%
3 or more years prior to the assessment 21 70% 14 401 82% 105 510 78%
Data not available 0 0% 129 1% 5 588 4%
* Contextual data pertaining to gender, student status, place of birth, language learned at home and year entered school and board are provided by schools and/or boards
through the Student Data Collection process. Some data may be missing because they were not provided by the school or the board.
** See the Explanation of Terms.
September 17, 2009 9 of 31
10. School Report Jesse Ketchum Jr & Sr PS (282693)
Results in Reading, Writing and Mathematics, 2008–2009
Grade 6: All Students
Grade 6: Reading* Percentage of All Grade 6 Students at All Levels: Reading*
School Board Province
Number of Students 30 17 546 136 069
# % % %
Level 4 4 13% 12% 11%
Level 3 19 63% 55% 59% 63
55 59
Level 2 3 10% 20% 22%
Level 1 0 0% 6% 5%
NE1** 1 3% 1% <1% 22
20
Participating 10 13 12 11
27 90% 94% 96% 6 5
Students 3 1 <1 0
No Data 3 10% 1% 1%
NE1 Level 1 Level 2 Level 3 Level 4
Exempt 0 0% 5% 3%
At or Above School Board Province
Provincial Standard 77% 67% 69%
(Levels 3 and 4) †
Grade 6: Writing* Percentage of All Grade 6 Students at All Levels: Writing*
School Board Province
Number of Students 30 17 546 136 075
# % % %
Level 4 6 20% 11% 9%
Level 3 18 60% 56% 58%
60 56 58
Level 2 2 7% 26% 29%
Level 1 1 3% 1% <1%
NE1** 0 0% <1% <1% 26 29
20
Participating 11 9
27 90% 94% 96% 7
Students 0 <1 <1 3 1 <1
No Data 3 10% 1% 1%
NE1 Level 1 Level 2 Level 3 Level 4
Exempt 0 0% 5% 3%
At or Above School Board Province
Provincial Standard 80% 67% 67%
(Levels 3 and 4) †
Grade 6: Mathematics* Percentage of All Grade 6 Students at All Levels: Mathematics*
School Board Province
Number of Students 30 17 535 136 075
# % % %
Level 4 3 10% 17% 13%
Level 3 14 47% 46% 49%
Level 2 8 27% 23% 27% 49
47 46
Level 1 1 3% 7% 6%
NE1** 0 0% 1% <1% 27 23 27
17 13
Participating 10
26 87% 94% 96% 7 6
Students 0 1 <1 3
No Data 4 13% 1% 1%
NE1 Level 1 Level 2 Level 3 Level 4
Exempt 0 0% 5% 3%
At or Above School Board Province
Provincial Standard 57% 63% 63%
(Levels 3 and 4) †
* Because percentages in tables and graphs are rounded, and because graphs do not show all reporting categories, percentages may not add to 100.
** See the Explanation of Terms.
† These percentages are based on the actual number of students and cannot be calculated simply by adding the rounded percentages of students at Levels 3 and 4.
September 17, 2009 10 of 31
11. School Report Jesse Ketchum Jr & Sr PS (282693)
Results in Reading, Writing and Mathematics, 2008–2009
Grade 6: Participating Students (excludes “no data” and “exempt” categories)
Grade 6: Reading* Percentage of Participating Grade 6 Students at All Levels: Reading*
School Board Province
Number of Students 27 16 527 131 173
# % % %
Level 4 4 15% 13% 11%
Level 3 19 70% 58% 61% 70
58 61
Level 2 3 11% 22% 22%
Level 1 0 0% 6% 5%
NE1** 1 4% 1% 1% 22 22
11 15 13 11
At or Above
85% 71% 72% 4 6 5
Provincial Standard 1 1 0
(Levels 3 and 4) †
NE1 Level 1 Level 2 Level 3 Level 4
School Board Province
Grade 6: Writing* Percentage of Participating Grade 6 Students at All Levels: Writing*
School Board Province
Number of Students 27 16 538 131 296
# % % %
Level 4 6 22% 12% 9%
Level 3 18 67% 60% 61% 67
60 61
Level 2 2 7% 27% 30%
Level 1 1 4% 1% <1%
27 30
NE1** 0 0% <1% <1% 22
At or Above 12 9
4 7
Provincial Standard 89% 72% 70% 0 <1 <1 1 <1
(Levels 3 and 4) †
NE1 Level 1 Level 2 Level 3 Level 4
School Board Province
Grade 6: Mathematics* Percentage of Participating Grade 6 Students at All Levels: Mathematics*
School Board Province
Number of Students 26 16 509 130 902
# % % %
Level 4 3 12% 18% 14%
Level 3 14 54% 49% 51%
Level 2 8 31% 25% 28% 54 51
49
Level 1 1 4% 7% 7%
31 28
NE1** 0 0% 1% <1% 25
18 14
At or Above 12
4 7 7
Provincial Standard 65% 67% 65% 0 1 <1
(Levels 3 and 4) †
NE1 Level 1 Level 2 Level 3 Level 4
School Board Province
* Because percentages in tables and graphs are rounded, percentages may not add to 100.
** See the Explanation of Terms.
† These percentages are based on the actual number of students and cannot be calculated simply by adding the rounded percentages of students at Levels 3 and 4.
September 17, 2009 11 of 31
12. School Report Jesse Ketchum Jr & Sr PS (282693)
Results in Reading, Writing and Mathematics, 2008–2009
Grade 6: Gender††
Grade 6: School* Percentage of All Grade 6 Students
Reading Writing Mathematics at or Above Provincial Standard: School†
Female Male Female Male Female Male
Number of Students Reading Writing Mathematics
N/R N/R N/R N/R N/R N/R
Level 4 N/R N/R N/R N/R N/R N/R
Level 3 N/R N/R N/R N/R N/R N/R
Level 2 N/R N/R N/R N/R N/R N/R
Level 1 N/R N/R N/R N/R N/R N/R
NE1** N/R N/R N/R N/R N/R N/R
Participating
N/R N/R N/R N/R N/R N/R
Students
N/R N/R N/R N/R N/R N/R
No Data N/R N/R N/R N/R N/R N/R
Exempt N/R N/R N/R N/R N/R N/R
At or Above Female Male
Provincial Standard N/R N/R N/R N/R N/R N/R
(Levels 3 and 4)†
Grade 6: Board* Percentage of All Grade 6 Students
Reading Writing Mathematics at or Above Provincial Standard: Board†
Female Male Female Male Female Male
Number of Students 8 545 Reading Writing Mathematics
9 001 8 545 9 001 8 533 9 002
Level 4 16% 9% 16% 7% 17% 18%
Level 3 57% 53% 61% 52% 49% 44% 77
73
Level 2 19% 22% 19% 33% 24% 23% 62 66 62
59
Level 1 4% 7% <1% 1% 6% 7%
NE1** 1% 1% <1% <1% <1% 1%
Participating
96% 93% 96% 93% 96% 93%
Students
No Data 1% 1% 1% 1% 1% 1%
Exempt 3% 6% 3% 6% 3% 6%
At or Above Female Male
Provincial Standard 73% 62% 77% 59% 66% 62%
(Levels 3 and 4)†
Grade 6: Province* Percentage of All Grade 6 Students
Reading Writing Mathematics at or Above Provincial Standard: Province†
Female Male Female Male Female Male
Number of Students 66 270 Reading Writing Mathematics
69 799 66 275 69 800 66 275 69 800
Level 4 14% 8% 13% 5% 13% 13%
Level 3 61% 57% 65% 52% 52% 47% 78
75
Level 2 19% 24% 20% 37% 27% 27% 64 64
57 61
Level 1 4% 6% <1% 1% 5% 7%
NE1** <1% 1% <1% <1% <1% <1%
Participating
97% 96% 97% 96% 97% 95%
Students
No Data 1% 1% 1% 1% 1% 1%
Exempt 2% 4% 2% 4% 2% 4%
At or Above Female Male
Provincial Standard 75% 64% 78% 57% 64% 61%
(Levels 3 and 4)†
* Because percentages in tables are rounded, percentages may not add to 100.
** See the Explanation of Terms.
† These percentages are based on the actual number of students and cannot be calculated simply by adding the rounded percentages of students at Levels 3 and 4.
†† Results include only students for whom gender data were available.
September 17, 2009 12 of 31
13. School Report Jesse Ketchum Jr & Sr PS (282693)
Assessments of Reading, Writing and Mathematics, Primary and Junior Divisions, 2008–2009
Contextual Information over Time: Grade 3*
This information provides a context for interpreting the school’s results over the past five years.
Grade 3 2004–2005 2005–2006 2006–2007 2007–2008 2008–2009
Enrolment
Number of students 45 32 48 36 33
Participation in the Assessment
Reading† 87% 91% 90% 94% 88%
Writing† 87% 91% 90% 81% 88%
Mathematics† 87% 94% 94% 92% 88%
Gender
Female 56% 38% 42% 39% 58%
Male 38% 62% 58% 61% 42%
Student Status
English language learners** 13% 0% 0% 0% 0%
Students with special needs (excluding gifted)** 13% 0% 10% 14% 9%
Place of Birth
Born in Canada 51% 72% 69% 75% 64%
Born outside Canada 40% 25% 31% 25% 36%
In Canada less than one year 7% 6% 2% 0% 0%
In Canada one year or more but less than three years 9% 6% 6% 3% 15%
In Canada three years or more 24% 12% 17% 17% 21%
Language
First language learned at home was other than English 40% 47% 52% 47% 70%
Year Student Entered Current School
Year of the assessment 25% 15% 22% 18%
Year prior to the assessment Data not 9% 15% 14% 24%
2 years prior to the assessment collected†† 12% 25% 14% 9%
3 or more years prior to the assessment 50% 46% 47% 48%
Data not available 3% 0% 3% 0%
* Contextual data pertaining to gender, student status, place of birth, language learned at home and year entered school are provided by schools and/or boards through
the Student Data Collection process. Some data may be missing because they were not provided by the school or the board.
† Some French Immersion students do not write all components of the assessment in Grade 3; the numbers shown reflect those students who were expected to write each
component as determined by the French Immersion participation option selected by boards.
** See the Explanation of Terms.
†† The question related to student mobility changed in 2005–2006.
September 17, 2009 13 of 31
14. School Report Jesse Ketchum Jr & Sr PS (282693)
Results over Time, 2005–2006 to 2008–2009®
Grade 3: Reading
Grade 3 Reading: School* Percentage of All Grade 3 Students at All Levels in Reading: School*
Year '05–'06 '06–'07 '07–'08 '08–'09
Number of
Students
32 48 36 33
Level 4 9% 2% 3% 6%
Level 3 59% 48% 50% 61% 61
59
Level 2 12% 27% 33% 12% 48 50
Level 1 6% 8% 6% 9% 33
27
NE1** 3% 4% 3% 0%
Participating 9 12 12 9
X
91% 90% 94% 88% 6 8 6 6
Students 3 4 3 2 3
X
0
No Data 9% 10% 6% 3%
NE1 Level 1 Level 2 Level 3 Level 4
Exempt 0% 0% 0% 9%
At or Above
Provincial 69% 50% 53% 67% 2005–2006 2006–2007 2007–2008 2008–2009
Standard†
Grade 3 Reading: Board* Percentage of All Grade 3 Students at All Levels in Reading: Board*
Year '05–'06 '06–'07 '07–'08 '08–'09
Number of
Students
17 219 16 526 15 866 16 062
Level 4 7% 7% 8% 8%
Level 3 52% 51% 49% 50%
Level 2 24% 25% 25% 24% 52 51 49 50
Level 1 6% 7% 7% 8%
NE1** 2% 2% 2% 2% 24 25 25 24
Participating 7 7 8 7 7 8 8
X
91% 91% 92% 92% 6
Students X 2 2 2 2
No Data 3% 2% 2% 2%
NE1 Level 1 Level 2 Level 3 Level 4
Exempt 6% 6% 6% 6%
At or Above
Provincial 59% 57% 57% 58% 2005–2006 2006–2007 2007–2008 2008–2009
Standard†
Grade 3 Reading: Province* Percentage of All Grade 3 Students at All Levels in Reading: Province*
Year '05–'06 '06–'07 '07–'08 '08–'09
Number of
Students
129 630 127 618 125 088 121 787
Level 4 6% 6% 8% 7%
Level 3 56% 55% 53% 53%
56 55 53 53
Level 2 24% 25% 26% 26%
Level 1 6% 6% 7% 7%
NE1** 1% 2% 2% 2% 24 25 26 26
Participating 7 7 8 7
X
94% 95% 95% 95% 6 6 6 6
Students X
1 2 2 2
No Data 1% 1% 1% 1%
NE1 Level 1 Level 2 Level 3 Level 4
Exempt 5% 4% 4% 4%
At or Above
Provincial 62% 62% 61% 61% 2005–2006 2006–2007 2007–2008 2008–2009
Standard†
· Refer to the EQAO Web site (www.eqao.com) for data from previous years.
* Because percentages in tables and graphs are rounded, and because graphs do not show all reporting categories, percentages may not add to 100.
** See the Explanation of Terms.
† These percentages are based on the actual number of students and cannot be calculated simply by adding the rounded percentages of students at Levels 3 and 4.
September 17, 2009 14 of 31
15. School Report Jesse Ketchum Jr & Sr PS (282693)
Results over Time, 2005–2006 to 2008–2009®
Grade 3: Writing
Grade 3 Writing: School* Percentage of All Grade 3 Students at All Levels in Writing: School*
Year '05–'06 '06–'07 '07–'08 '08–'09
Number of
Students
32 48 36 33
Level 4 9% 6% 0% 3%
Level 3 56% 44% 39% 58%
56 58
Level 2 22% 40% 36% 27%
44
40 39
Level 1 0% 0% 0% 0% 36
27
NE1** 3% 0% 6% 0% 22
Participating 9
Students
X
91% 90% 81% 88% 3 6 6 3
X
0 0 0 0 0 0 0
No Data 9% 10% 6% 3%
NE1 Level 1 Level 2 Level 3 Level 4
Exempt 0% 0% 14% 9%
At or Above
Provincial 66% 50% 39% 61% 2005–2006 2006–2007 2007–2008 2008–2009
Standard†
Grade 3 Writing: Board* Percentage of All Grade 3 Students at All Levels in Writing: Board*
Year '05–'06 '06–'07 '07–'08 '08–'09
Number of
Students
17 219 16 525 15 866 16 062
Level 4 7% 7% 6% 5%
Level 3 57% 57% 58% 61% 61
57 57 58
Level 2 27% 27% 28% 26%
Level 1 <1% <1% <1% <1%
27 27 28 26
NE1** 1% <1% <1% <1%
Participating 7 7
Students
X
91% 91% 92% 92% 6 5
X
1 <1 <1 <1 <1 <1 <1 <1
No Data 3% 3% 2% 2%
NE1 Level 1 Level 2 Level 3 Level 4
Exempt 6% 6% 6% 6%
At or Above
Provincial 64% 64% 64% 66% 2005–2006 2006–2007 2007–2008 2008–2009
Standard†
Grade 3 Writing: Province* Percentage of All Grade 3 Students at All Levels in Writing: Province*
Year '05–'06 '06–'07 '07–'08 '08–'09
Number of
Students
129 630 127 618 125 088 121 788
Level 4 6% 6% 5% 4%
Level 3 58% 58% 61% 63% 63
58 58 61
Level 2 29% 30% 29% 28%
Level 1 <1% <1% <1% <1%
29 30 29 28
NE1** <1% <1% <1% <1%
Participating
Students
X
94% 95% 96% 96% 6 6 5 4
X
<1 <1 <1 <1 <1 <1 <1 <1
No Data 1% 1% 1% 1%
NE1 Level 1 Level 2 Level 3 Level 4
Exempt 5% 4% 3% 3%
At or Above
Provincial 64% 64% 66% 68% 2005–2006 2006–2007 2007–2008 2008–2009
Standard†
· Refer to the EQAO Web site (www.eqao.com) for data from previous years.
* Because percentages in tables and graphs are rounded, and because graphs do not show all reporting categories, percentages may not add to 100.
** See the Explanation of Terms.
† These percentages are based on the actual number of students and cannot be calculated simply by adding the rounded percentages of students at Levels 3 and 4.
September 17, 2009 15 of 31
16. School Report Jesse Ketchum Jr & Sr PS (282693)
Results over Time, 2005–2006 to 2008–2009®
Grade 3: Mathematics
Grade 3 Mathematics: School* Percentage of All Grade 3 Students at All Levels in Mathematics: School*
Year '05–'06 '06–'07 '07–'08 '08–'09
Number of
Students
32 48 36 33
Level 4 25% 6% 8% 18%
Level 3 56% 42% 39% 45%
56
Level 2 3% 42% 33% 21%
42 42 39 45
Level 1 0% 2% 8% 3% 33
NE1** 9% 2% 3% 0% 25
21 18
Participating 9 8 8
X
94% 94% 92% 88% 3 3 3 6
Students X 2 0 0 2
No Data 6% 6% 8% 3%
NE1 Level 1 Level 2 Level 3 Level 4
Exempt 0% 0% 0% 9%
At or Above
Provincial 81% 48% 47% 64% 2005–2006 2006–2007 2007–2008 2008–2009
Standard†
Grade 3 Mathematics: Board* Percentage of All Grade 3 Students at All Levels in Mathematics: Board*
Year '05–'06 '06–'07 '07–'08 '08–'09
Number of
Students
18 401 17 813 17 210 17 388
Level 4 13% 13% 14% 16%
Level 3 53% 53% 52% 53%
Level 2 23% 23% 23% 21% 53 53 52 53
Level 1 3% 3% 3% 2%
NE1** 1% 1% <1% <1% 23 23 23 21
Participating 13 13 14 16
X
93% 93% 93% 93% 3 3 3
Students X
1 1 <1 <1 2
No Data 2% 2% 2% 2%
NE1 Level 1 Level 2 Level 3 Level 4
Exempt 5% 5% 5% 5%
At or Above
Provincial 66% 66% 67% 69% 2005–2006 2006–2007 2007–2008 2008–2009
Standard†
Grade 3 Mathematics: Province* Percentage of All Grade 3 Students at All Levels in Mathematics: Province*
Year '05–'06 '06–'07 '07–'08 '08–'09
Number of
Students
132 782 130 996 128 659 125 464
Level 4 11% 11% 12% 12%
Level 3 57% 57% 56% 58%
57 57 56 58
Level 2 23% 24% 25% 23%
Level 1 3% 3% 3% 2%
NE1** <1% <1% <1% <1% 23 24 25 23
Participating 11 11 12 12
X
95% 95% 96% 96% 3 3 3
Students X
<1 <1 <1 <1 2
No Data 1% 1% 1% 1%
NE1 Level 1 Level 2 Level 3 Level 4
Exempt 4% 3% 3% 3%
At or Above
Provincial 68% 69% 68% 70% 2005–2006 2006–2007 2007–2008 2008–2009
Standard†
· Refer to the EQAO Web site (www.eqao.com) for data from previous years.
* Because percentages in tables and graphs are rounded, and because graphs do not show all reporting categories, percentages may not add to 100.
** See the Explanation of Terms.
† These percentages are based on the actual number of students and cannot be calculated simply by adding the rounded percentages of students at Levels 3 and 4.
September 17, 2009 16 of 31
17. School Report Jesse Ketchum Jr & Sr PS (282693)
Assessments of Reading, Writing and Mathematics, Primary and Junior Divisions, 2008–2009
Contextual Information over Time: Grade 6*
This information provides a context for interpreting the school’s results over the past five years.
Grade 6 2004–2005 2005–2006 2006–2007 2007–2008 2008–2009
Enrolment
Number of students 42 31 32 36 30
Participation in the Assessment
Reading 95% 97% 97% 100% 90%
Writing 95% 97% 97% 100% 90%
Mathematics 95% 97% 97% 100% 87%
Gender
Female 19% 52% 72% 58% 57%
Male 17% 48% 28% 42% 43%
Student Status
English language learners** 5% 0% 0% 0% 0%
Students with special needs (excluding gifted)** 12% 13% 19% 14% 10%
Place of Birth
Born in Canada 24% 65% 56% 67% 70%
Born outside Canada 10% 35% 44% 33% 30%
In Canada less than one year 2% 10% 0% 0% 0%
In Canada one year or more but less than three years 2% 6% 0% 8% 10%
In Canada three years or more 5% 19% 38% 19% 20%
Language
First language learned at home was other than English 17% 48% 50% 53% 40%
Year Student Entered Current School
Year of the assessment 10% 9% 14% 33%
Year prior to the assessment Data not 29% 9% 6% 3%
2 years prior to the assessment collected†† 10% 12% 11% 10%
3 or more years prior to the assessment 52% 69% 69% 53%
Data not available 0% 0% 0% 0%
* Contextual data pertaining to gender, student status, place of birth, language learned at home and year entered school are provided by schools and/or boards through
the Student Data Collection process. Some data may be missing because they were not provided by the school or the board.
** See the Explanation of Terms.
†† The question related to student mobility changed in 2005–2006.
September 17, 2009 17 of 31