This document profiles high school readiness and success in Central Texas in 2012. It finds that:
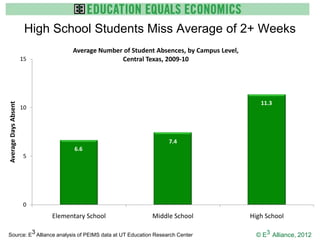
1) High school students miss an average of over 2 weeks of school each year, with absences highest among high school students.
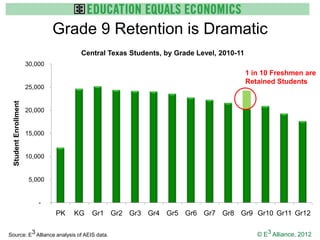
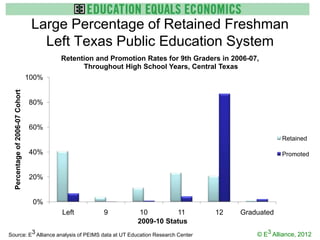
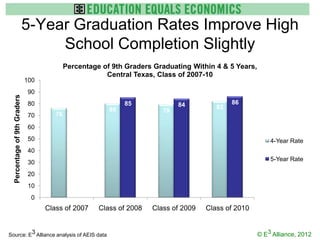
2) Around 1 in 10 freshmen are retained in 9th grade, showing a dramatic drop in enrollment after 8th grade.
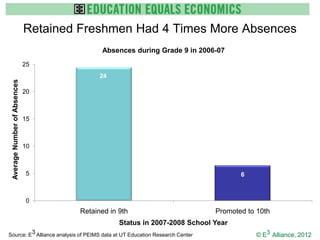
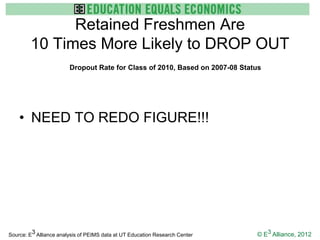
3) Retained freshmen had 4 times as many absences in 9th grade as students who were promoted, and were over 10 times more likely to eventually drop out of high school.
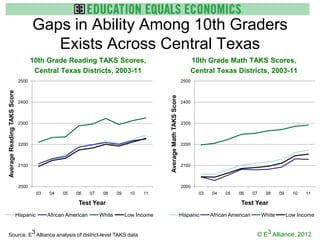
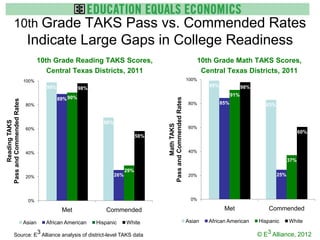
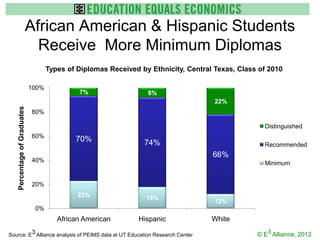
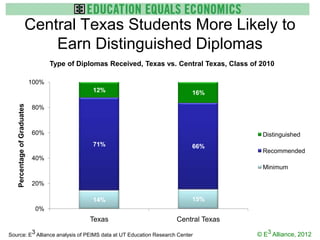
4) Large gaps exist in reading and math achievement between racial/ethnic groups and income levels as early as 10th grade, indicating uneven college


![Accountability plan revised2[1]](https://cdn.slidesharecdn.com/ss_thumbnails/accountabilityplanrevised21-120610100848-phpapp01-thumbnail.jpg?width=640&height=640&fit=bounds)


