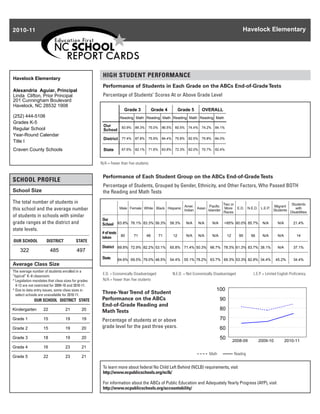
Havelock Elementary had high student performance on standardized tests, with 74.2% of students scoring at or above grade level in reading and 84.1% in math overall. The school was designated as a School of Progress for expected growth in learning achieved by students from one year to the next. The school met all 15 of its targets for Adequate Yearly Progress under No Child Left Behind.
![PAGE 2 Havelock Elementary
SAFE, ORDERLY AND HIGH STUDENT PERFORMANCE, CONTINUED
CARING SCHOOLS School Performance
Each year, schools in North Carolina may receive several designations based on their performance
School Safety on the state's ABCs tests. These designations are awarded on the basis of the percentage of
The number of acts of crime or students performing at grade level and on whether students have learned as much as they are
violence reported below includes all expected to learn in one year. The designations earned by your school are displayed below,
followed by a brief description of each designation.
Our Schoolʼs Designation(s): School of Progress, Expected Growth
acts occurring in school, at a bus
stop, on a school bus, on school
grounds, or during off-campus,
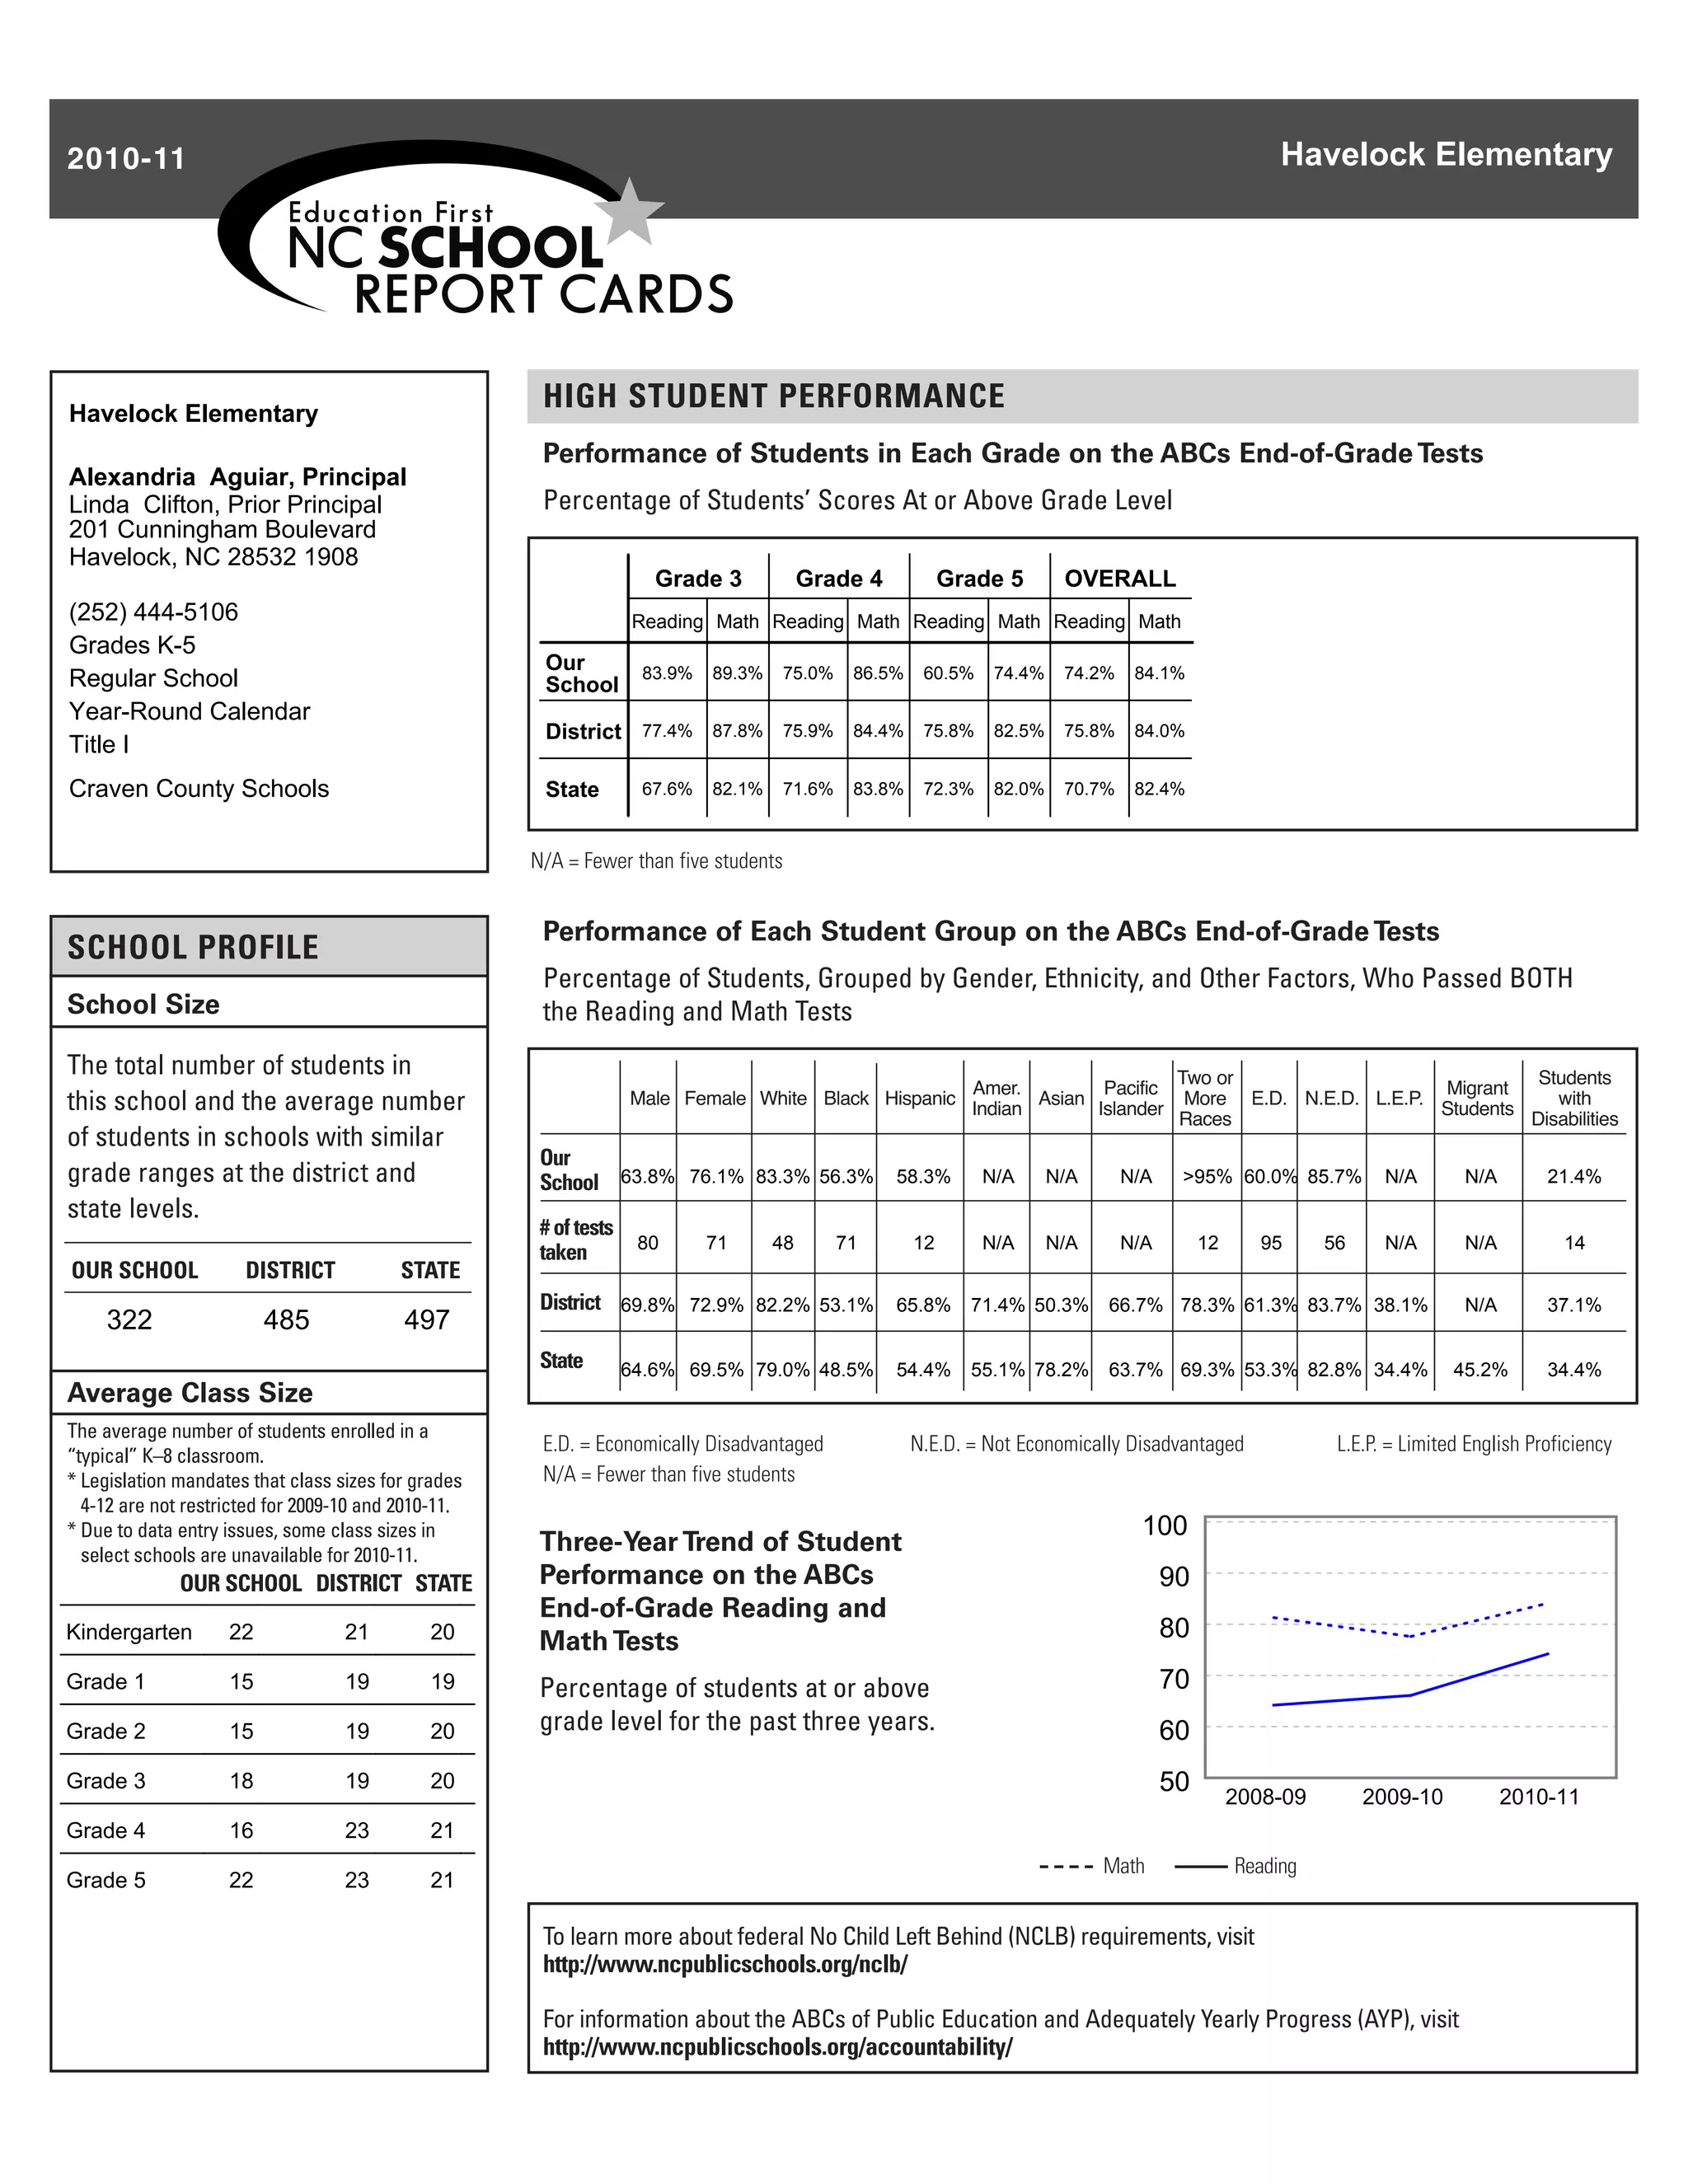
school-sponsored activities. GROWTH: PERCENT OF SCHOOLS
DESIGNATION PERFORMANCE: LEARNING ACHIEVED WITH DESIGNATION
High Expected Expected
STUDENTS PERFORMING AT GRADE LEVEL IN ONE YEAR
Out of 322 students in our
Growth Growth Growth Not
Achieved
school, there was a total of 1 DISTRICT STATE
act[s] of crime or violence.
HONOR SCHOOL At least 90% of students at grade level and the
OF EXCELLENCE school made adequate yearly progress (AYP) 13% 8%
The number of acts of crime or SCHOOL OF EXCELLENCE At least 90% of students at grade level 0% 1%
violence reported per 100 students: SCHOOL OF DISTINCTION At least 80% of students at grade level 27% 28%
SCHOOL OF PROGRESS At least 60% of students at grade level 7% 38%
OUR SCHOOL 0.31 NO RECOGNITION 60 to 100% of students at grade level 53% 15%
DISTRICT 0.28 PRIORITY SCHOOL 50 to 60% of students at grade level, OR
0% 11%
Less than 50% of students at grade level
STATE 0.26
LOW PERFORMING Less than 50% of students at grade level 0% 0%
Access to Technology Adequate Yearly Progress (AYP) Results
In any group where the percentage of students
Percentage of classrooms North Carolina has set target goals that schools at a grade level is greater than 95% or less
connected to the Internet must meet to make Adequate Yearly Progress than 5%, the actual values are not displayed
(AYP) under the federal No Child Left Behind (NCLB). because of federal privacy regulations. In
100.0% 99.9% 99.9%
100% Our school made adequate yearly progress. these cases the results are shown as 95%
or 5% for the group.
80%
Our school met 15 out of 15 AYP targets.
60%
40% QUALITY TEACHERS
20%
Total Number Fully Classes Taught by Teachers National Years of Teaching Experience Teacher
0–3 4–10 10+
0% of Classroom Licensed Highly Qualified with Board Turnover
years years years
Our District State Teachers* Teachers Teachers Advanced Certified Rate
School Degrees Teachers*
Our School 25 96% 100% 8% 2 32% 32% 36% 8%
District 32 99% 100% 26% 6 23% 28% 50% 12%
Keeping you informed State 34 99% 100% 29% 6 18% 33% 49% 10%
More information about your * The total number of teachers in this school and the average number of teachers in schools with similar grade ranges at the district
and state level.
school is available on the NC
School Report Cards website at:
http://www.ncreportcards.org PUBLIC SCHOOLS OF NORTH CAROLINA
State Board of Education | Department of Public Instruction](https://image.slidesharecdn.com/havelocksnapshot-120717173106-phpapp02/85/Havelock-snapshot-2-320.jpg)


