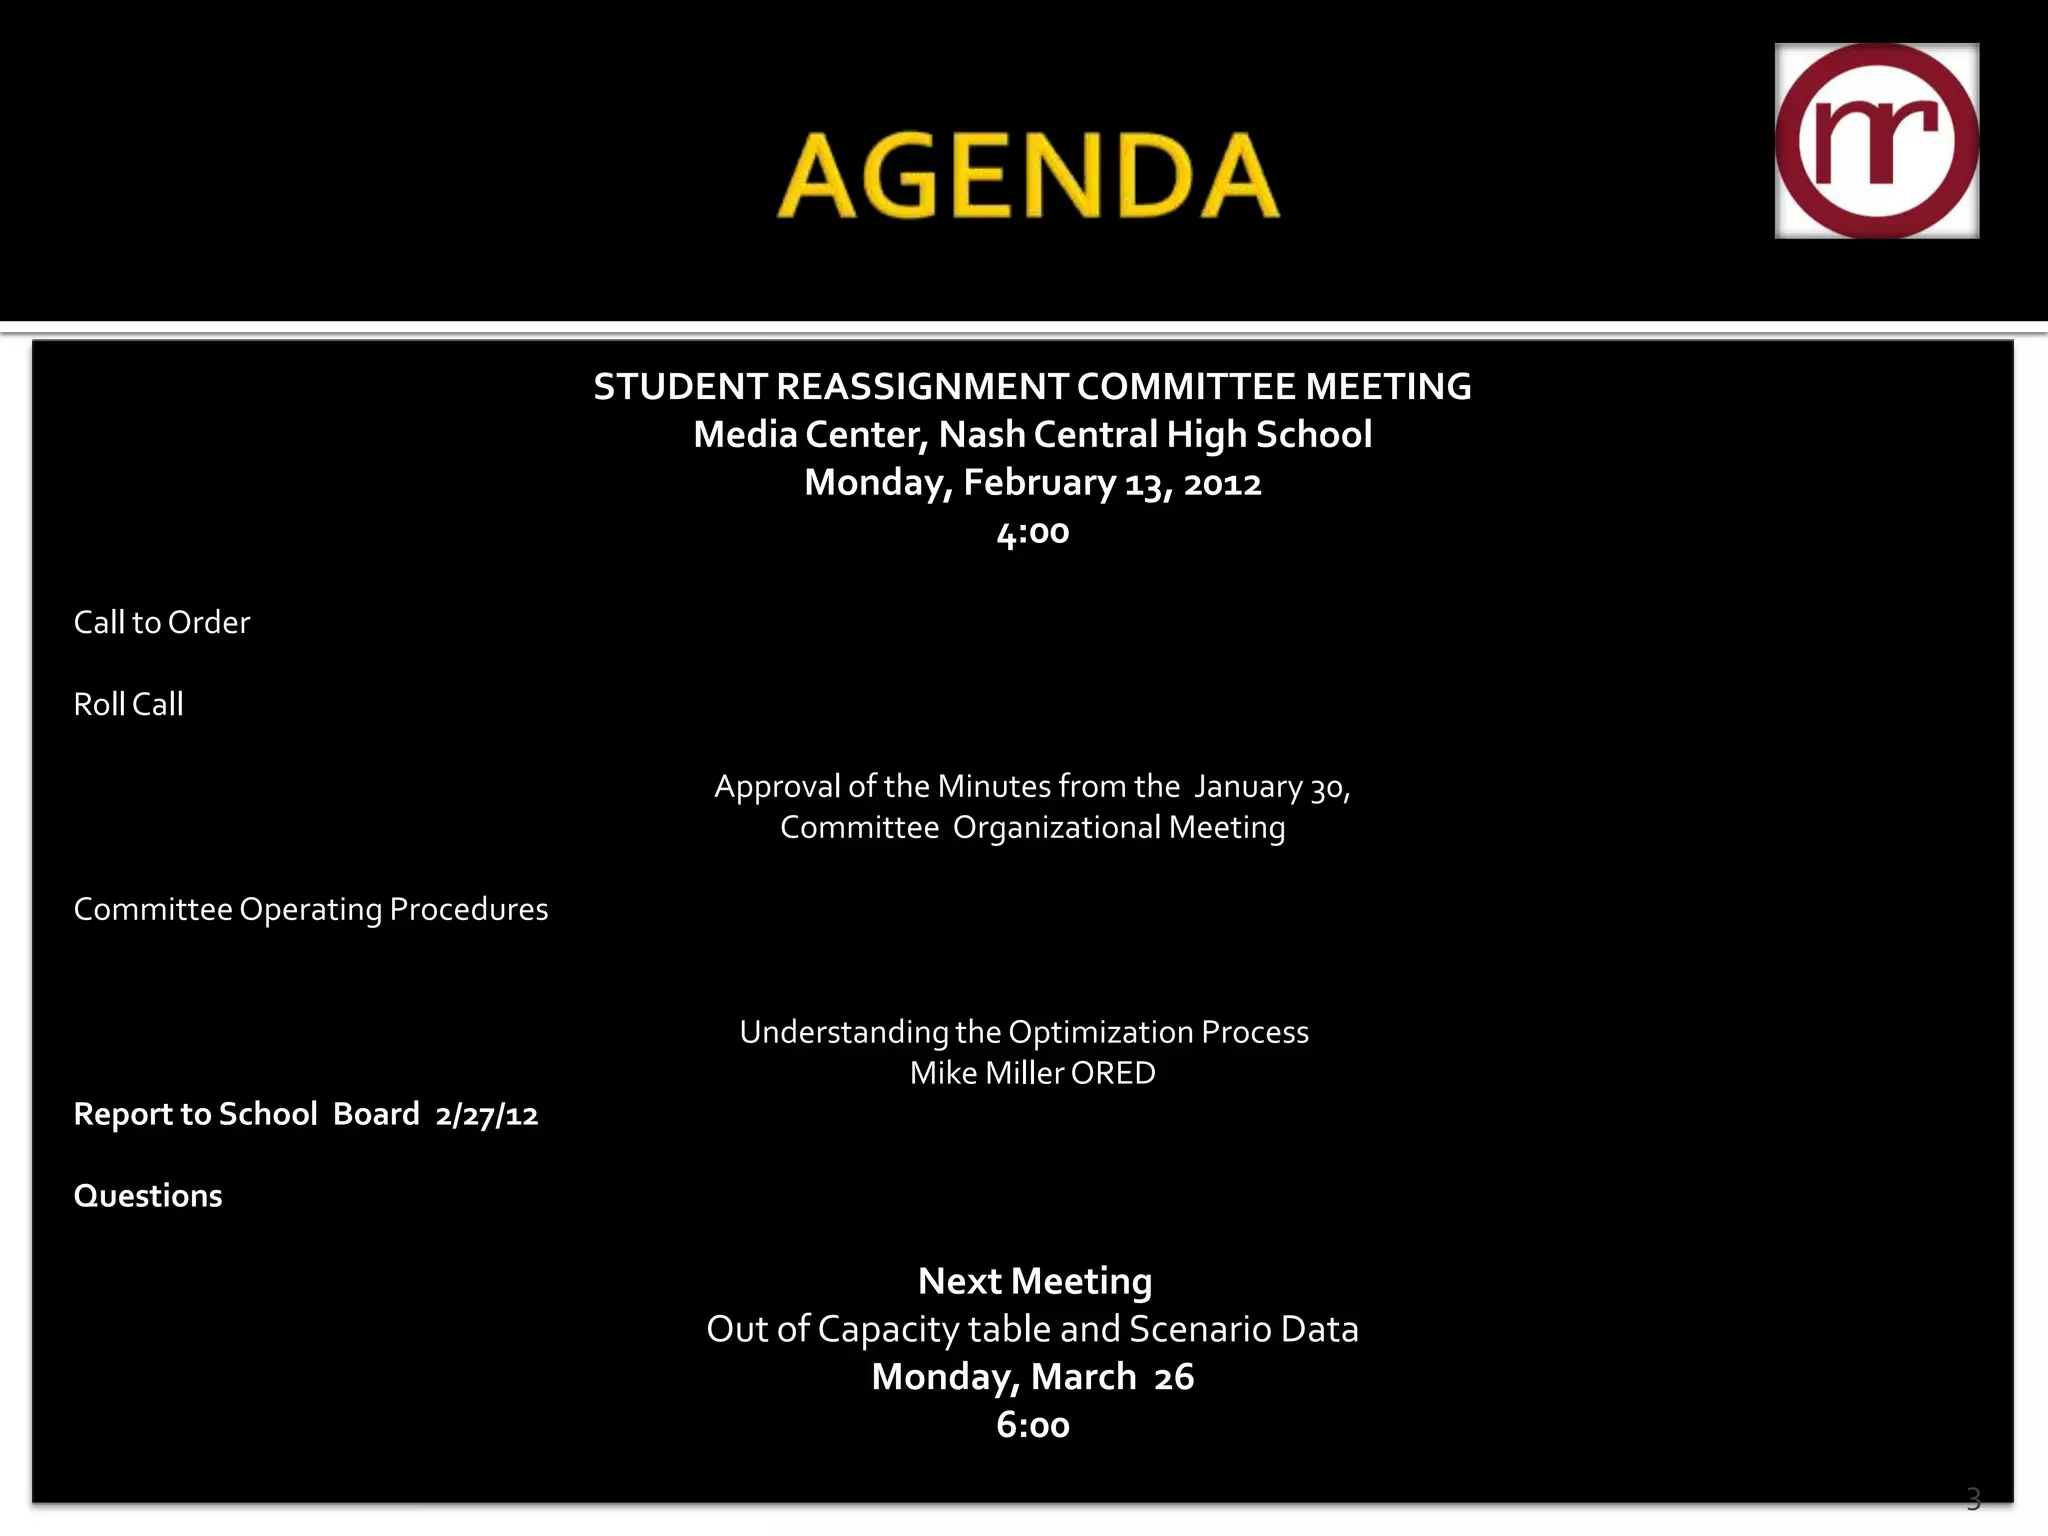
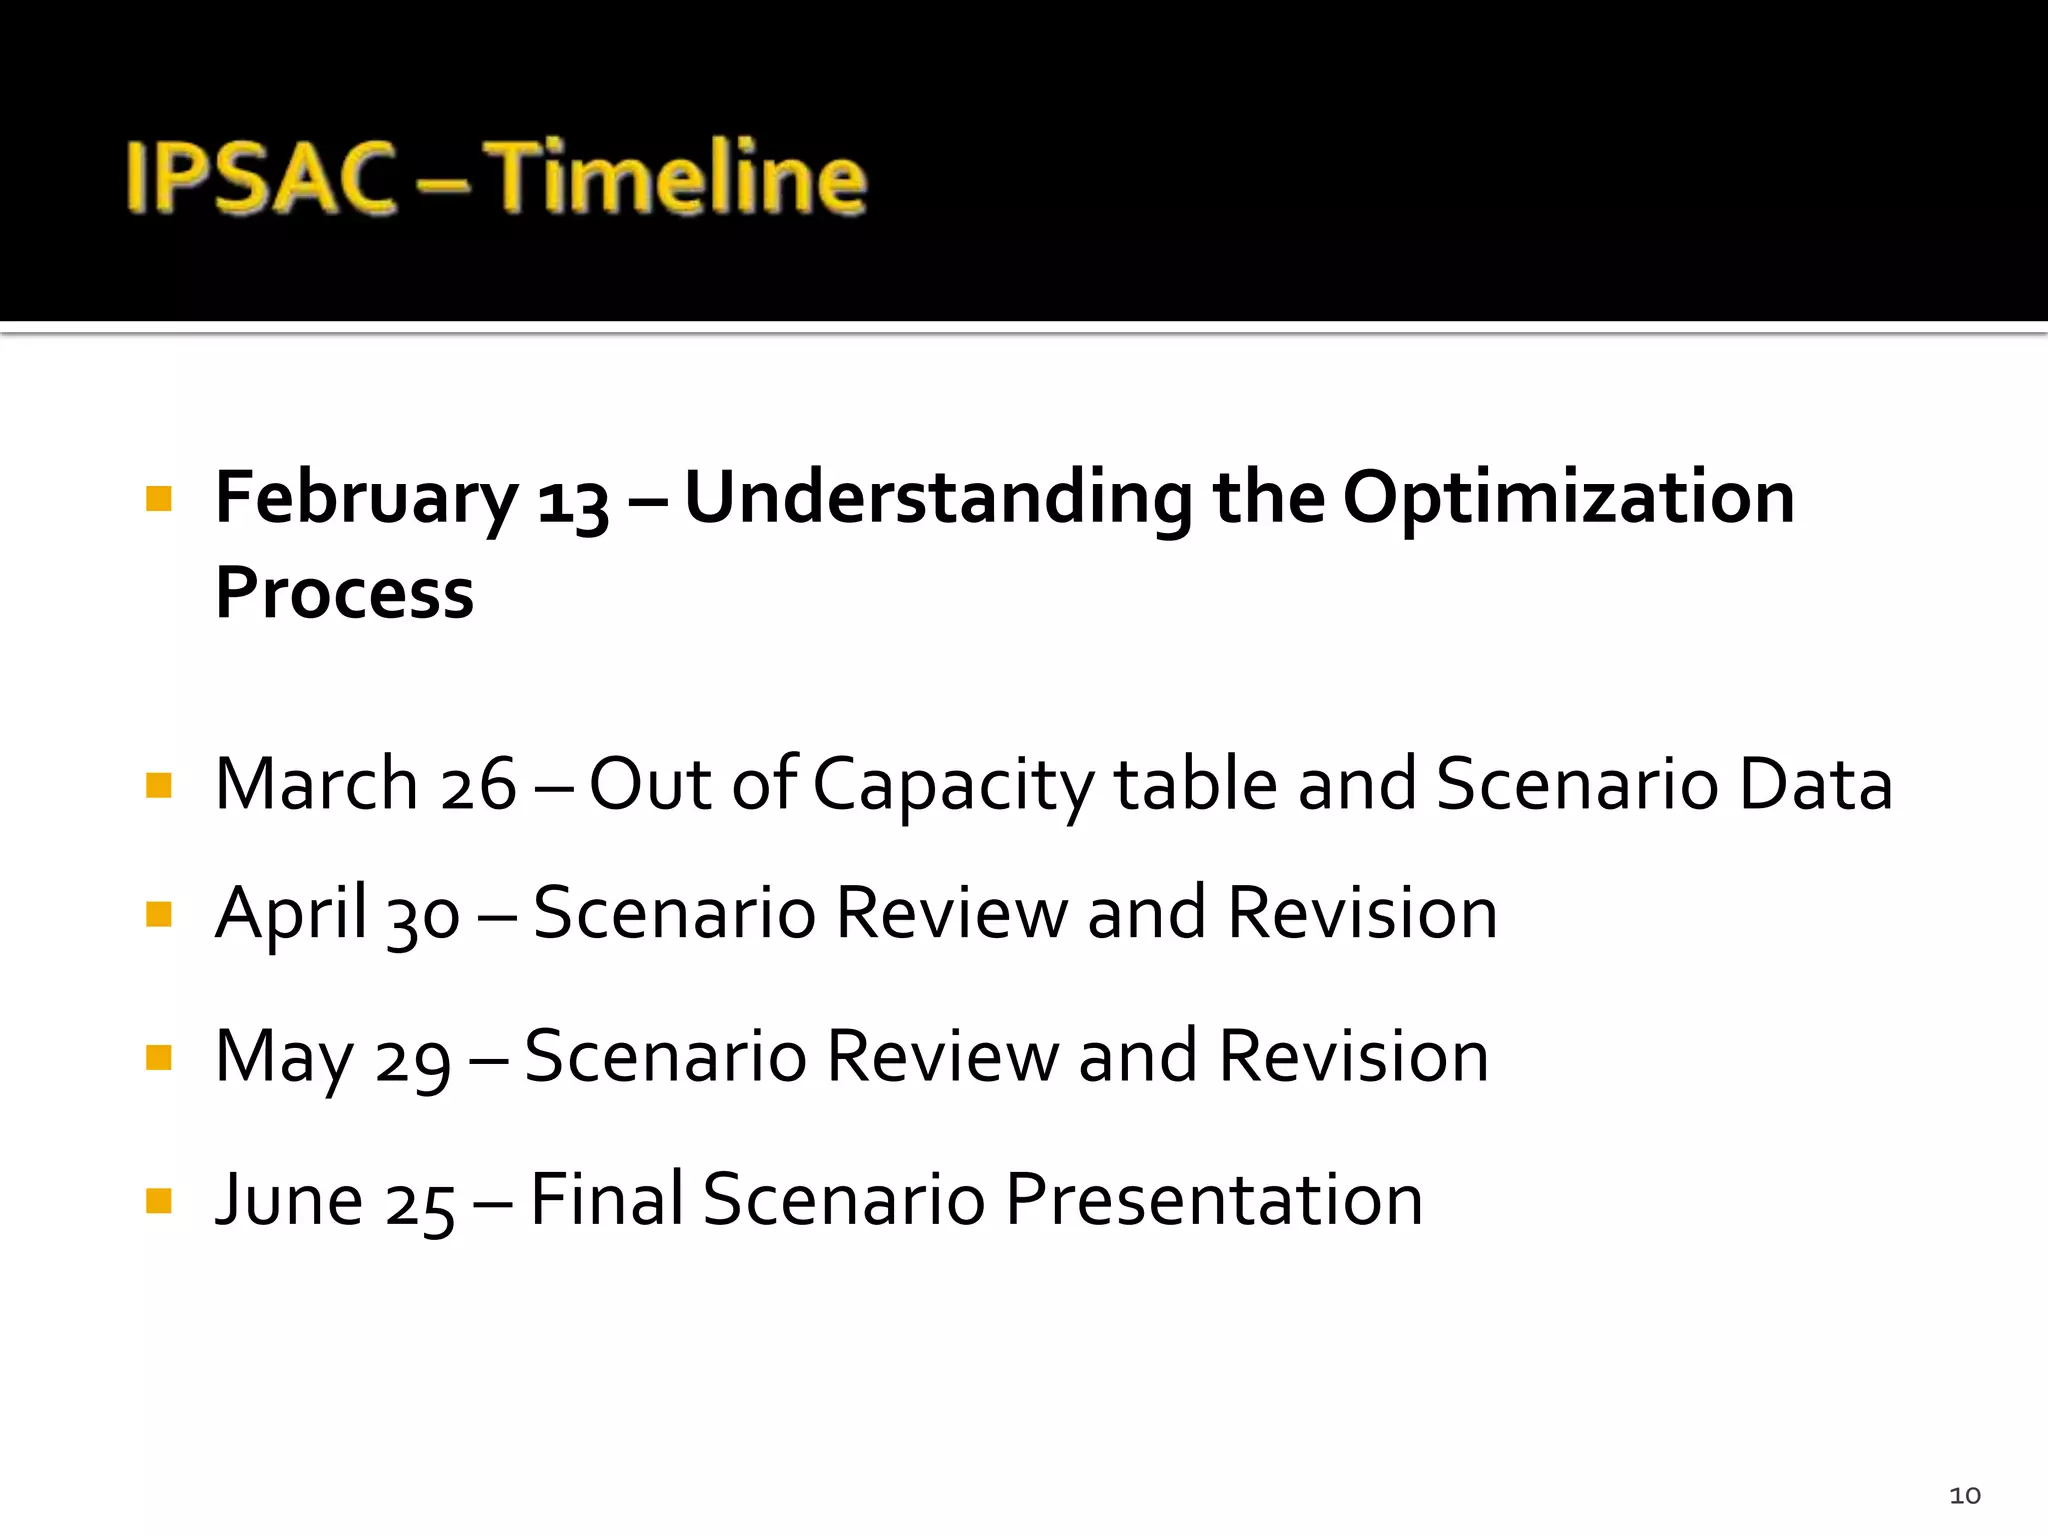
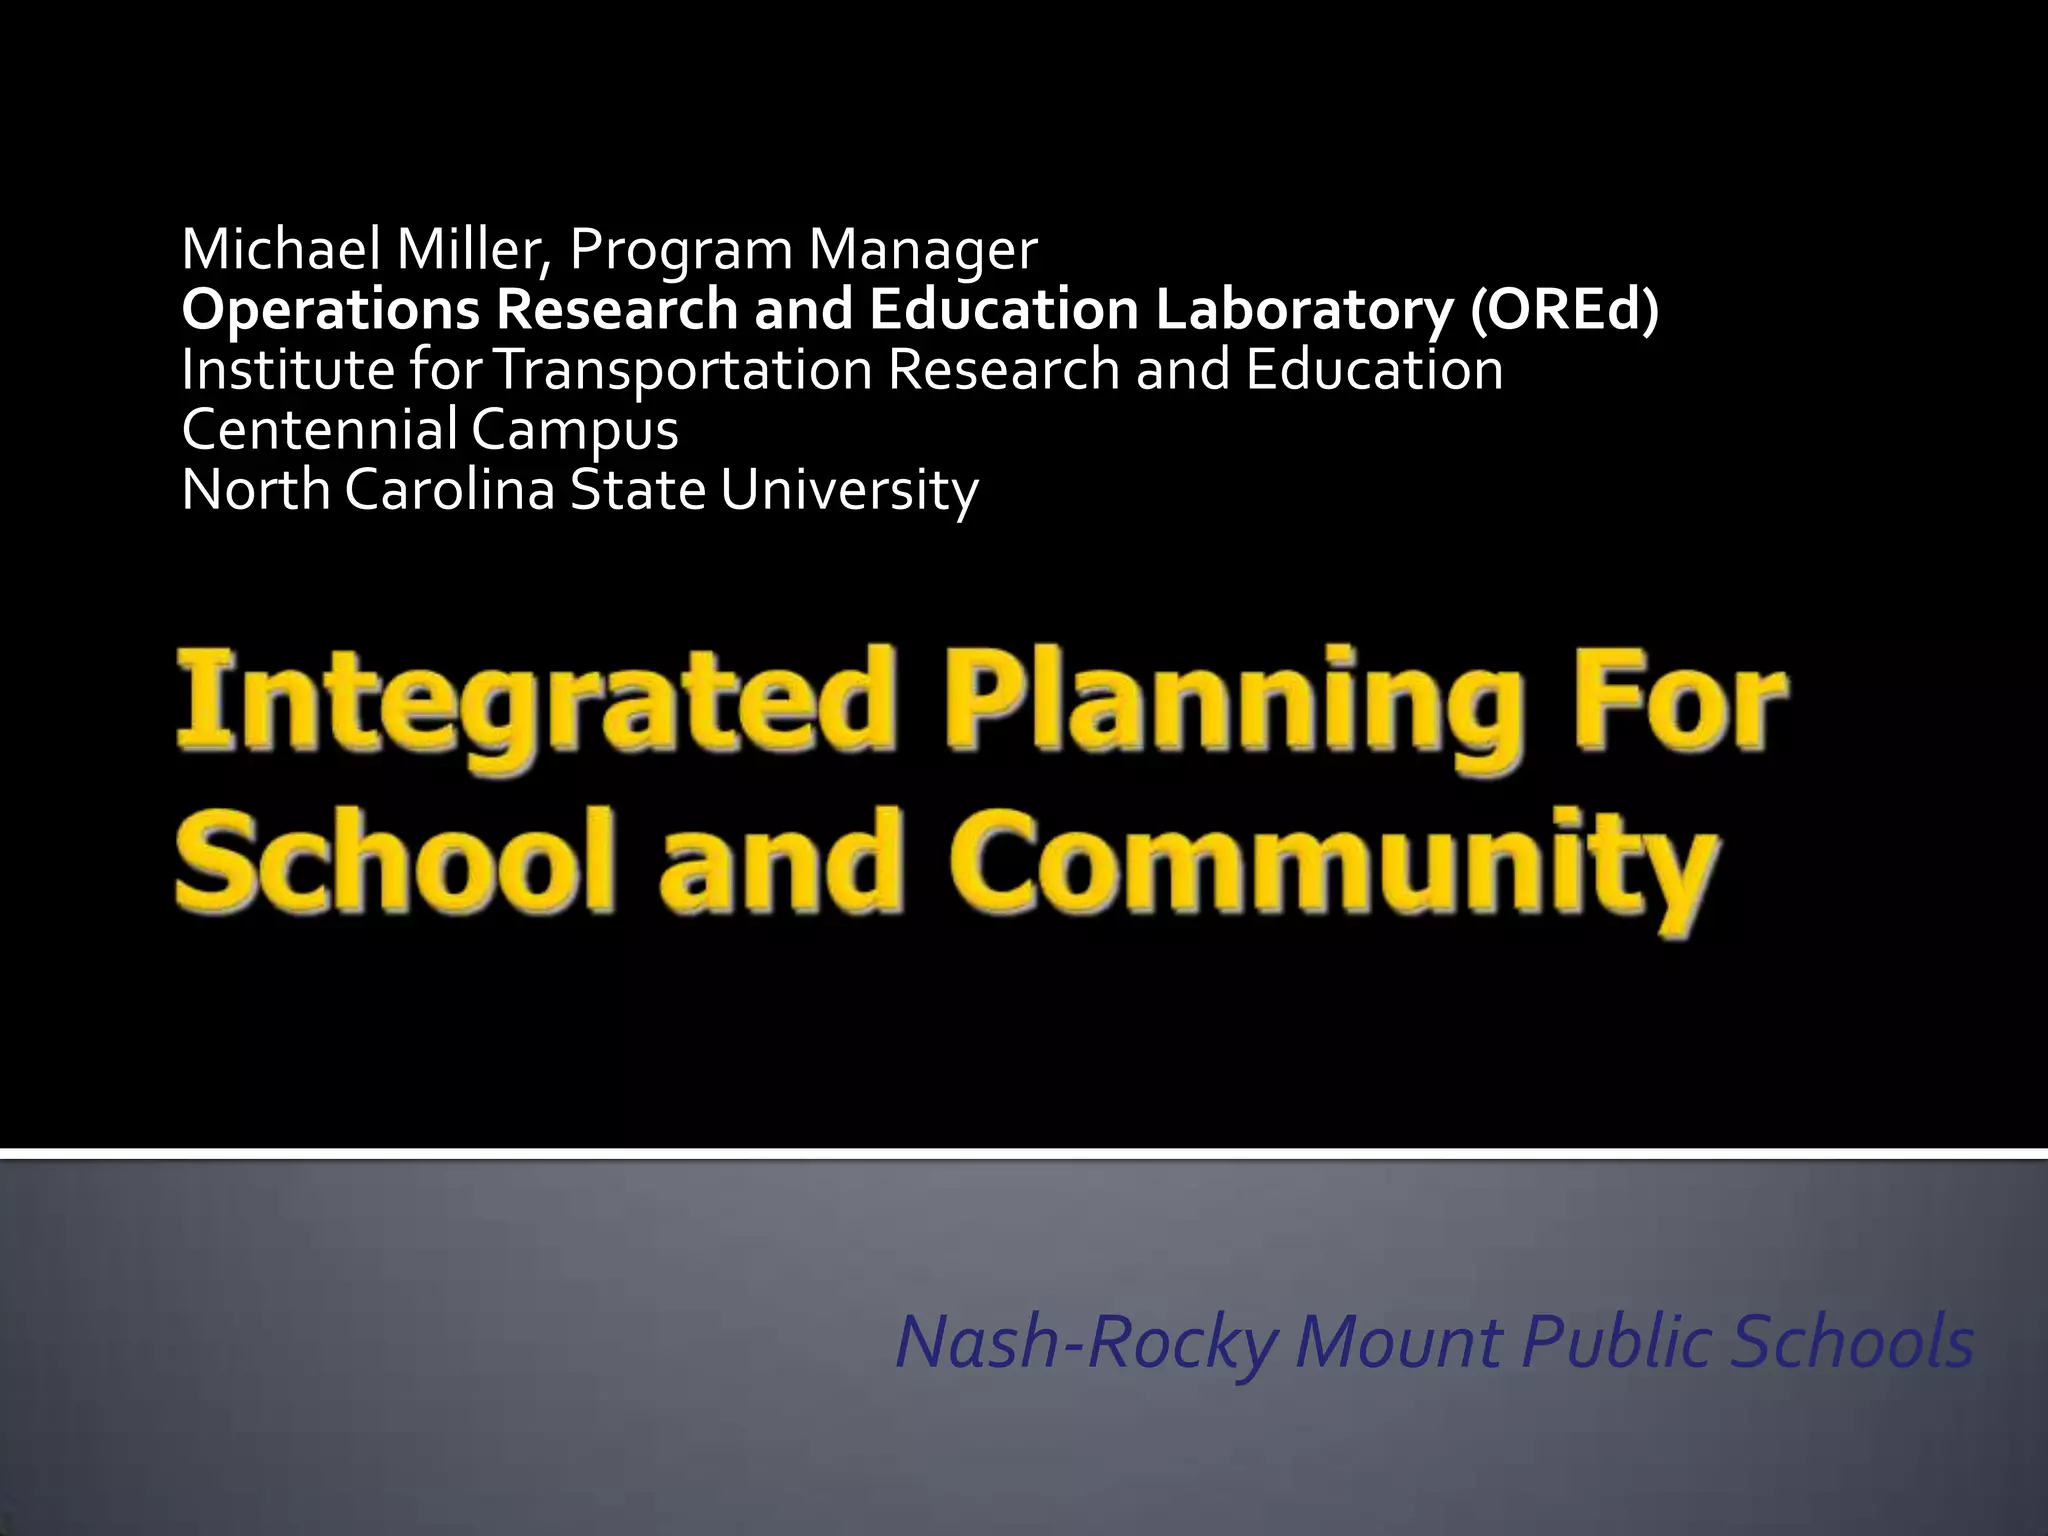
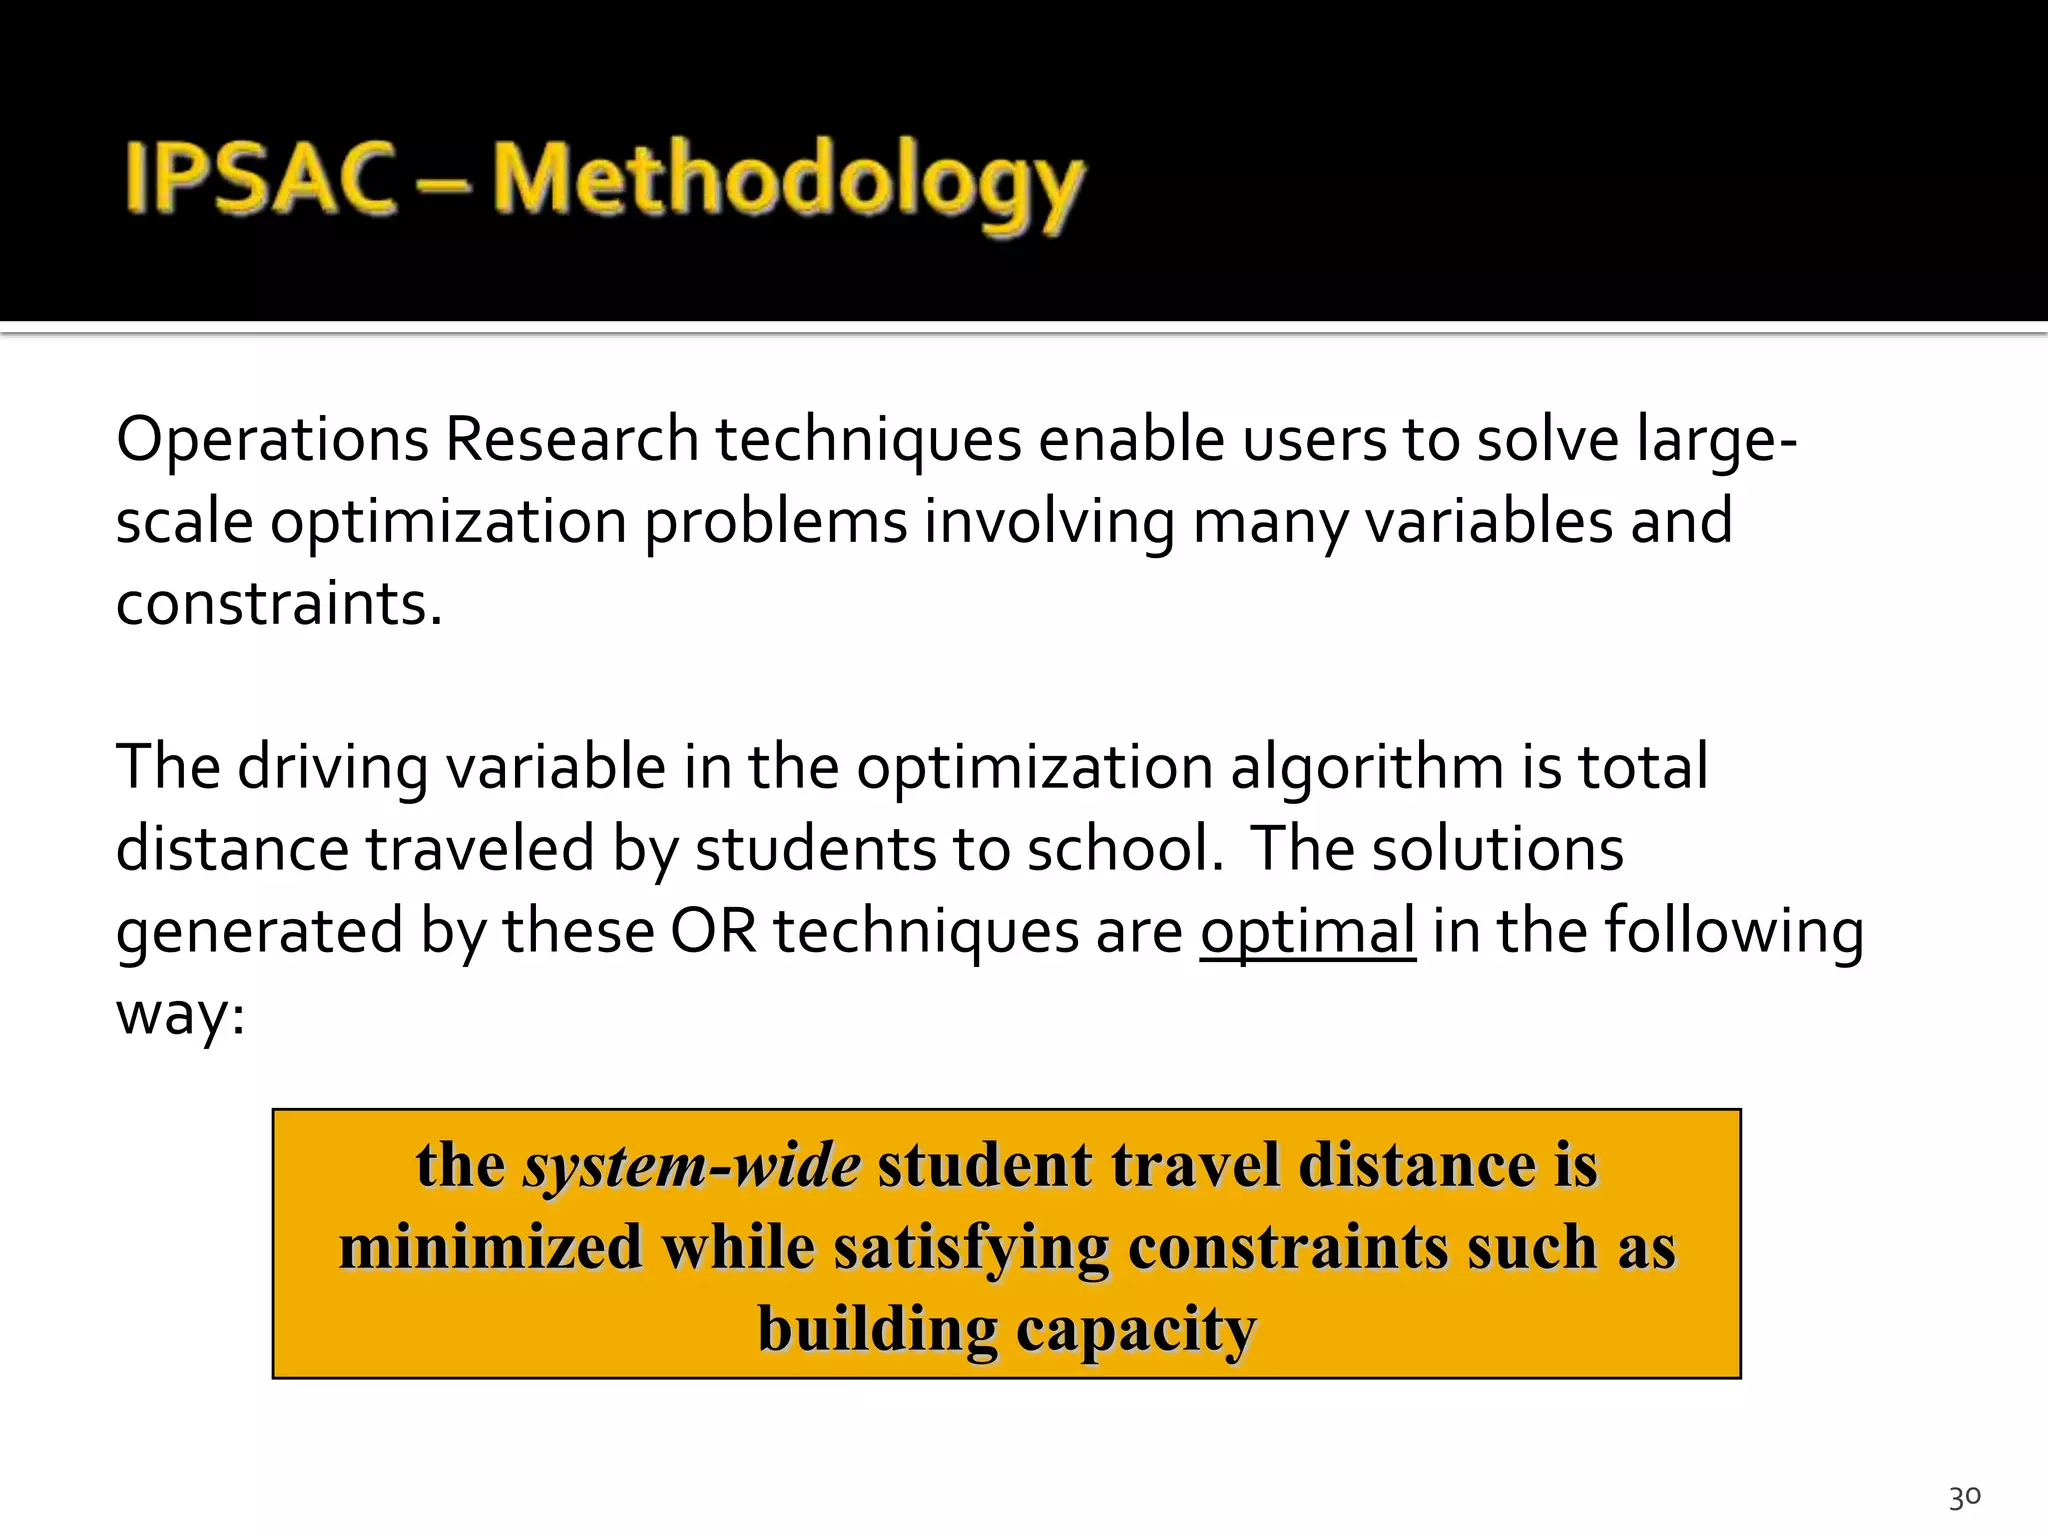
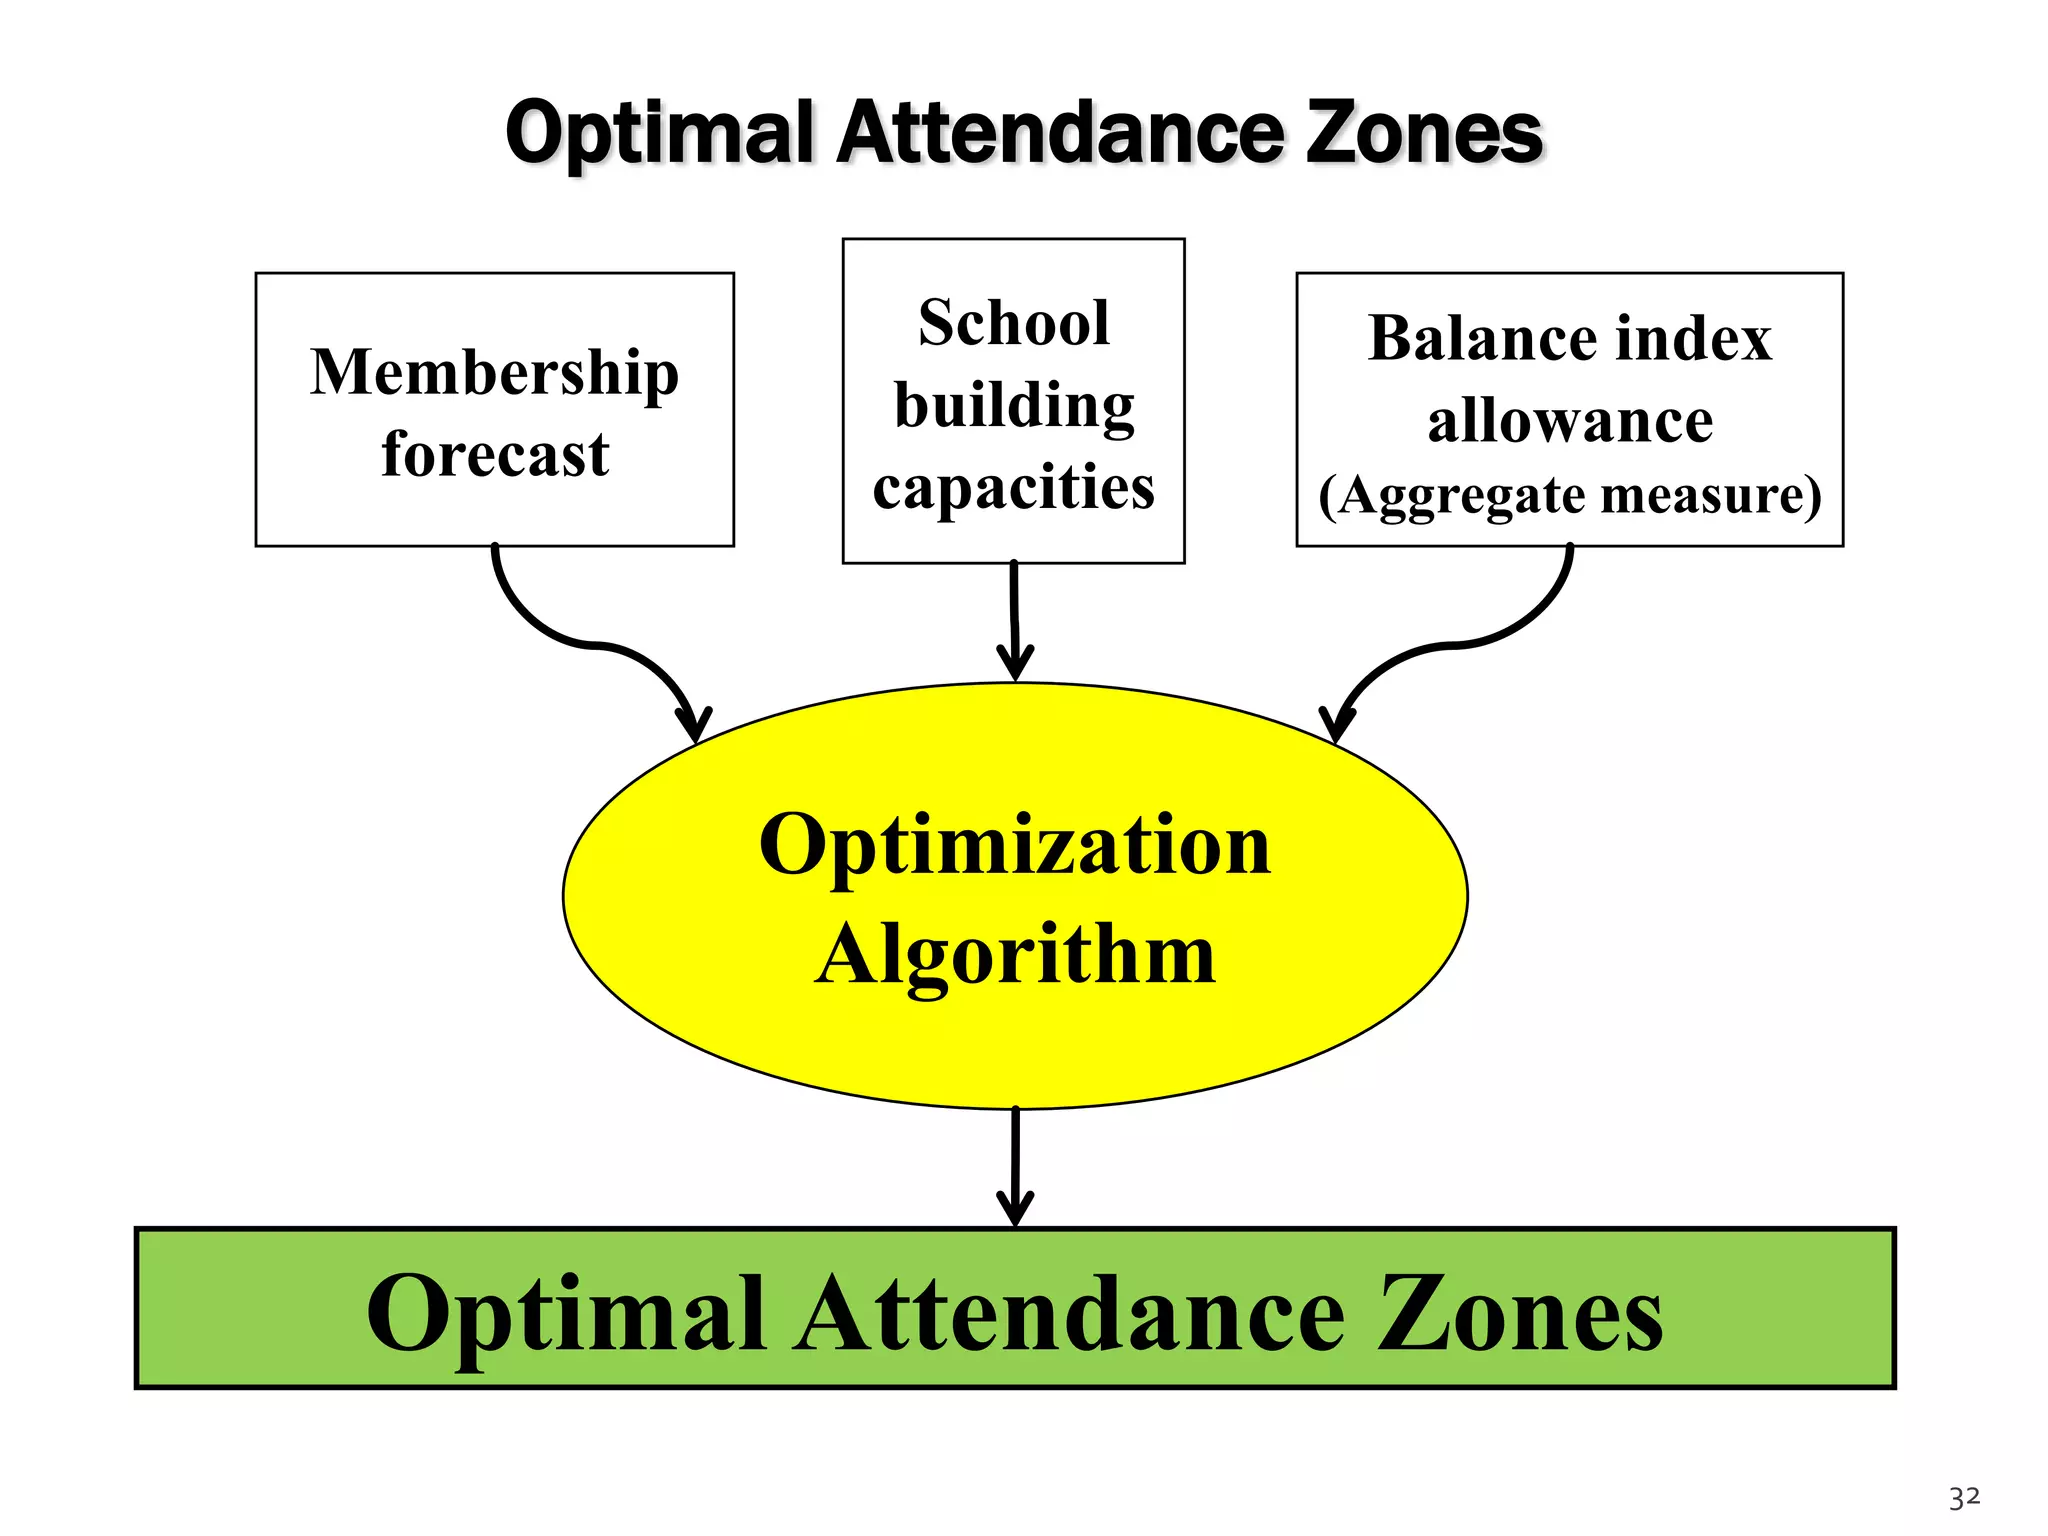
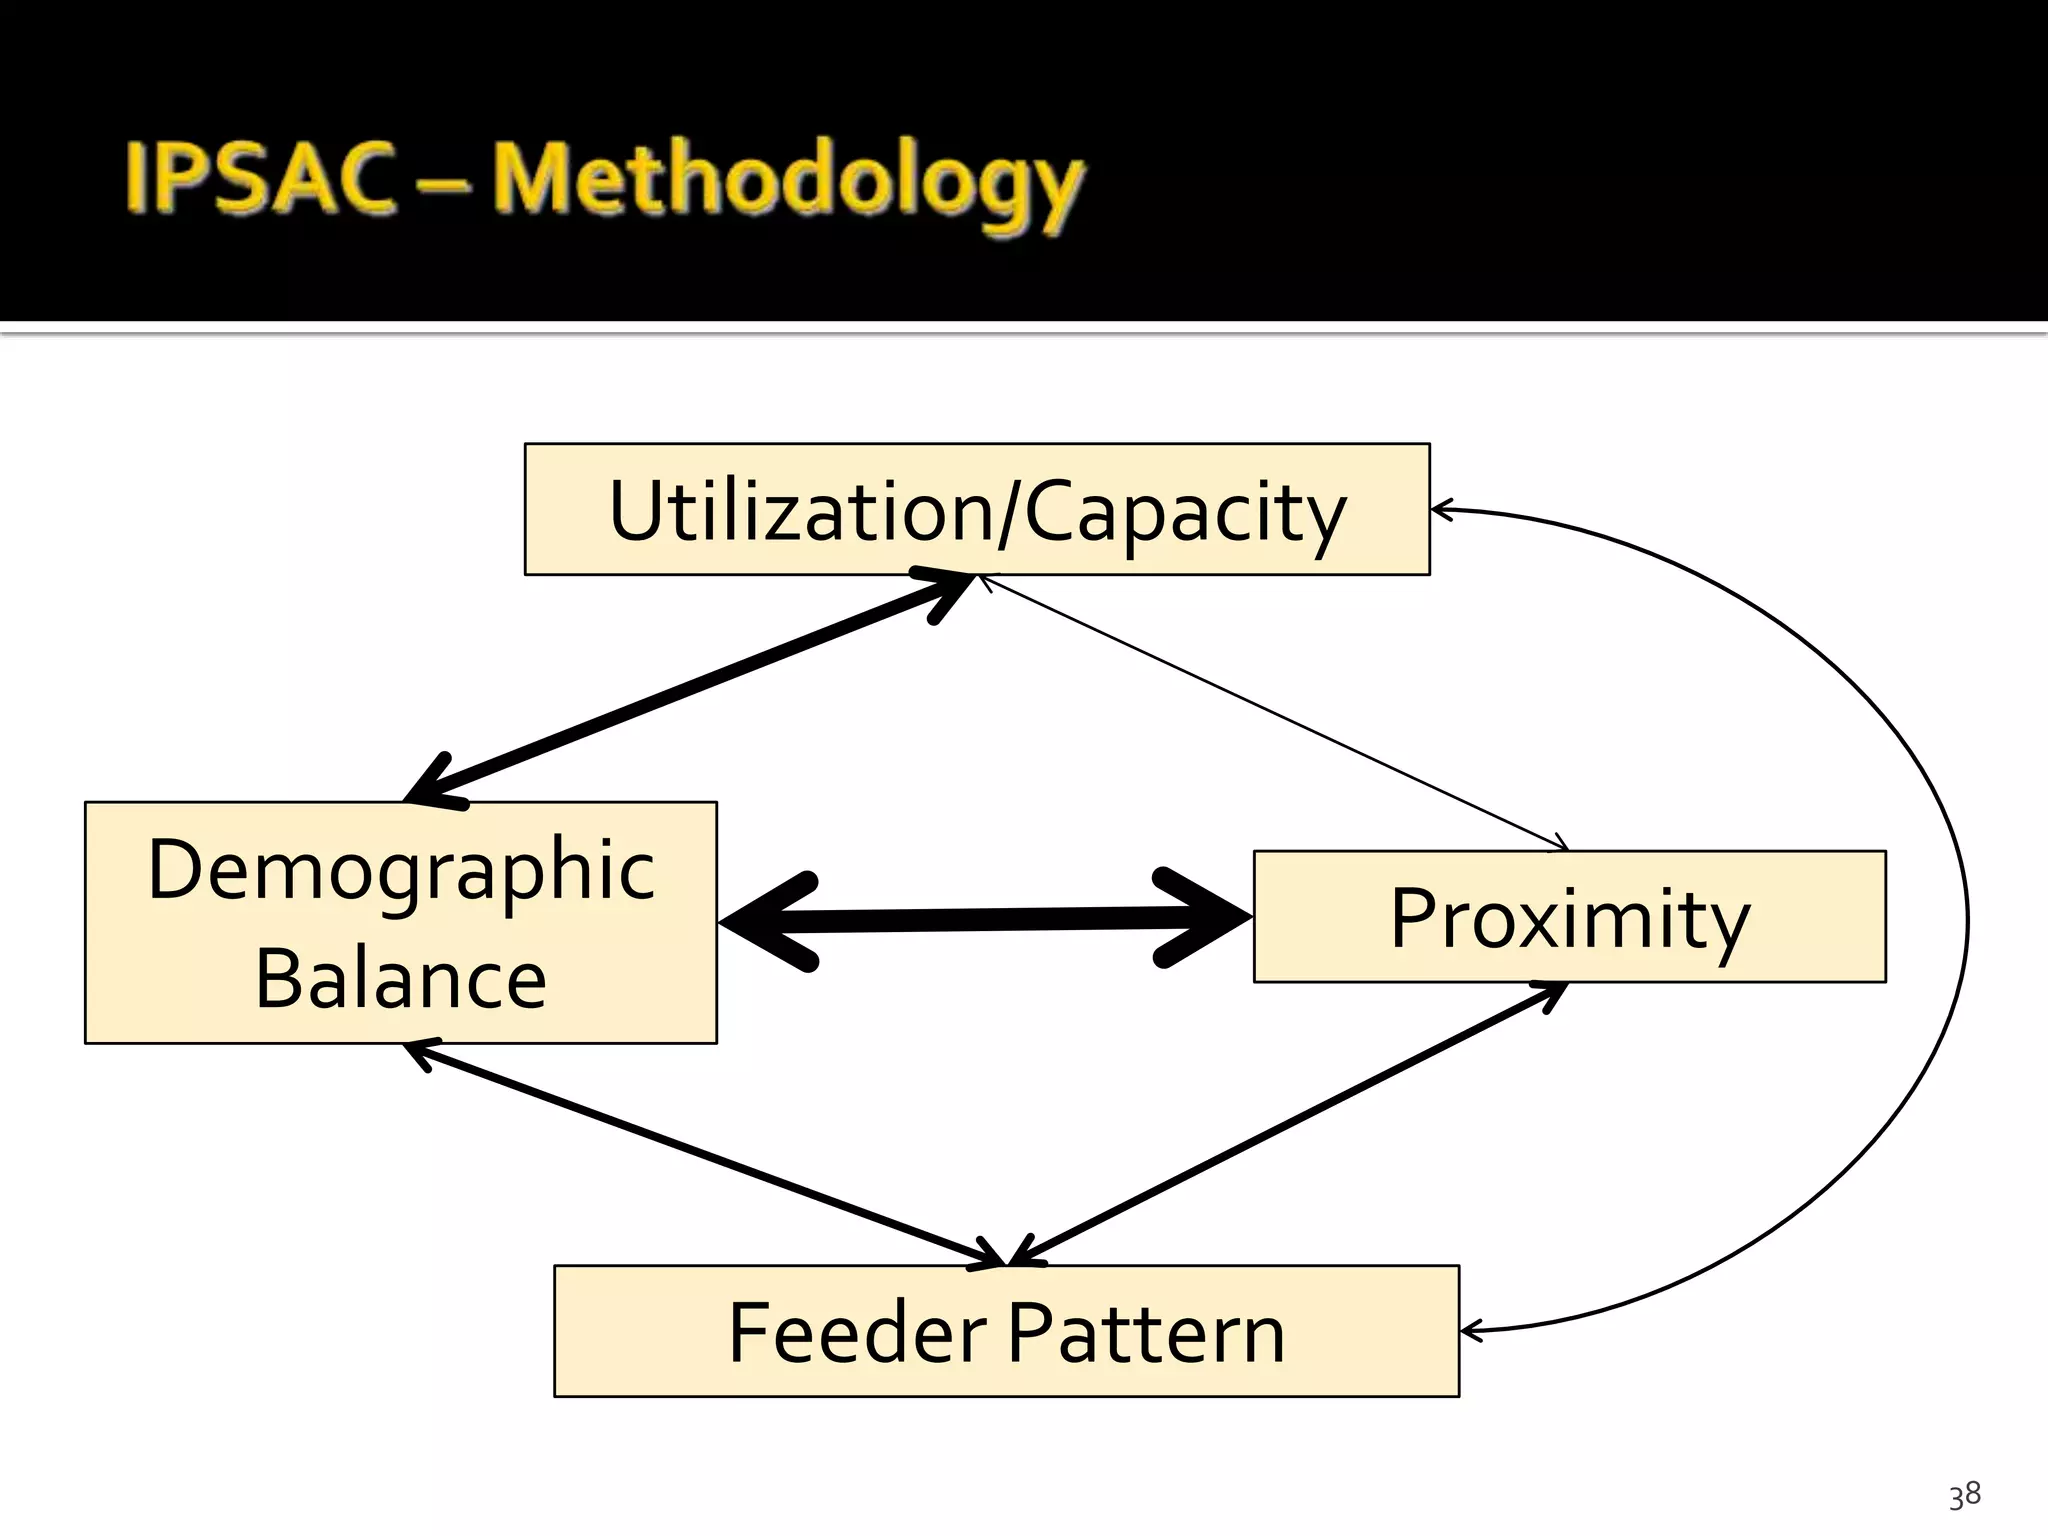
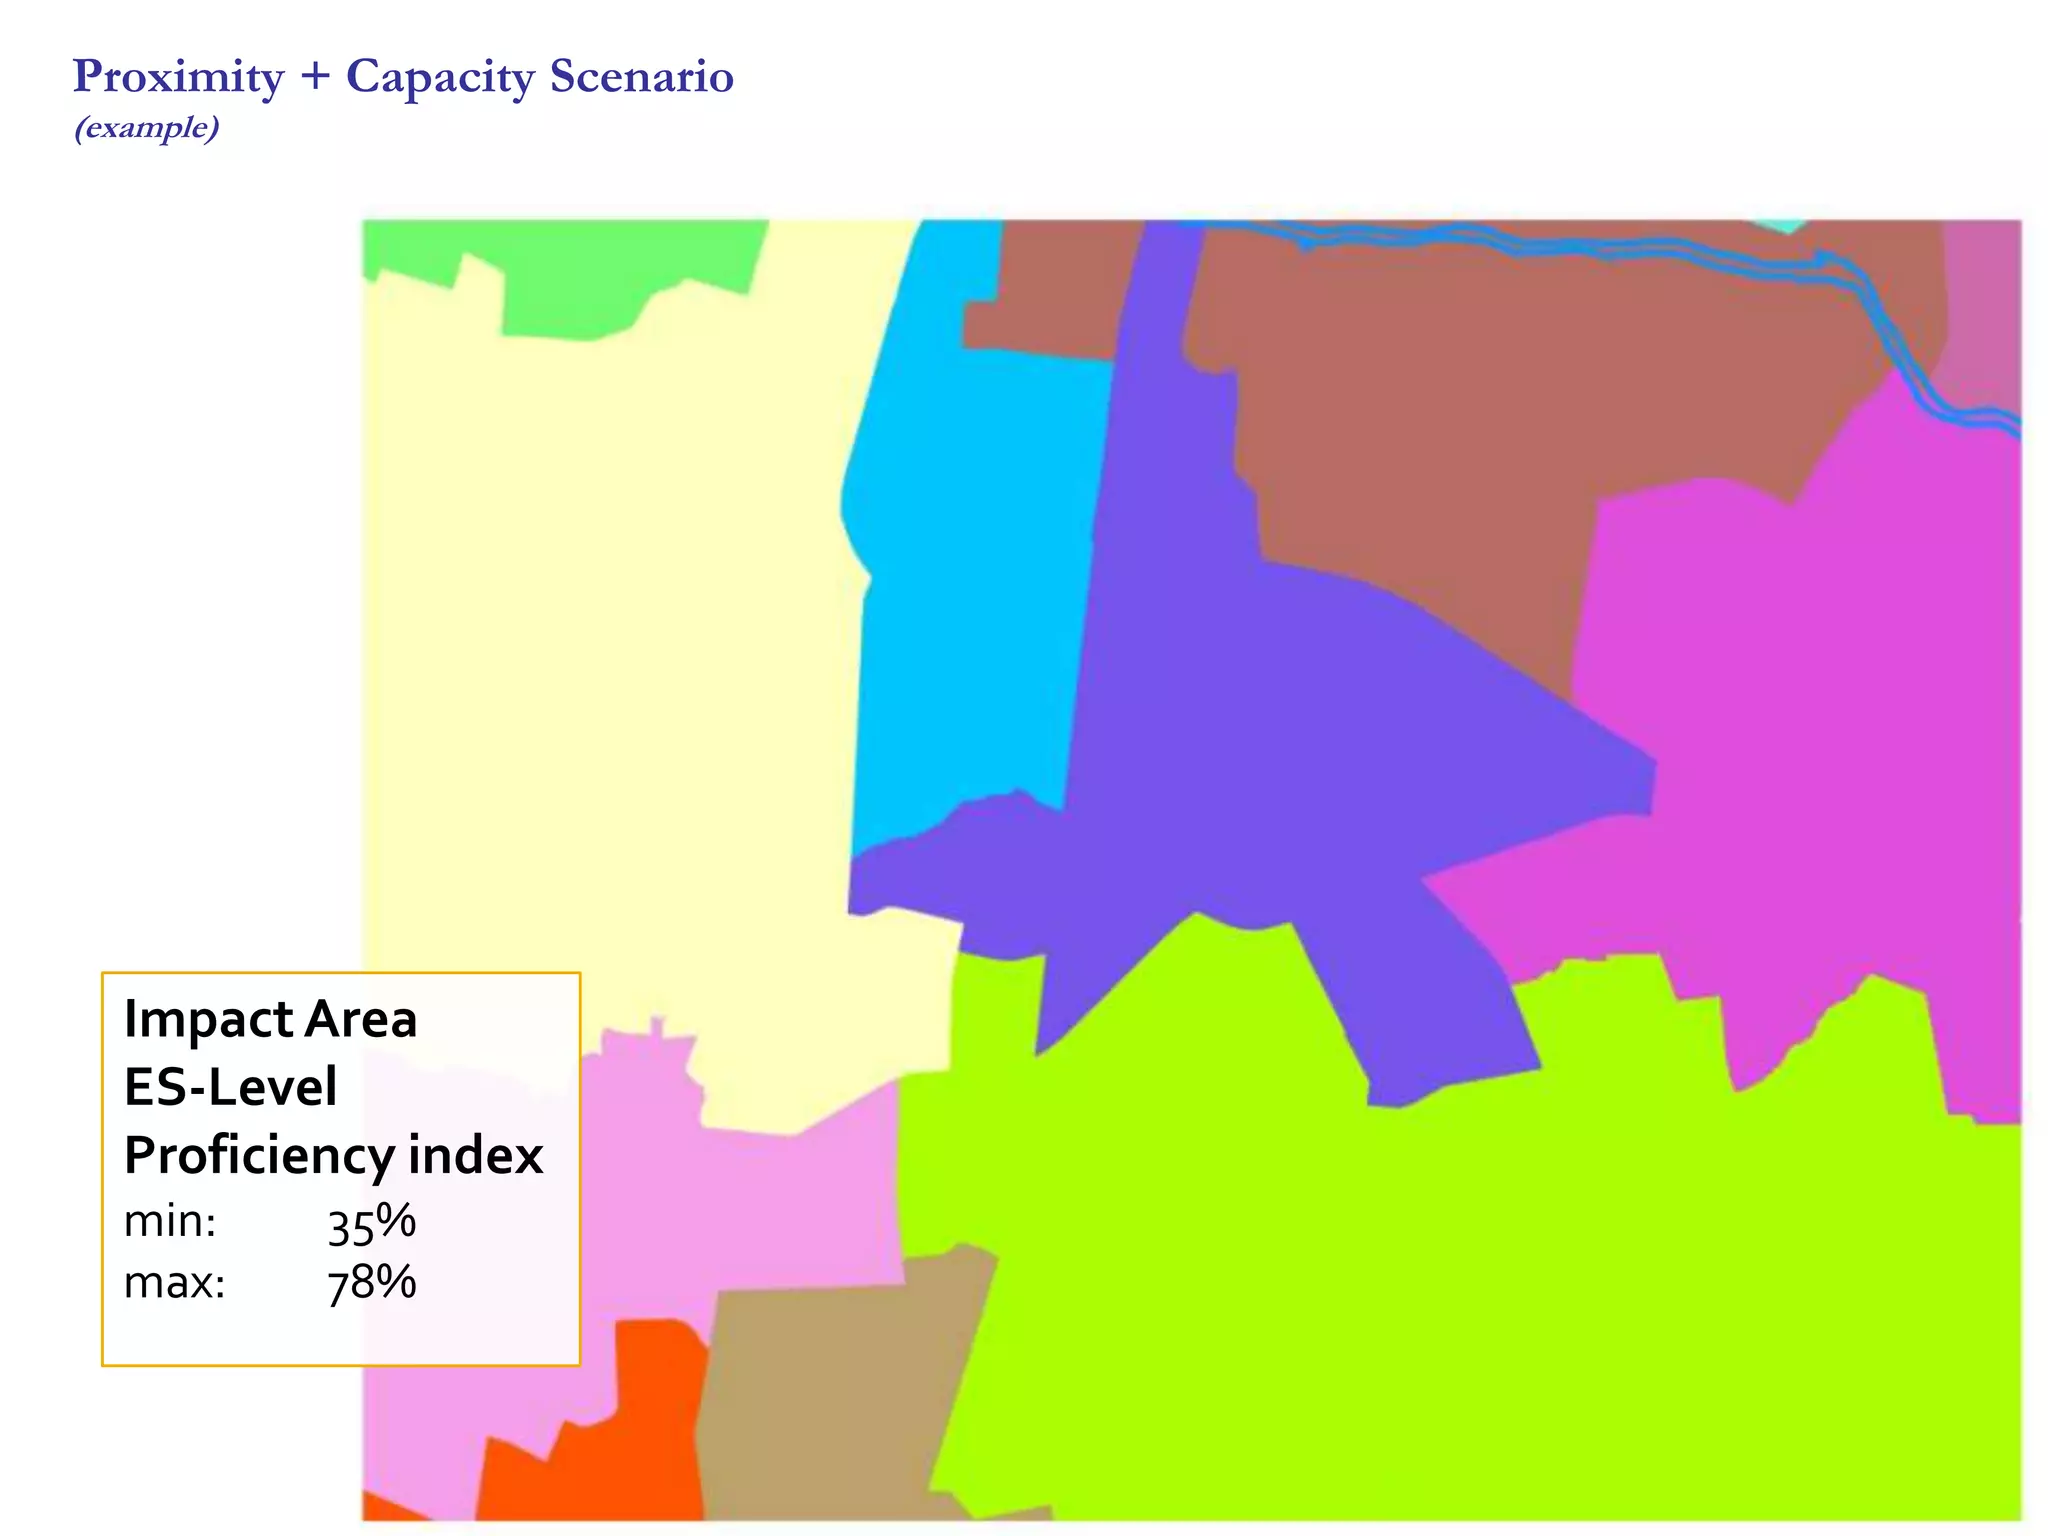
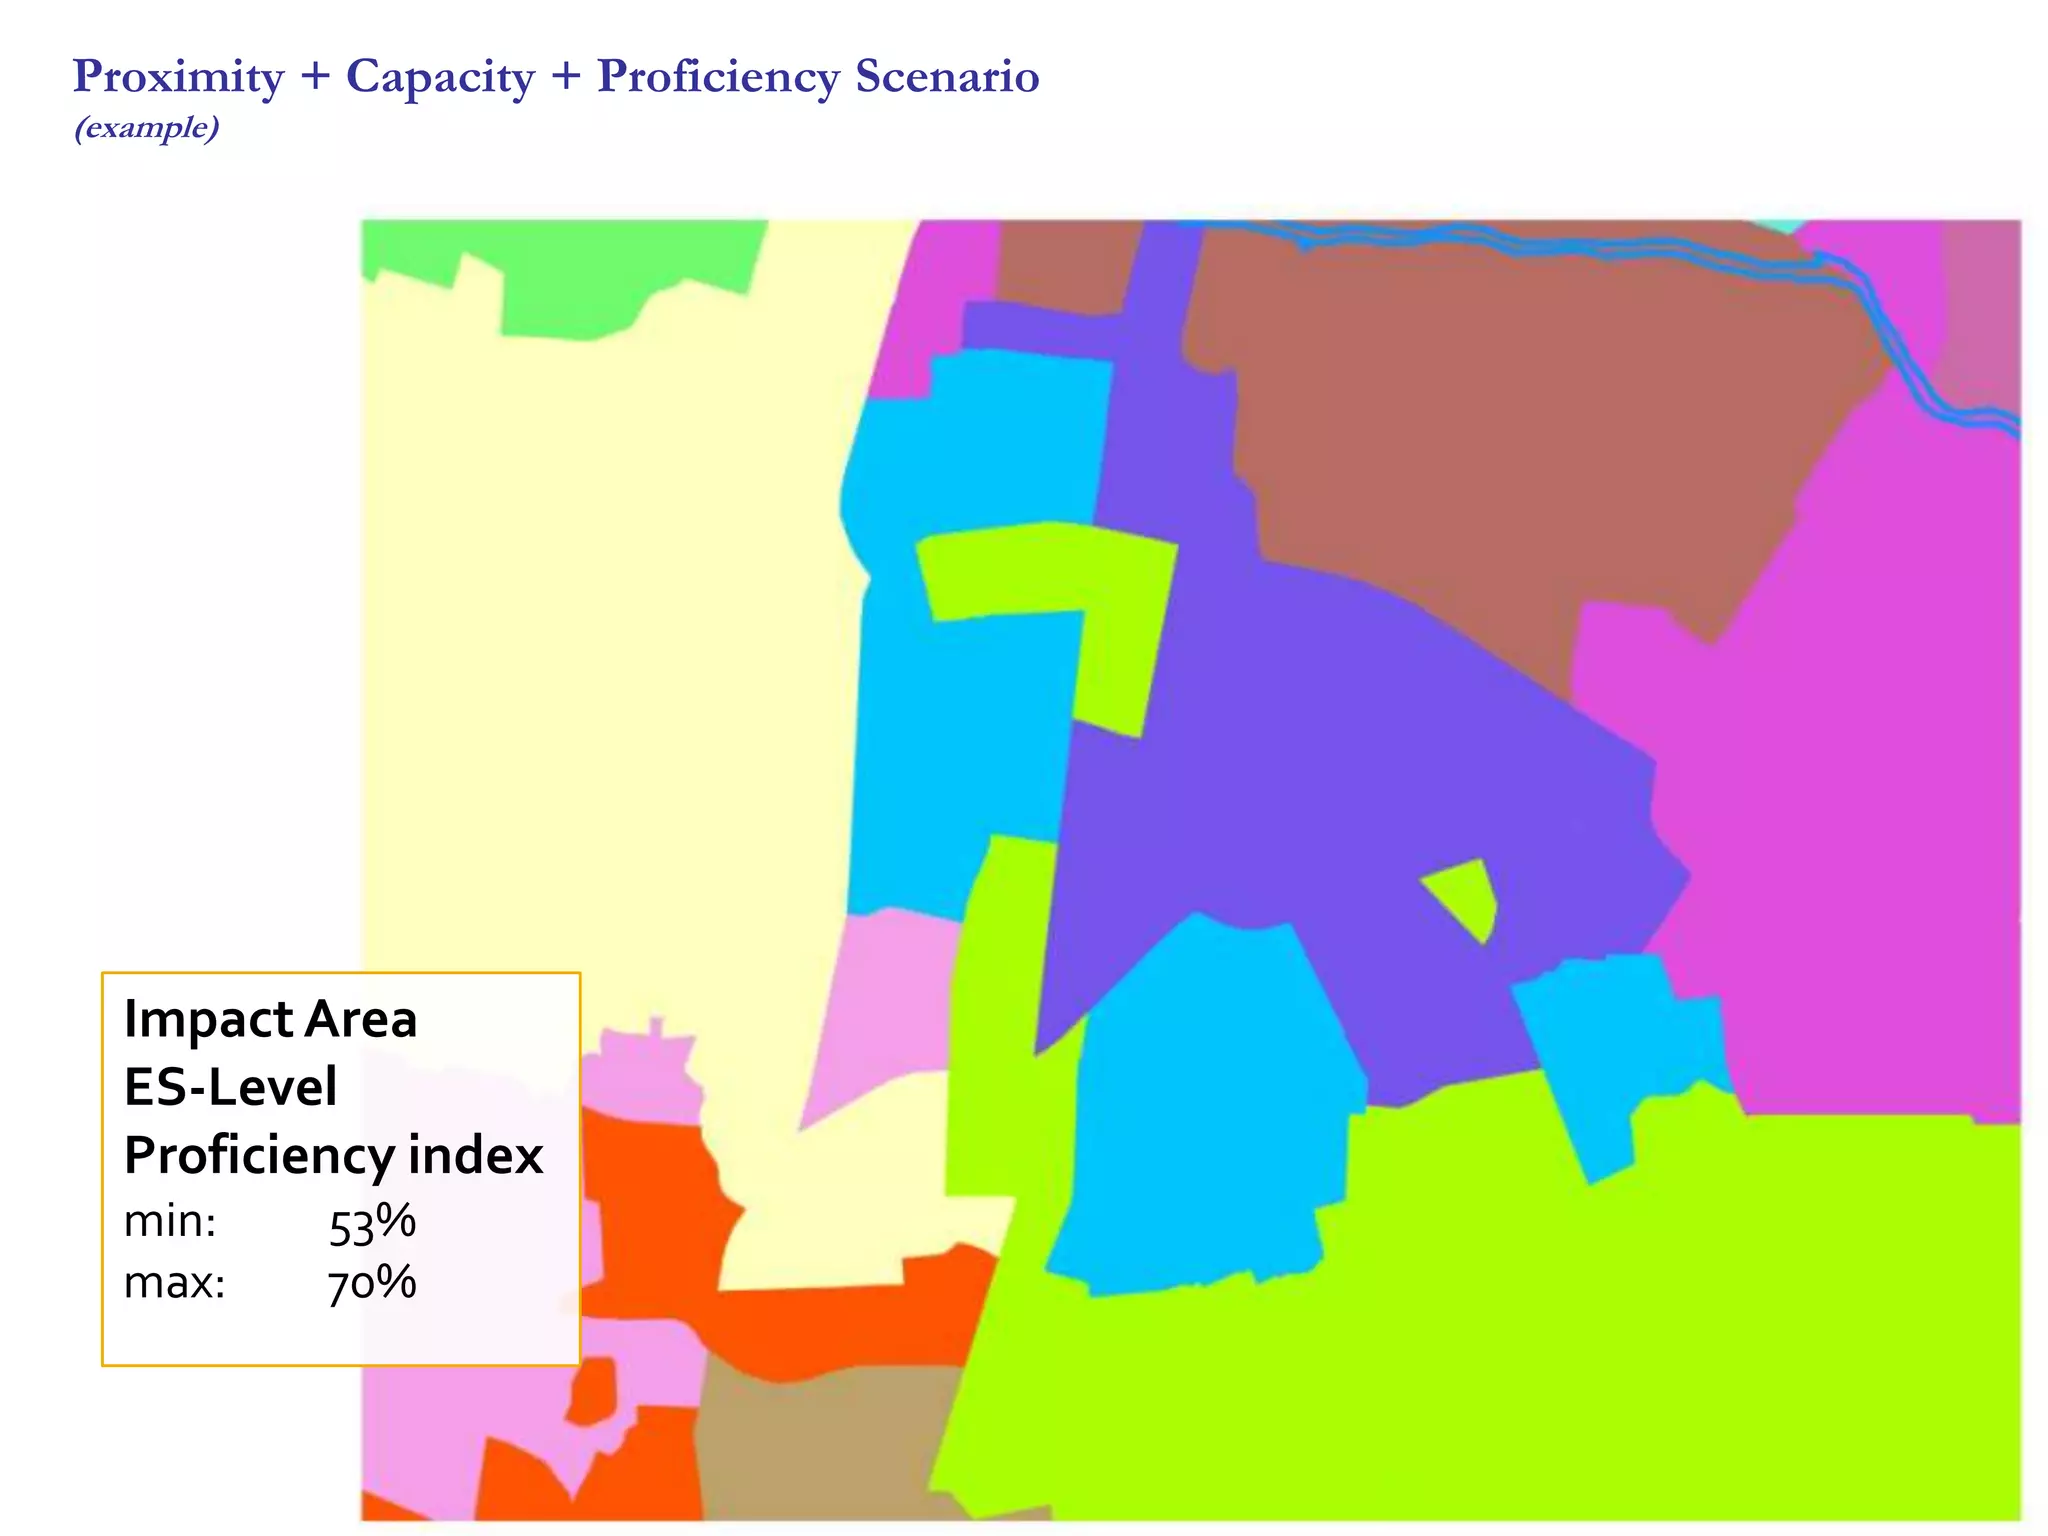
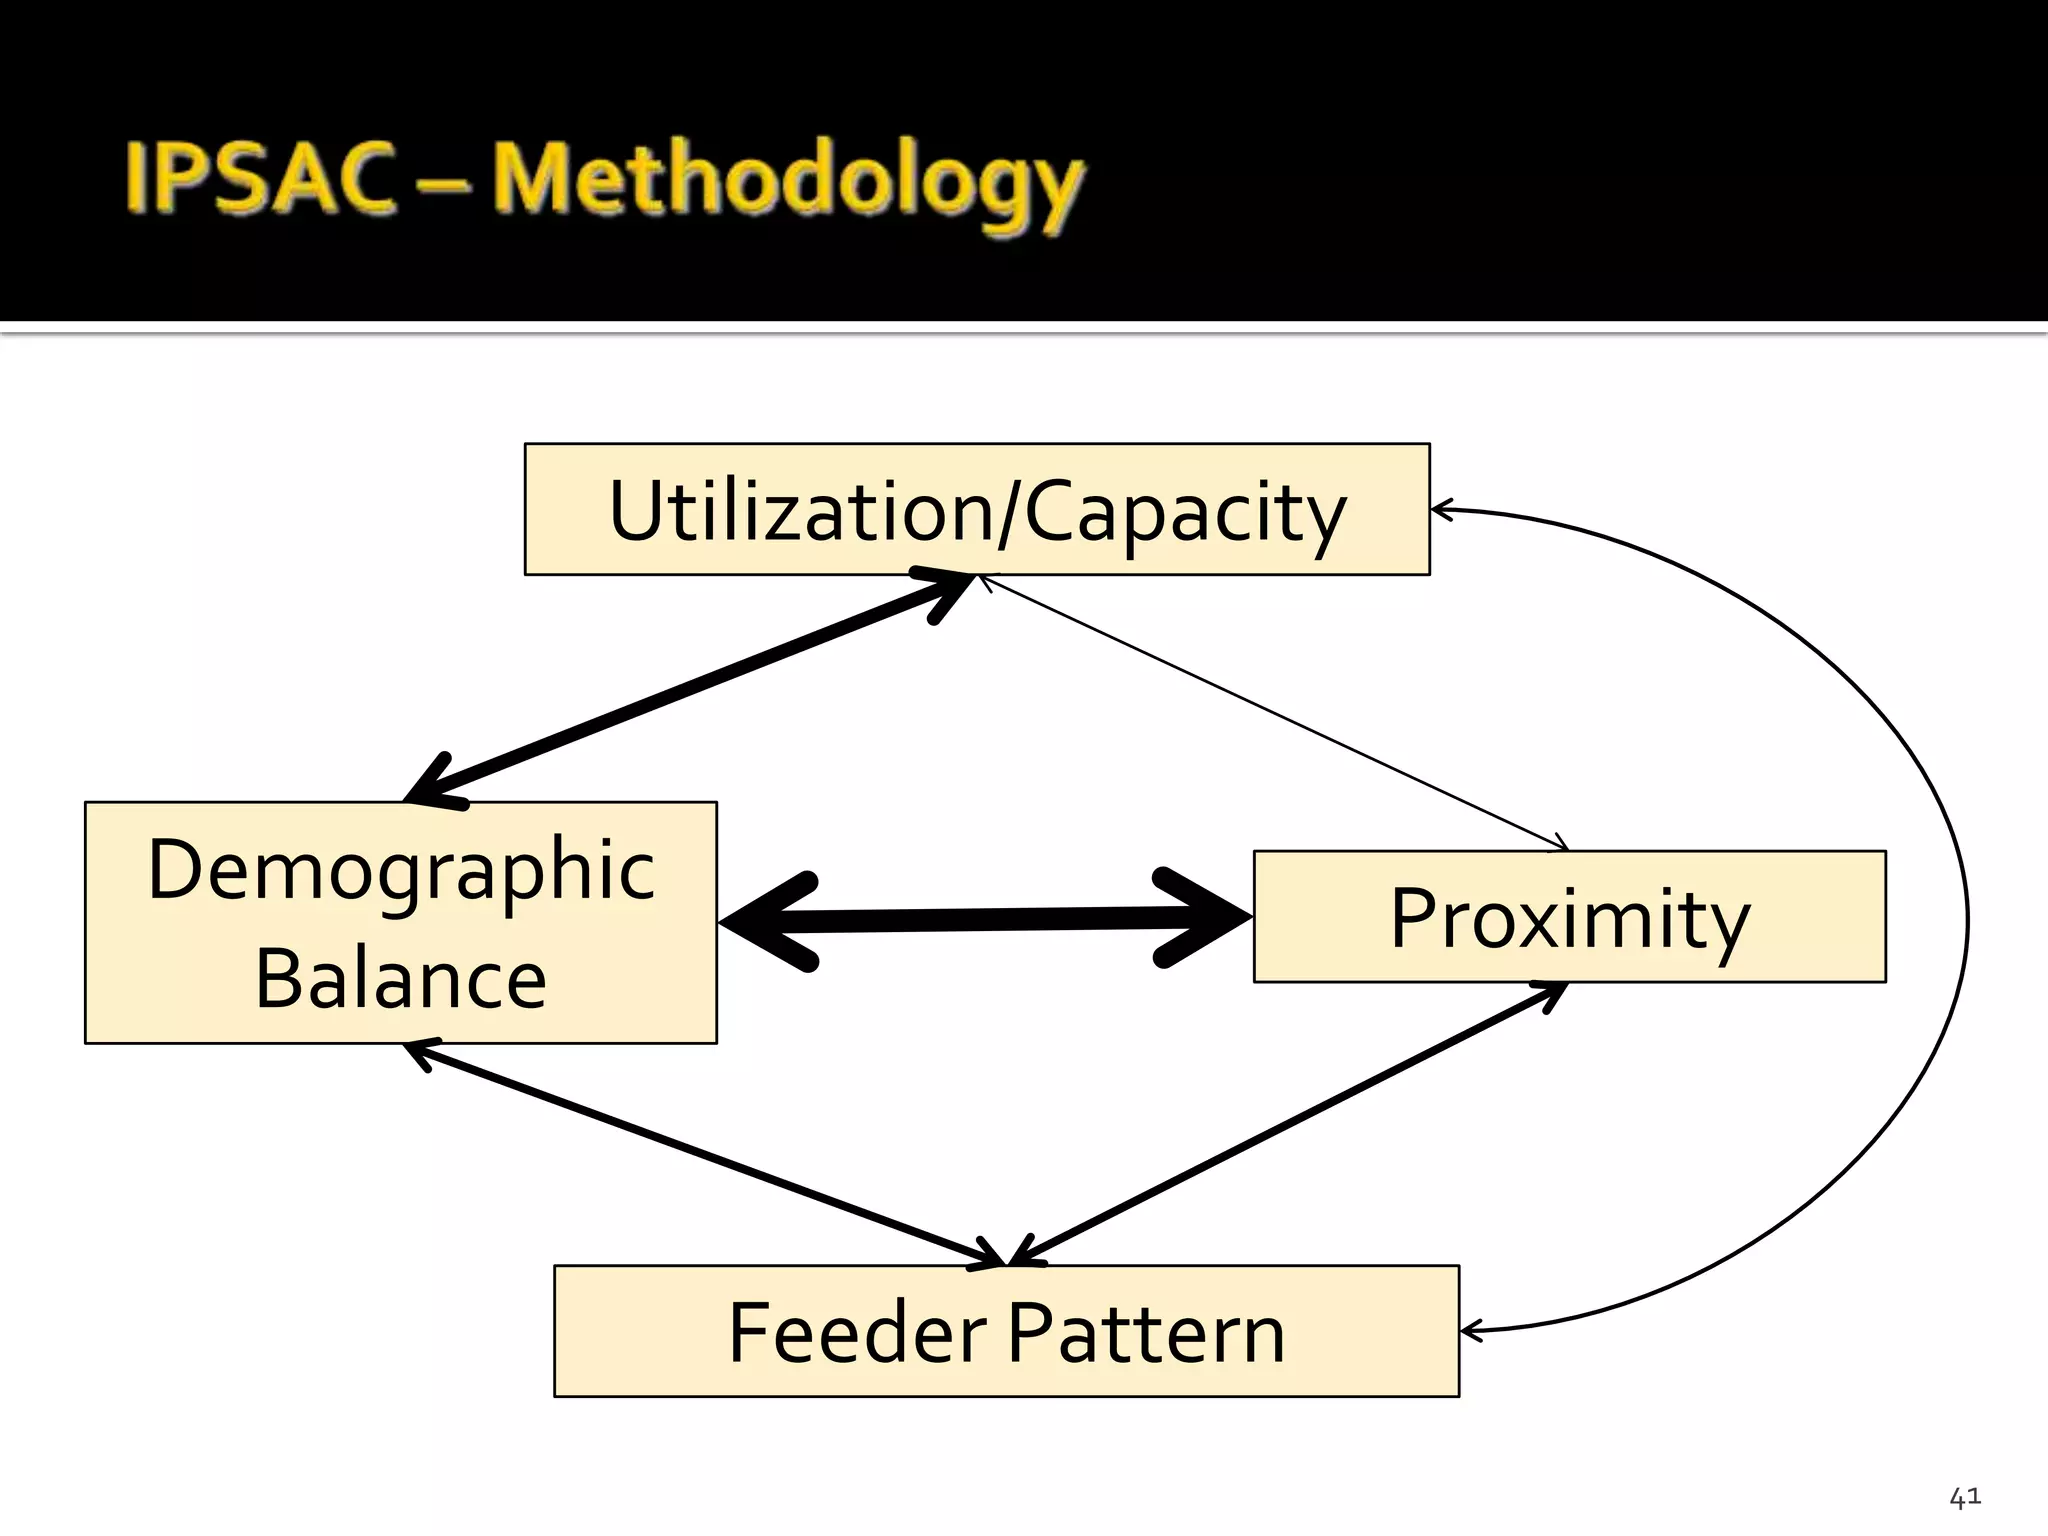
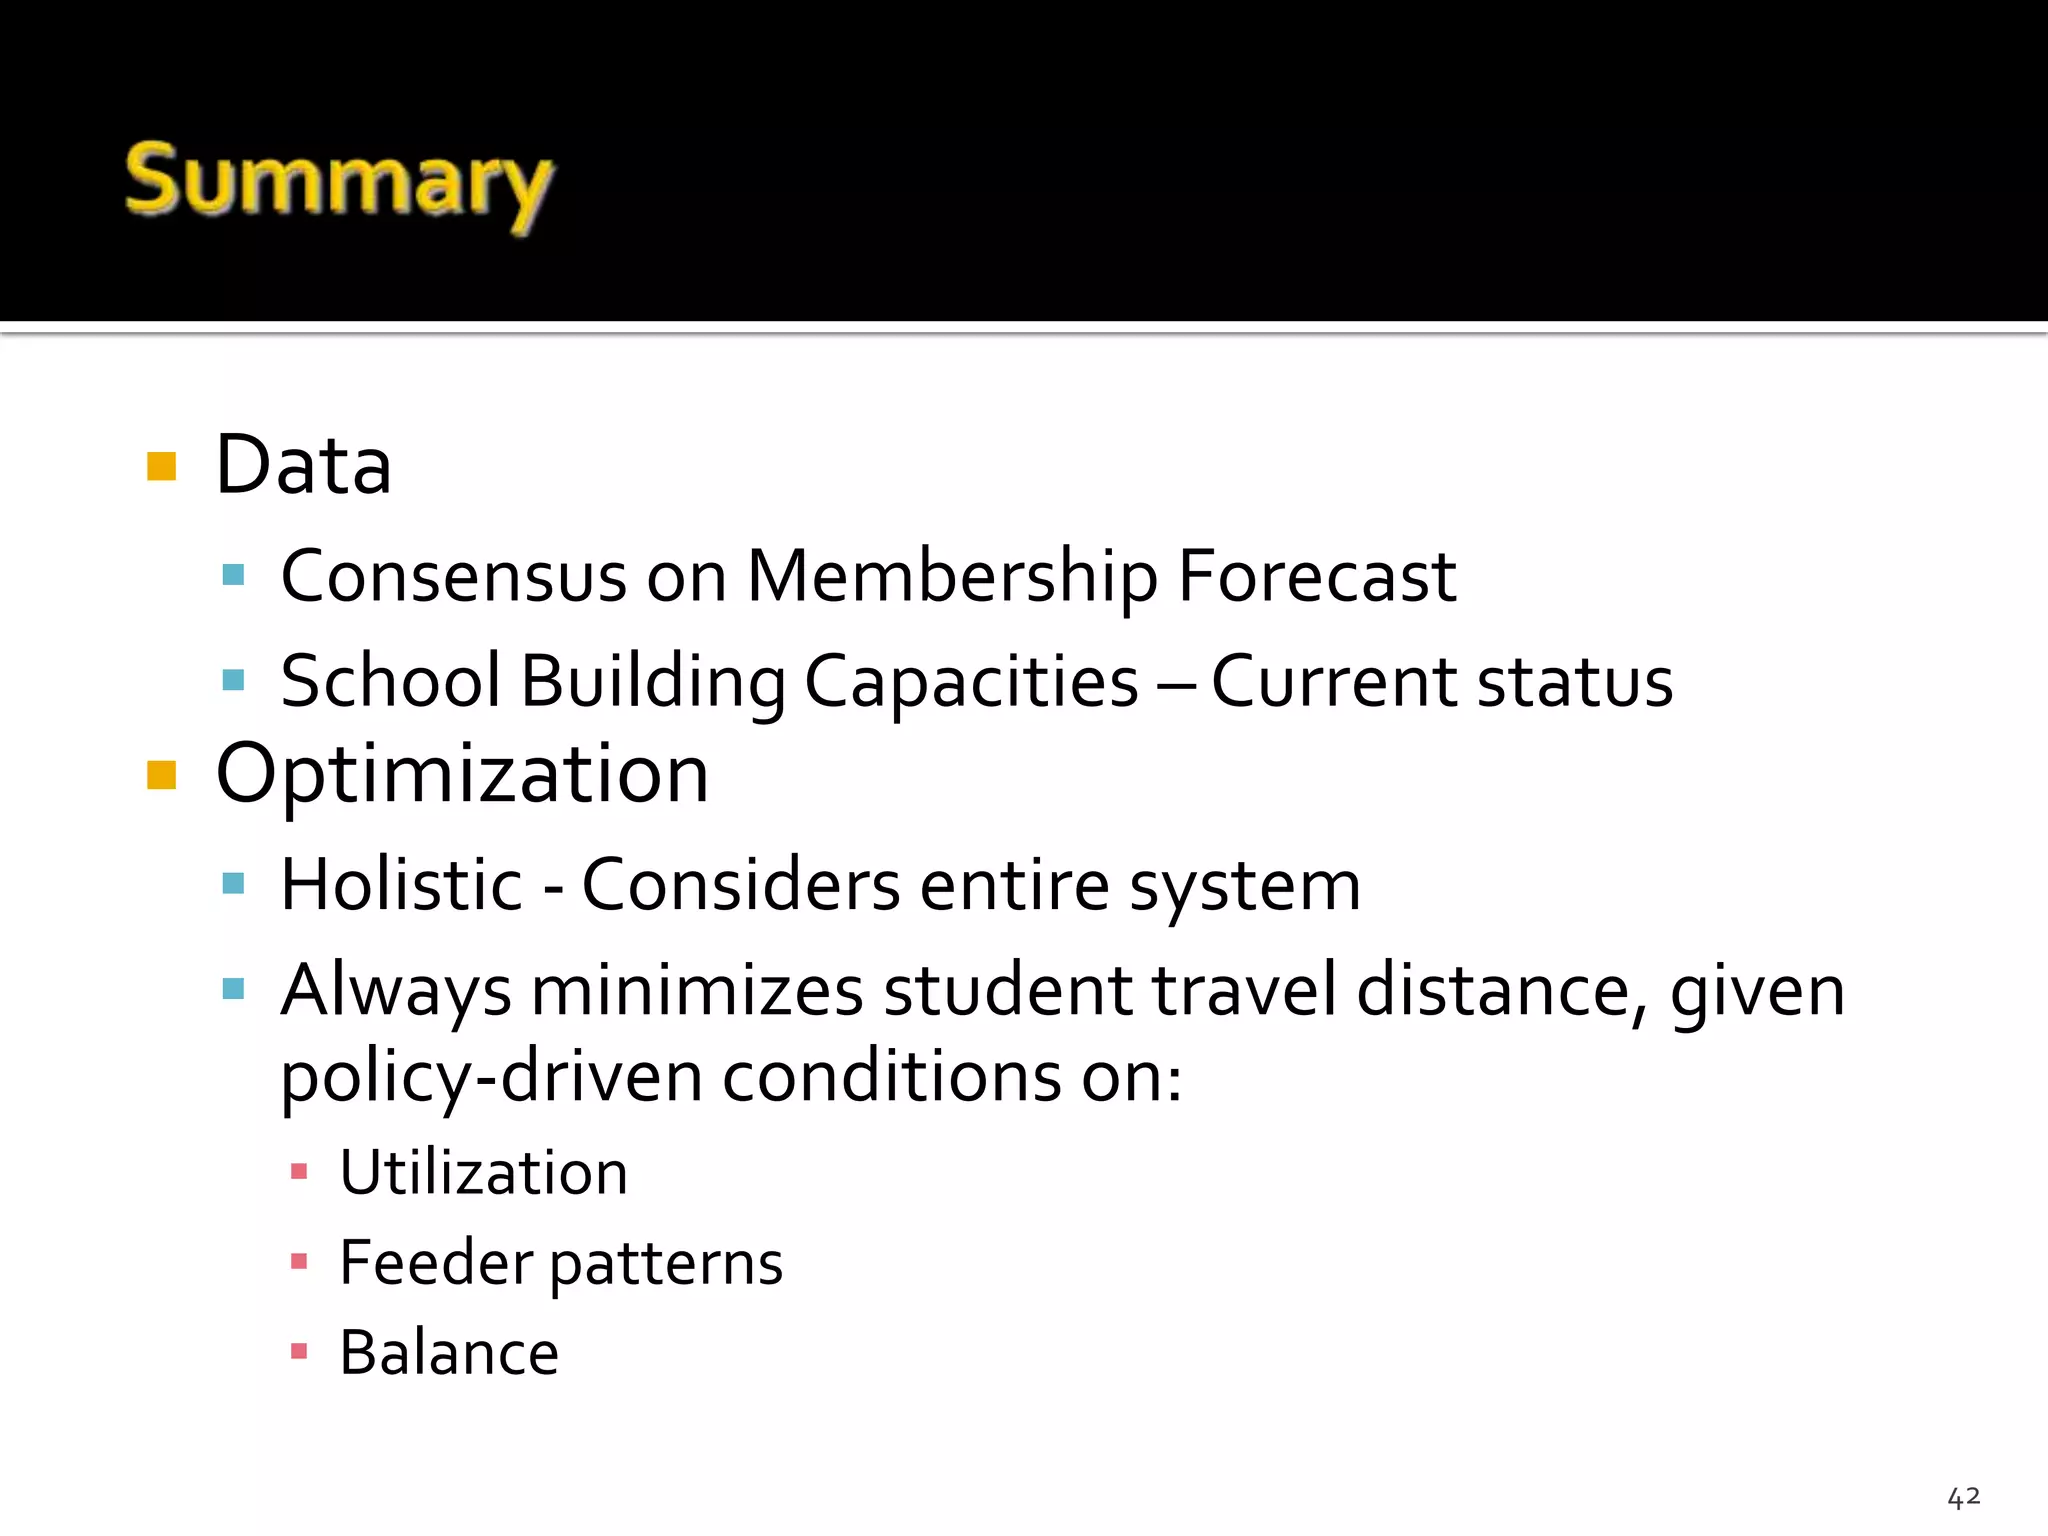
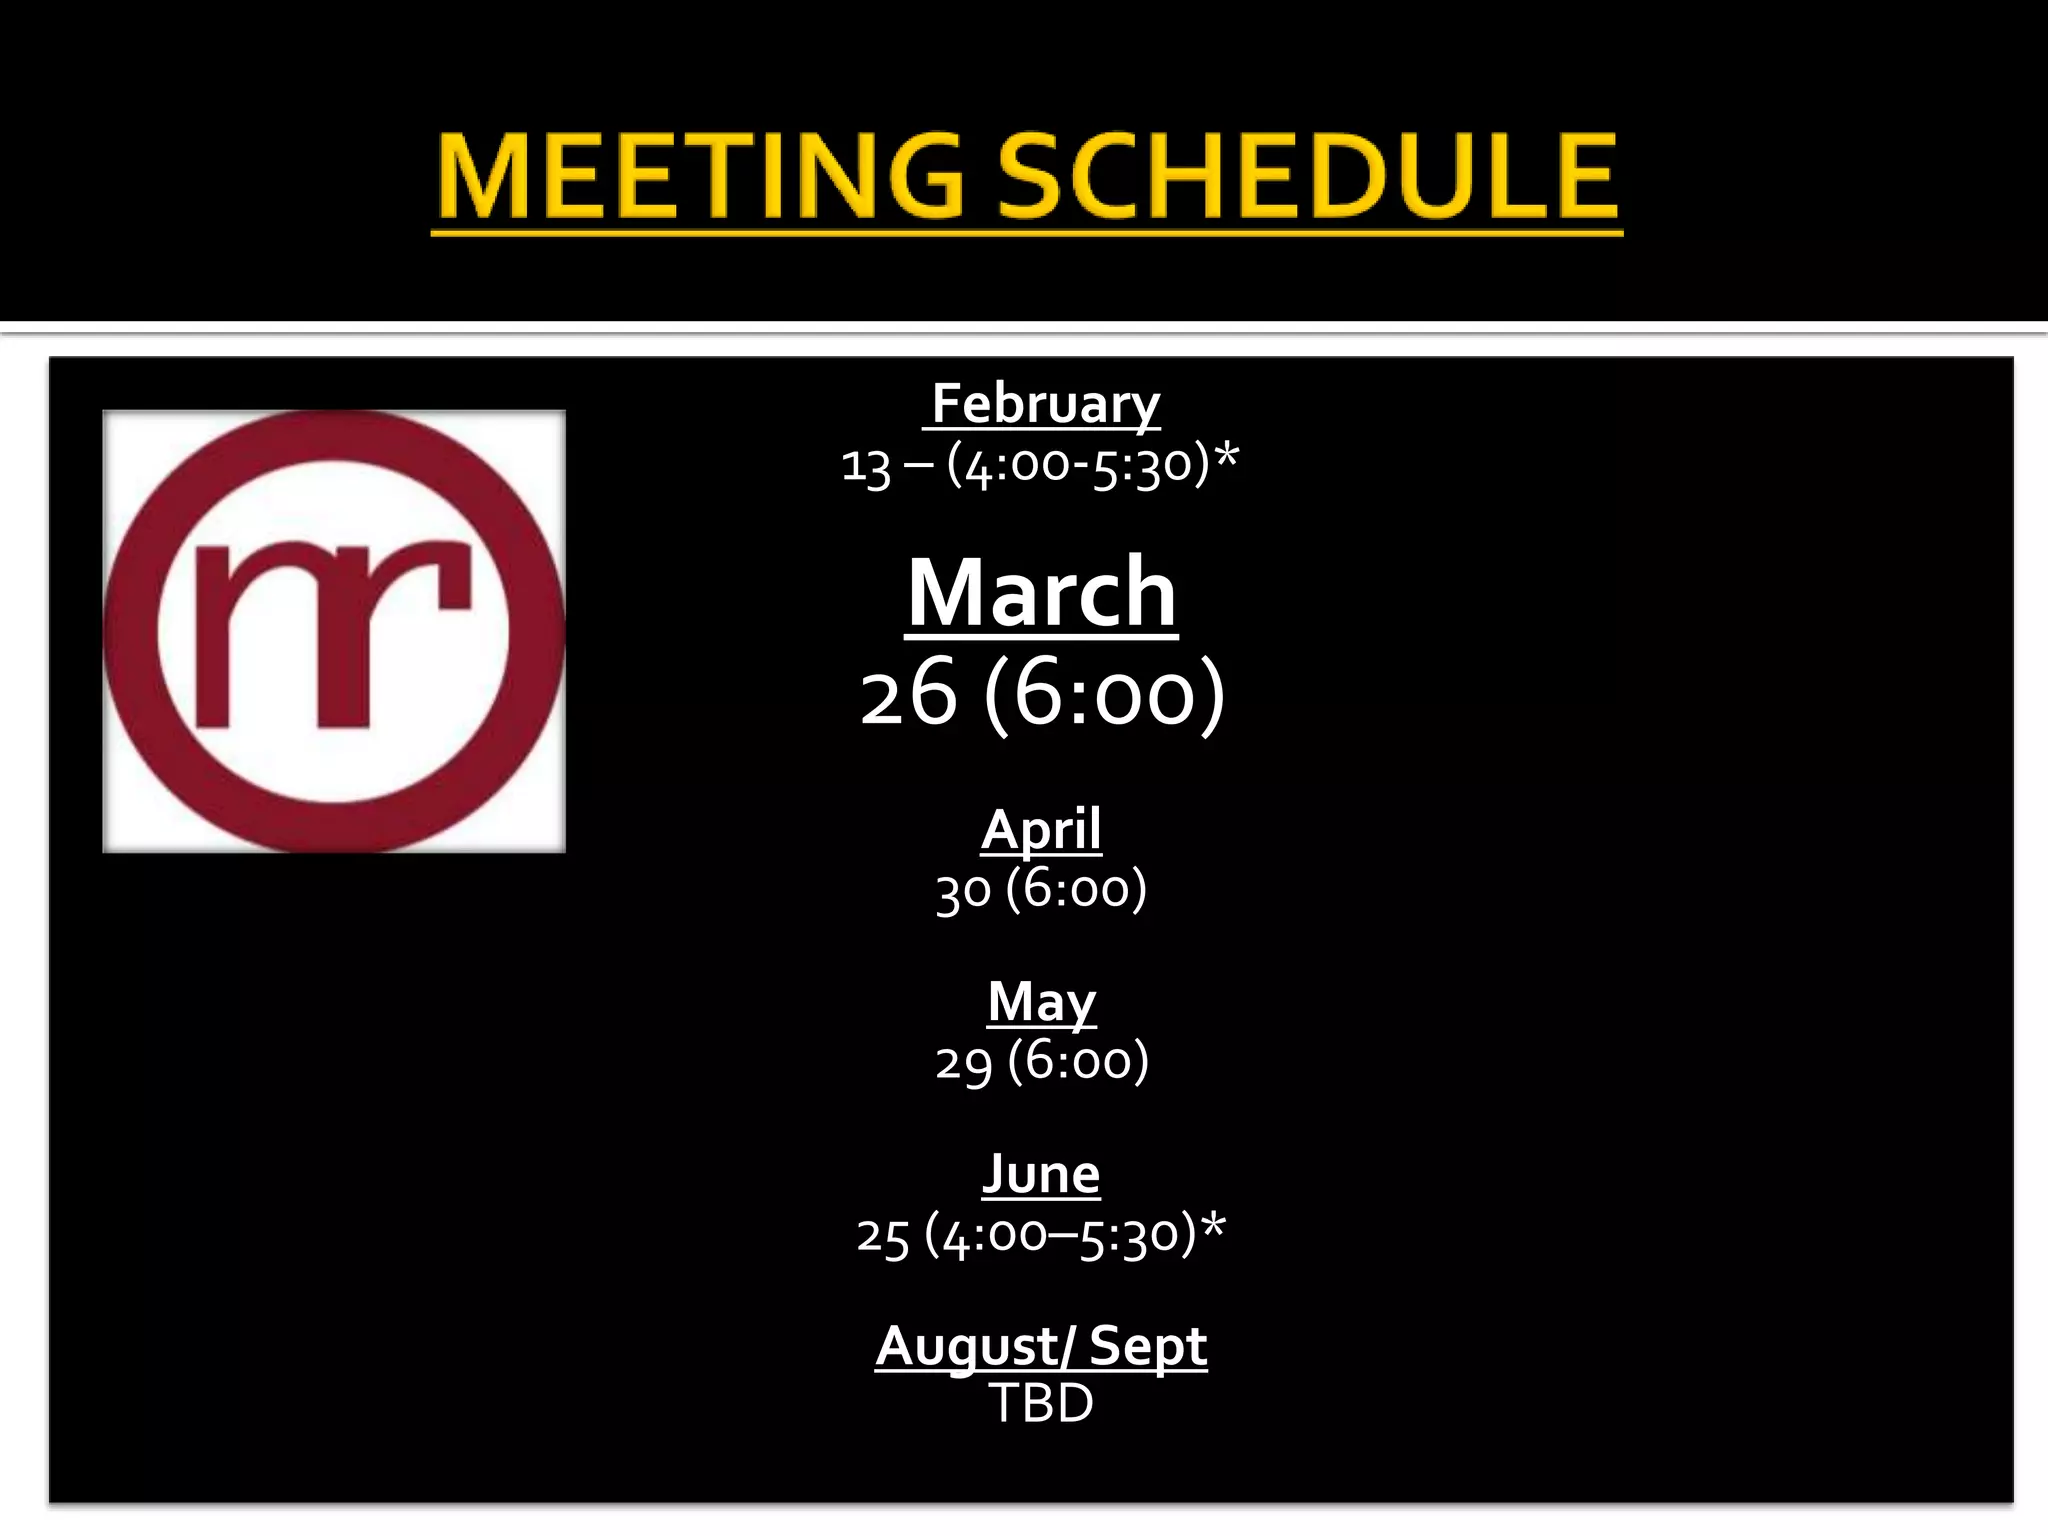
STUDENT REASSIGNMENT COMMITTEE MEETING
                                     Media Center, Nash Central High School
                                           Monday, February 13, 2012
                                                      4:00

Call to Order

Roll Call

                                      Approval of the Minutes from the January 30,
                                          Committee Organizational Meeting

Committee Operating Procedures


                                       Understanding the Optimization Process
                                                 Mike Miller ORED
Report to School Board 2/27/12

Questions

                                                  Next Meeting
                                      Out of Capacity table and Scenario Data
                                                Monday, March 26
                                                        6:00
                                                                                     3
Nash-Rocky Mount Public Schools
   Transparent
   Lines of Communications
   Committee Meetings
     Open to the public
   Website
     Information posted immediately after each meeting
   E-mail/ Phone Line
     An e-mail address to answer questions/ receive
      feedback etc has been established to ensure seamless
      communication and to make all information readily
      available to the public.
     A phone line has been established for those with limited
      or no internet access to provide feedback to the
      committee.
Jan-Aug 2012          Aug - 2012         Aug – Dec 2012             August 2013
    Committee           Committee        Public Input/ Community
   Deliberations/    Recommendations           Engagement          Implementation
Monthly Reports to    Presented to the
 the School Board      School Board        Board of Education
                                               Approval


                                                                               6
Public Engagement

             Board of
            Education


            Committee Chairs


                               Technical Support

Community     Committee
 Feedback                           ORED
                                     Staff            7
   Contiguous boundaries:
     Attempt to maintain contiguous school boundaries without using
      satellite attendance areas.

   Respect neighborhoods:
     Avoid dividing easily recognized “neighborhoods” or identified
      “developments” or “sub- divisions” unless it is necessary to meet
      other guidelines. Whenever possible and practical use major
      highways, railroads, rivers, and streams as natural boundaries.

   Proximity to schools:
     While it is recognized that all students cannot be assigned to their
      closest school, consider students proximity to other schools when
      creating school boundaries.


                                                                             8
   Modify feeder systems:
     In order to maximize facility use and establish reasonable numbers of students at
      each site, consider the use of 6 middle school feeder systems instead of 5. This
      would allow smaller, more instructionally suited middle schools and less
      dependence on mobile classrooms.

   Stay within enrollment capacities:
     Unless it is likely that a school enrollment will be declining, assign students to the
      four high schools in a way that their enrollments are under established capacities.

   Consider anticipated growth:
     Enrollment growth patterns should be taken into consideration, where feasible, to
      ensure that anticipated growth will not adversely impact one school significantly
      more than the others.

   Enrollment balance:
     In keeping with the intent of SB612, attempt to balance the percentage of
      academic and economic populations at each middle and high school.
                                                                                          9
   February 13 – Understanding the Optimization
    Process

   March 26 – Out of Capacity table and Scenario Data
   April 30 – Scenario Review and Revision
   May 29 – Scenario Review and Revision
   June 25 – Final Scenario Presentation


                                                         10
Michael Miller, Program Manager
Operations Research and Education Laboratory (OREd)
Institute for Transportation Research and Education
Centennial Campus
North Carolina State University


                        Nash-Rocky Mount Public Schools
   Data Collection/Compilation
     GIS data
      ▪ Geocoding complete: School years 2006-07, 2008-
        09, 2010-11, 2011-12
      ▪ Planning Segment review: On-going
     District membership trends
      ▪ NC DPI ADM for Month-One
     School building capacities


                                                          12
Planning Segment
Review
(Using current parcel data and
2011-12 NRMPS boundaries)


 Segment boundary
 before adjustment


 Segment boundary
 after adjustment


                                 13
+ 7 RLB per year


                   14
-310 K-12 per year


                     15
Forecast Models:   (4,3,2,1)   (1,1,1,1)   Optimal


                                                     16
(Using Optimal Forecast Model)
                                 17
   Forecast Options:

     Flat (Recommended)
     ▪ Capacity Adjustments for Growth Potential
     Optimal Forecast Model


                                                   18
Gain - HS Zones

   K-12 student count
   By residence
   2008-09 to 2011-12


                         19
Gain - ES Zones

   K-12 student count
   By residence
   2008-09 to 2011-12


                         20
Consensus on Forecast Options?

 Flat (Recommended)
 ▪ Capacity Adjustments for Growth Potential
 Optimal Forecast Model


                                               21
   Assumptions
     Current classroom/program configuration
     “Brick and Mortar” capacity
     Functional capacity: 95%


                                                22
Membership (DPI Month-
         School                                    Capacity   Utilization
                               One ADM)
Bailey Elem                        641               664         97%
Baskerville Elem                   359               427         84%
Benvenue Elem                      752               668        113%
Cedar Grove Elem                   204               223         91%
Coopers Elem                       657               601        109%
Johnson Elem                       470               575         82%
Englewood Elem (3-5)               508               508        100%
Hubbard Elem                       478               512         93%
Middlesex Elem                     357               418         85%
Nashville Elem                     734               682        107%
Pope Elem                          274               311         88%
Red Oak Elem (K-2)                 299               335         89%
Spring Hope Elem                   546               542        101%
Swift Creek Elem (3-5)             317               475         67%
Williford Elem                     418               581         72%
Winstead Ave. Elem(K-2)            532               625         85%
Total Elementary (K-5)            7546              8147         93%
                                                                            23
   Current stated ES capacity: 8147
   Current ES membership:       7546
   8 schools at or above 90% utilization
   5 schools at or above 100% utilization
   37 mobile units (58 teaching stations/
    classrooms) serving 11 of 16 elementary
    schools.


                                              24
Membership (DPI Month-
         School                               Capacity   Utilization
                          One ADM)
Nash Central Mid              605               670         90%
Edwards Mid                   731               827         88%
Parker Mid                    420               557         75%
Red Oak Mid                   919               850        108%
Southern Nash Mid             1081              850        127%
Total Middle (6-8)           3756              3754        100%


                     Membership (DPI Month-
         School                               Capacity   Utilization
                          One ADM)
Nash Central High             1229             1150        107%
Northern Nash High            1210             1150        105%
Rocky Mount High              1151             1390         83%
Southern Nash High           1260              1068        118%
Total High (9-12)            4850              4758        102%


                                                                       25
   Current stated MS capacity: 3754
   Current MS membership:       3756
   3 schools at or above 90% utilization
   2 schools at or above 100% utilization
   15 mobile units (28 teaching stations/
    classrooms) serving 4 of 5 middle schools.


                                                 26
   Current stated HS capacity: 4758
   Current HS membership:        4850
   3 schools at or above 100% utilization
   16 mobile units (16 teaching stations/
    classrooms) serving 3 of 4 high schools (and
    Early College High).


                                                   27
Membership (DPI Month-
         School
                                 One ADM)
Greene Alt. (6-12)                   95
Early College High (9-12)            207
Total                                302


                            Alternative Schools

       Early College High currently over-utilized
       Alternative Schools not included in
        reassignment process.


                                                     28
OPTIMIZATION
               29
Operations Research techniques enable users to solve large-
scale optimization problems involving many variables and
constraints.

The driving variable in the optimization algorithm is total
distance traveled by students to school. The solutions
generated by these OR techniques are optimal in the following
way:

         the system-wide student travel distance is
       minimized while satisfying constraints such as
                     building capacity

                                                                30
OR techniques allow the
exploration of holistic
scenarios that can provide
maximum efficiency for
the entire district.


                             31
Optimal Attendance Zones

                 School      Balance index
Membership      building      allowance
 forecast      capacities   (Aggregate measure)


             Optimization
              Algorithm


 Optimal Attendance Zones
                                                  32
The optimization process
examines multiple school
site/assignment schemes
and continually re-calculates
the constraint variables for
each school in the impacted
area...
Ultimately determining the
optimal school site/assignment
that will:

1. Minimize transportation costs
                and
2. Satisfy the constraints

within the impact area.


Optimal scenarios can be then
fine-tuned by staff to address
transportation and other issues.
Located southeast of Raleigh/Durham/Chapel Hill, Johnston
County NC has experienced tremendous growth over the last
two decades. As an OREd client since 1990, Johnston County
Schools have used the data-driven planning tools in IPSAC to
locate new school sites and draw attendance zones to
accommodate and increasing student population.

In 2010, JCS opened two new high schools – the culmination of
years of careful planning and hard work.


                                                                35
Utilization/Capacity


Demographic
                                Proximity
  Balance


              Feeder Pattern
                                            38
Proximity + Capacity Scenario
(example)


   Impact Area
   ES-Level
   Proficiency index
   min:     35%
   max:     78%
Proximity + Capacity + Proficiency Scenario
(example)


   Impact Area
   ES-Level
   Proficiency index
   min:     53%
   max:     70%
Utilization/Capacity


Demographic
                                Proximity
  Balance


              Feeder Pattern
                                            41
   Data
     Consensus on Membership Forecast
     School Building Capacities – Current status
   Optimization
     Holistic - Considers entire system
     Always minimizes student travel distance, given
     policy-driven conditions on:
      ▪ Utilization
      ▪ Feeder patterns
      ▪ Balance
                                                        42
Nash-Rocky Mount Public Schools
   Transparent
   Lines of Communications
   Committee Meetings
     Open to the public
   Website
     Information posted immediately after each meeting
   E-mail/ Phone Line
     An e-mail address to answer questions/ receive
      feedback etc has been established to ensure seamless
      communication and to make all information readily
      available to the public.
     A phone line has been established for those with limited
      or no internet access to provide feedback to the
      committee.
February
13 – (4:00-5:30)*

 March
26 (6:00)
     April
   30 (6:00)
     May
   29 (6:00)
      June
25 (4:00–5:30)*
 August/ Sept
    TBD
QUESTIONS

Reassignment committee meeting feb 13 - draft2

  • 3.
    STUDENT REASSIGNMENT COMMITTEEMEETING Media Center, Nash Central High School Monday, February 13, 2012 4:00 Call to Order Roll Call Approval of the Minutes from the January 30, Committee Organizational Meeting Committee Operating Procedures Understanding the Optimization Process Mike Miller ORED Report to School Board 2/27/12 Questions Next Meeting Out of Capacity table and Scenario Data Monday, March 26 6:00 3
  • 4.
  • 5.
    Transparent  Lines of Communications  Committee Meetings  Open to the public  Website  Information posted immediately after each meeting  E-mail/ Phone Line  An e-mail address to answer questions/ receive feedback etc has been established to ensure seamless communication and to make all information readily available to the public.  A phone line has been established for those with limited or no internet access to provide feedback to the committee.
  • 6.
    Jan-Aug 2012 Aug - 2012 Aug – Dec 2012 August 2013 Committee Committee Public Input/ Community Deliberations/ Recommendations Engagement Implementation Monthly Reports to Presented to the the School Board School Board Board of Education Approval 6
  • 7.
    Public Engagement Board of Education Committee Chairs Technical Support Community Committee Feedback ORED Staff 7
  • 8.
    Contiguous boundaries: Attempt to maintain contiguous school boundaries without using satellite attendance areas.  Respect neighborhoods: Avoid dividing easily recognized “neighborhoods” or identified “developments” or “sub- divisions” unless it is necessary to meet other guidelines. Whenever possible and practical use major highways, railroads, rivers, and streams as natural boundaries.  Proximity to schools: While it is recognized that all students cannot be assigned to their closest school, consider students proximity to other schools when creating school boundaries. 8
  • 9.
    Modify feeder systems: In order to maximize facility use and establish reasonable numbers of students at each site, consider the use of 6 middle school feeder systems instead of 5. This would allow smaller, more instructionally suited middle schools and less dependence on mobile classrooms.  Stay within enrollment capacities: Unless it is likely that a school enrollment will be declining, assign students to the four high schools in a way that their enrollments are under established capacities.  Consider anticipated growth: Enrollment growth patterns should be taken into consideration, where feasible, to ensure that anticipated growth will not adversely impact one school significantly more than the others.  Enrollment balance: In keeping with the intent of SB612, attempt to balance the percentage of academic and economic populations at each middle and high school. 9
  • 10.
    February 13 – Understanding the Optimization Process  March 26 – Out of Capacity table and Scenario Data  April 30 – Scenario Review and Revision  May 29 – Scenario Review and Revision  June 25 – Final Scenario Presentation 10
  • 11.
    Michael Miller, ProgramManager Operations Research and Education Laboratory (OREd) Institute for Transportation Research and Education Centennial Campus North Carolina State University Nash-Rocky Mount Public Schools
  • 12.
    Data Collection/Compilation  GIS data ▪ Geocoding complete: School years 2006-07, 2008- 09, 2010-11, 2011-12 ▪ Planning Segment review: On-going  District membership trends ▪ NC DPI ADM for Month-One  School building capacities 12
  • 13.
    Planning Segment Review (Using currentparcel data and 2011-12 NRMPS boundaries) Segment boundary before adjustment Segment boundary after adjustment 13
  • 14.
    + 7 RLBper year 14
  • 15.
  • 16.
    Forecast Models: (4,3,2,1) (1,1,1,1) Optimal 16
  • 17.
  • 18.
    Forecast Options:  Flat (Recommended) ▪ Capacity Adjustments for Growth Potential  Optimal Forecast Model 18
  • 19.
    Gain - HSZones  K-12 student count  By residence  2008-09 to 2011-12 19
  • 20.
    Gain - ESZones  K-12 student count  By residence  2008-09 to 2011-12 20
  • 21.
    Consensus on ForecastOptions?  Flat (Recommended) ▪ Capacity Adjustments for Growth Potential  Optimal Forecast Model 21
  • 22.
    Assumptions  Current classroom/program configuration  “Brick and Mortar” capacity  Functional capacity: 95% 22
  • 23.
    Membership (DPI Month- School Capacity Utilization One ADM) Bailey Elem 641 664 97% Baskerville Elem 359 427 84% Benvenue Elem 752 668 113% Cedar Grove Elem 204 223 91% Coopers Elem 657 601 109% Johnson Elem 470 575 82% Englewood Elem (3-5) 508 508 100% Hubbard Elem 478 512 93% Middlesex Elem 357 418 85% Nashville Elem 734 682 107% Pope Elem 274 311 88% Red Oak Elem (K-2) 299 335 89% Spring Hope Elem 546 542 101% Swift Creek Elem (3-5) 317 475 67% Williford Elem 418 581 72% Winstead Ave. Elem(K-2) 532 625 85% Total Elementary (K-5) 7546 8147 93% 23
  • 24.
    Current stated ES capacity: 8147  Current ES membership: 7546  8 schools at or above 90% utilization  5 schools at or above 100% utilization  37 mobile units (58 teaching stations/ classrooms) serving 11 of 16 elementary schools. 24
  • 25.
    Membership (DPI Month- School Capacity Utilization One ADM) Nash Central Mid 605 670 90% Edwards Mid 731 827 88% Parker Mid 420 557 75% Red Oak Mid 919 850 108% Southern Nash Mid 1081 850 127% Total Middle (6-8) 3756 3754 100% Membership (DPI Month- School Capacity Utilization One ADM) Nash Central High 1229 1150 107% Northern Nash High 1210 1150 105% Rocky Mount High 1151 1390 83% Southern Nash High 1260 1068 118% Total High (9-12) 4850 4758 102% 25
  • 26.
    Current stated MS capacity: 3754  Current MS membership: 3756  3 schools at or above 90% utilization  2 schools at or above 100% utilization  15 mobile units (28 teaching stations/ classrooms) serving 4 of 5 middle schools. 26
  • 27.
    Current stated HS capacity: 4758  Current HS membership: 4850  3 schools at or above 100% utilization  16 mobile units (16 teaching stations/ classrooms) serving 3 of 4 high schools (and Early College High). 27
  • 28.
    Membership (DPI Month- School One ADM) Greene Alt. (6-12) 95 Early College High (9-12) 207 Total 302 Alternative Schools  Early College High currently over-utilized  Alternative Schools not included in reassignment process. 28
  • 29.
  • 30.
    Operations Research techniquesenable users to solve large- scale optimization problems involving many variables and constraints. The driving variable in the optimization algorithm is total distance traveled by students to school. The solutions generated by these OR techniques are optimal in the following way: the system-wide student travel distance is minimized while satisfying constraints such as building capacity 30
  • 31.
    OR techniques allowthe exploration of holistic scenarios that can provide maximum efficiency for the entire district. 31
  • 32.
    Optimal Attendance Zones School Balance index Membership building allowance forecast capacities (Aggregate measure) Optimization Algorithm Optimal Attendance Zones 32
  • 33.
    The optimization process examinesmultiple school site/assignment schemes and continually re-calculates the constraint variables for each school in the impacted area...
  • 34.
    Ultimately determining the optimalschool site/assignment that will: 1. Minimize transportation costs and 2. Satisfy the constraints within the impact area. Optimal scenarios can be then fine-tuned by staff to address transportation and other issues.
  • 35.
    Located southeast ofRaleigh/Durham/Chapel Hill, Johnston County NC has experienced tremendous growth over the last two decades. As an OREd client since 1990, Johnston County Schools have used the data-driven planning tools in IPSAC to locate new school sites and draw attendance zones to accommodate and increasing student population. In 2010, JCS opened two new high schools – the culmination of years of careful planning and hard work. 35
  • 38.
    Utilization/Capacity Demographic Proximity Balance Feeder Pattern 38
  • 39.
    Proximity + CapacityScenario (example) Impact Area ES-Level Proficiency index min: 35% max: 78%
  • 40.
    Proximity + Capacity+ Proficiency Scenario (example) Impact Area ES-Level Proficiency index min: 53% max: 70%
  • 41.
    Utilization/Capacity Demographic Proximity Balance Feeder Pattern 41
  • 42.
    Data  Consensus on Membership Forecast  School Building Capacities – Current status  Optimization  Holistic - Considers entire system  Always minimizes student travel distance, given policy-driven conditions on: ▪ Utilization ▪ Feeder patterns ▪ Balance 42
  • 43.
  • 44.
    Transparent  Lines of Communications  Committee Meetings  Open to the public  Website  Information posted immediately after each meeting  E-mail/ Phone Line  An e-mail address to answer questions/ receive feedback etc has been established to ensure seamless communication and to make all information readily available to the public.  A phone line has been established for those with limited or no internet access to provide feedback to the committee.
  • 45.
    February 13 – (4:00-5:30)* March 26 (6:00) April 30 (6:00) May 29 (6:00) June 25 (4:00–5:30)* August/ Sept TBD
  • 46.