This document summarizes research from a university on the benefits of co-teaching models in student teaching placements. Key findings include:
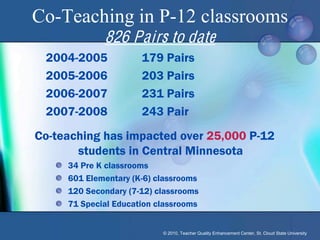
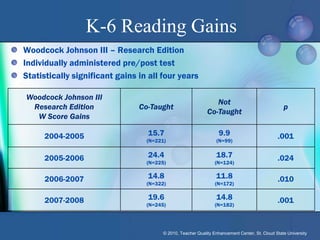
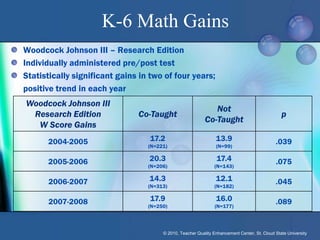
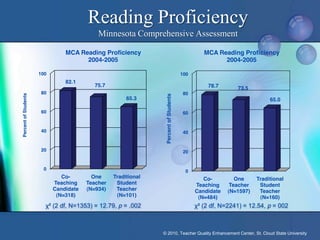
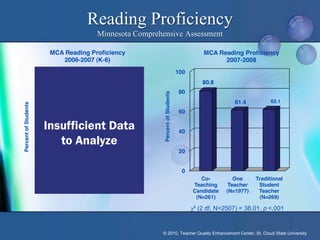
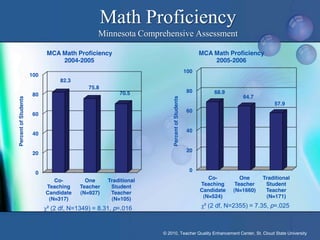
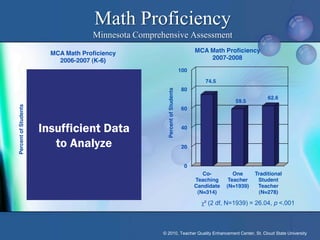
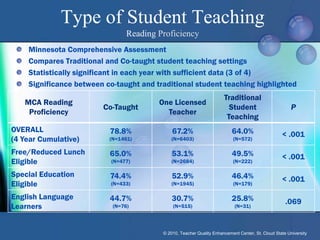
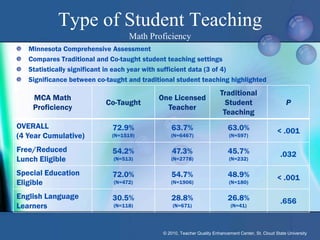
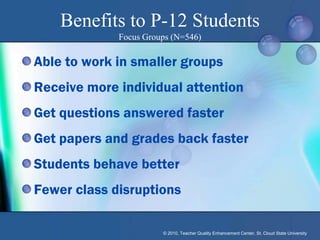
- P-12 students in co-taught classrooms showed statistically significant gains in reading and math proficiency compared to traditionally taught classrooms. Over 25,000 students were impacted.
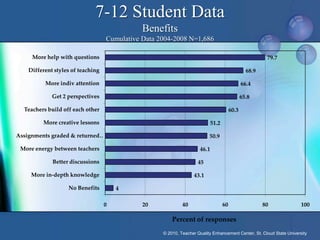
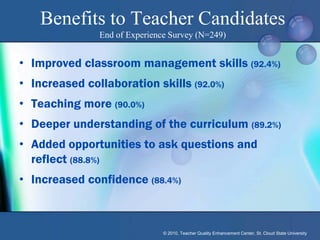
- Teacher candidates felt they taught more, improved classroom management skills, and gained confidence through co-teaching models compared to traditional models.
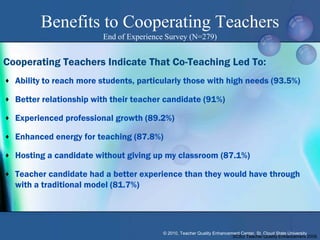
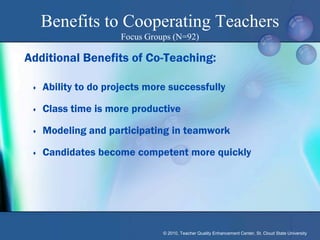
- Cooperating teachers reported benefits like reaching more students, professional growth, and hosting a candidate without giving up their classroom through co-teaching models.