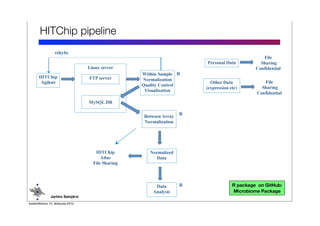
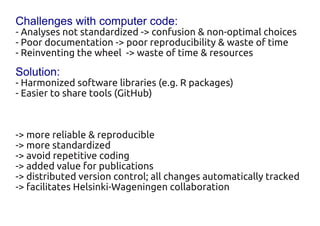
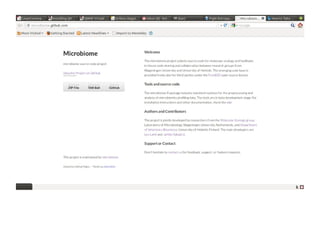
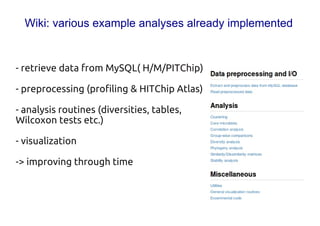
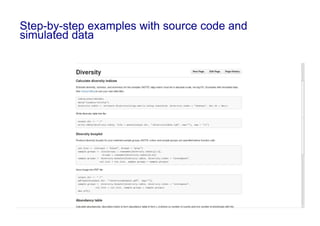
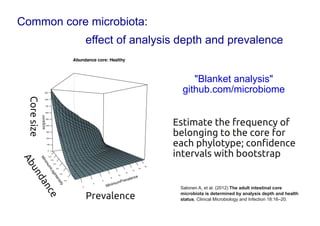
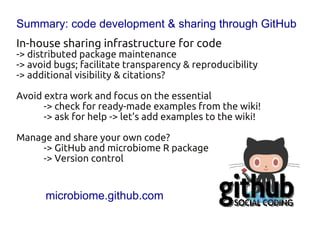
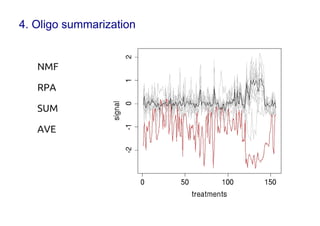
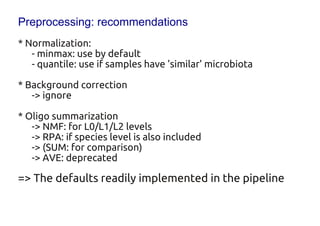
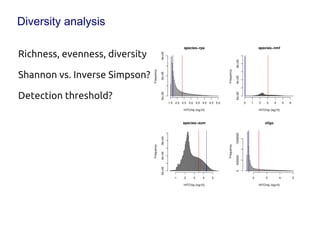
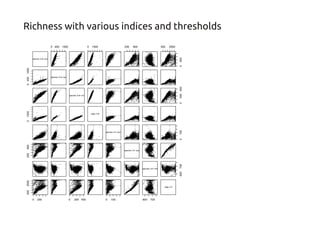
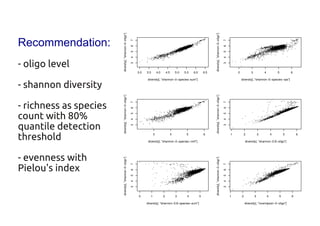
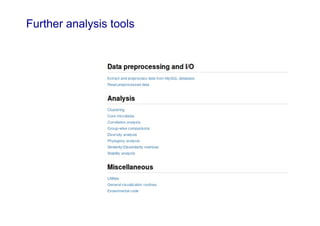
Code sharing for microbiomics
        Leo, Wageningen 7.9.201 2
Challenges with computer code:
- Analyses not standardized -> confusion & non-optimal choices
- Poor documentation -> poor reproducibility & waste of time
- Reinventing the wheel -> waste of time & resources
Solution:
- Harmonized software libraries (e.g. R packages)
- Easier to share tools (GitHub)


-> more reliable & reproducible
-> more standardized
-> avoid repetitive coding
-> added value for publications
-> distributed version control; all changes automatically tracked
-> facilitates Helsinki-Wageningen collaboration
Wiki: various example analyses already implemented


- retrieve data from MySQL( H/M/PITChip)
- preprocessing (profiling & HITChip Atlas)
- analysis routines (diversities, tables,
Wilcoxon tests etc.)
- visualization
-> improving through time
Step­by­step examples with source code and
simulated data
Common core microbiota:
              effect of analysis depth and prevalence


                                    "Blanket analysis"
                                 github.com/microbiome
 Core size


                               Estimate the frequency of
                               belonging to the core for
                               each phylotype; confidence
                               intervals with bootstrap
Ab
 un
    dan


                                Salonen A, et al. (2012) The adult intestinal core

              Prevalence
         ce


                                microbiota is determined by analysis depth and health
                                status, Clinical Microbiology and Infection 18:16–20.
Compatible with HITChip Atlas of Human Gut
         Microbiota (>3200 samples)
                                    45 studies - Standardized Platform


                >1 000 phylotypes


                                            >3000 samples
-> Compare your own data to HITChip data collections?
Differences to the old profiling script?
    -> Separate preprocessing from analysis
    -> Support modularity
-> removed outdated options & outputs from profiling script
1. Preprocessing: minimal output from profiling script:
- preprocessed data matrices (oligo/L1 /L2/species/absolute
scale) with NMF/RPA/SUM
- preprocessing log (parameter values etc.)
- quality control plots (heatmap)
2. Analysis & visualization routines
- based on profiling script output & done afterwards -> modular
- used when needed, not run by default
-> keeping it simple & storing disk space
Summary: code development & sharing through GitHub
In-house sharing infrastructure for code
-> distributed package maintenance
-> avoid bugs; facilitate transparency & reproducibility
-> additional visibility & citations?
Avoid extra work and focus on the essential
      -> check for ready-made examples from the wiki!
      -> ask for help -> let's add examples to the wiki!
Manage and share your own code?
    -> GitHub and microbiome R package
    -> Version control

      microbiome.github.com
To discuss
Do you have R code which could be useful for others?
-> let's polish, document & add it in the package!

Which tools to include?
- diversity/richness/evenness calculations
- PCA, hierarchical clusterings, RDA etc.
- Wilcoxon tests
- Association (Spearman) tables phylotypes vs. phenotypes
- Relative contributions from bg variables


-> ideally, only standard things should be standardized;
for rare analyses just use basic R & other packages
HITChip preprocessing steps
- Spatial correction
- Between array normalization
- Background correction
- Oligo summarization
1. Spatial correction
2. Between­array normalization: minmax vs. quantiles?
3. Background correction: skip!
4. Oligo summarization


   NMF
   RPA
   SUM
   AVE
Preprocessing: recommendations
* Normalization:
   - minmax: use by default
   - quantile: use if samples have 'similar' microbiota
* Background correction
   -> ignore
* Oligo summarization
   -> NMF: for L0/L1 /L2 levels
   -> RPA: if species level is also included
   -> (SUM: for comparison)
   -> AVE: deprecated
=> The defaults readily implemented in the pipeline
Diversity analysis

Richness, evenness, diversity
Shannon vs. Inverse Simpson?
Detection threshold?
Richness with various indices and thresholds
Recommendation:
- oligo level
- shannon diversity
- richness as species
count with 80%
quantile detection
threshold
- evenness with
Pielou's index
Further analysis tools
microbiome.github.com

20120907 microbiome-intro

  • 1.
    Code sharing formicrobiomics Leo, Wageningen 7.9.201 2
  • 3.
    Challenges with computercode: - Analyses not standardized -> confusion & non-optimal choices - Poor documentation -> poor reproducibility & waste of time - Reinventing the wheel -> waste of time & resources Solution: - Harmonized software libraries (e.g. R packages) - Easier to share tools (GitHub) -> more reliable & reproducible -> more standardized -> avoid repetitive coding -> added value for publications -> distributed version control; all changes automatically tracked -> facilitates Helsinki-Wageningen collaboration
  • 6.
    Wiki: various exampleanalyses already implemented - retrieve data from MySQL( H/M/PITChip) - preprocessing (profiling & HITChip Atlas) - analysis routines (diversities, tables, Wilcoxon tests etc.) - visualization -> improving through time
  • 7.
    Step­by­step examples withsource code and simulated data
  • 8.
    Common core microbiota: effect of analysis depth and prevalence "Blanket analysis" github.com/microbiome Core size Estimate the frequency of belonging to the core for each phylotype; confidence intervals with bootstrap Ab un dan Salonen A, et al. (2012) The adult intestinal core Prevalence ce microbiota is determined by analysis depth and health status, Clinical Microbiology and Infection 18:16–20.
  • 9.
    Compatible with HITChipAtlas of Human Gut Microbiota (>3200 samples) 45 studies - Standardized Platform >1 000 phylotypes >3000 samples -> Compare your own data to HITChip data collections?
  • 10.
    Differences to theold profiling script? -> Separate preprocessing from analysis -> Support modularity -> removed outdated options & outputs from profiling script 1. Preprocessing: minimal output from profiling script: - preprocessed data matrices (oligo/L1 /L2/species/absolute scale) with NMF/RPA/SUM - preprocessing log (parameter values etc.) - quality control plots (heatmap) 2. Analysis & visualization routines - based on profiling script output & done afterwards -> modular - used when needed, not run by default -> keeping it simple & storing disk space
  • 11.
    Summary: code development& sharing through GitHub In-house sharing infrastructure for code -> distributed package maintenance -> avoid bugs; facilitate transparency & reproducibility -> additional visibility & citations? Avoid extra work and focus on the essential -> check for ready-made examples from the wiki! -> ask for help -> let's add examples to the wiki! Manage and share your own code? -> GitHub and microbiome R package -> Version control microbiome.github.com
  • 12.
    To discuss Do youhave R code which could be useful for others? -> let's polish, document & add it in the package! Which tools to include? - diversity/richness/evenness calculations - PCA, hierarchical clusterings, RDA etc. - Wilcoxon tests - Association (Spearman) tables phylotypes vs. phenotypes - Relative contributions from bg variables -> ideally, only standard things should be standardized; for rare analyses just use basic R & other packages
  • 14.
    HITChip preprocessing steps -Spatial correction - Between array normalization - Background correction - Oligo summarization
  • 15.
  • 16.
    2. Between­array normalization:minmax vs. quantiles?
  • 17.
  • 18.
    4. Oligo summarization NMF RPA SUM AVE
  • 19.
    Preprocessing: recommendations * Normalization: - minmax: use by default - quantile: use if samples have 'similar' microbiota * Background correction -> ignore * Oligo summarization -> NMF: for L0/L1 /L2 levels -> RPA: if species level is also included -> (SUM: for comparison) -> AVE: deprecated => The defaults readily implemented in the pipeline
  • 20.
    Diversity analysis Richness, evenness,diversity Shannon vs. Inverse Simpson? Detection threshold?
  • 21.
    Richness with variousindices and thresholds
  • 22.
    Recommendation: - oligo level -shannon diversity - richness as species count with 80% quantile detection threshold - evenness with Pielou's index
  • 23.
  • 24.