![Reliability Goals & Metrics Summary
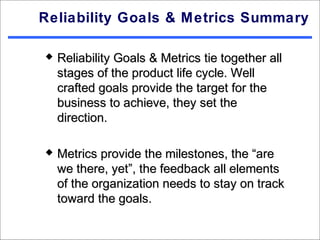
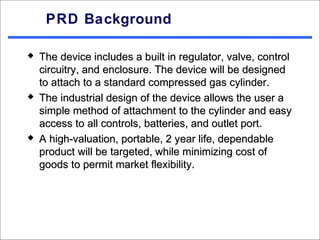
A reliability goal includes each of the four
elements of the reliability definition.
o Intended function
o Environment (including use profile)
o Duration
o Probability of success
o [Customer expectations]](https://image.slidesharecdn.com/2011schenkelbergtutorial-130101172808-phpapp02/85/2011-RAMS-Tutorial-Effective-Reliability-Program-Traits-and-Management-24-320.jpg)
![Reliability Goals & Metrics Summary
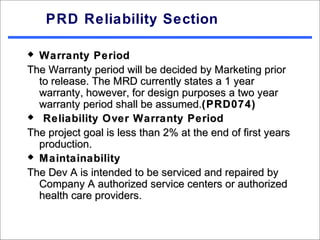
A reliability goal includes each of the four
elements of the reliability definition.
o Intended function
o Environment (including use profile)
o Duration
o Probability of success
o [Customer expectations]](https://image.slidesharecdn.com/2011schenkelbergtutorial-130101172808-phpapp02/85/2011-RAMS-Tutorial-Effective-Reliability-Program-Traits-and-Management-49-320.jpg)
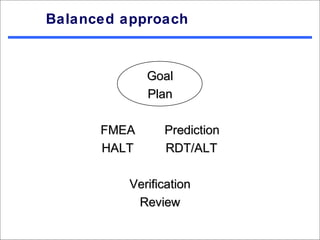
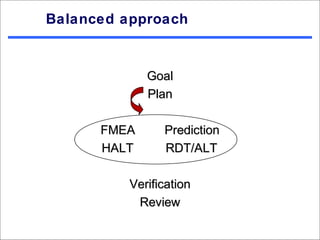
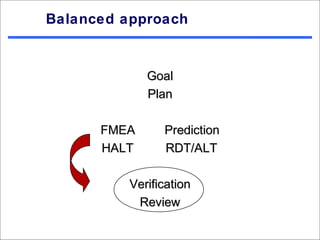
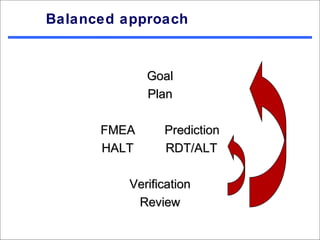
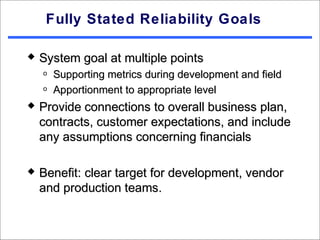


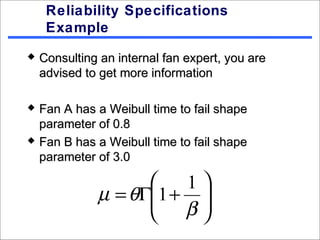
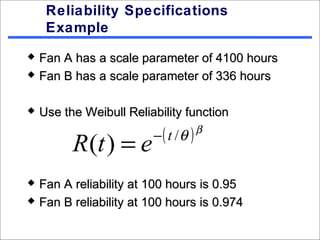
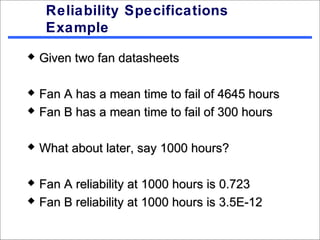

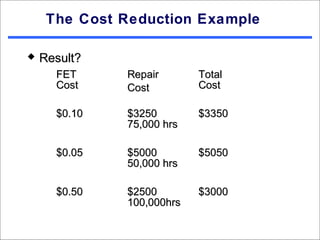


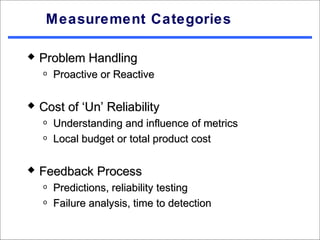
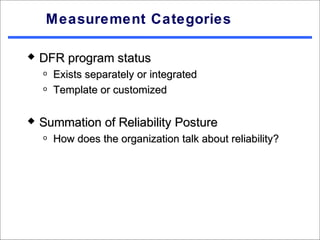
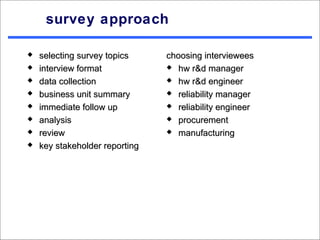
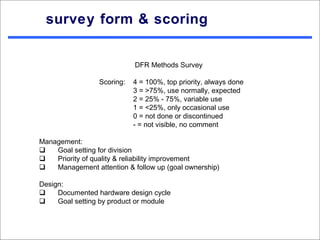
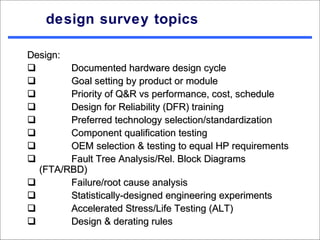
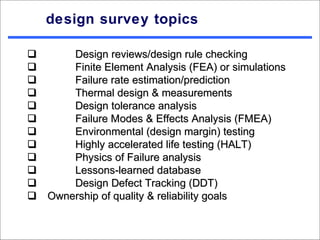
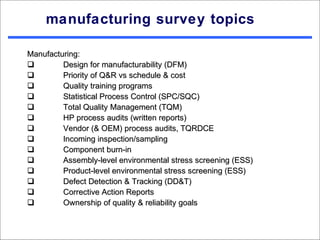

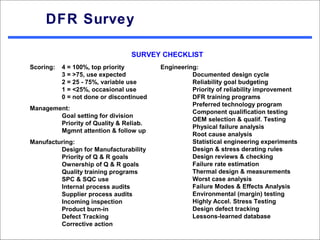
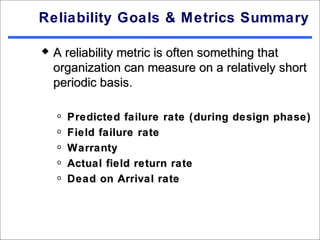
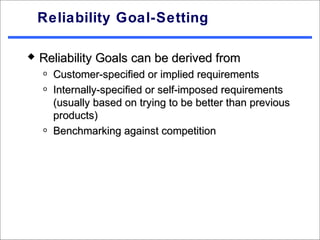
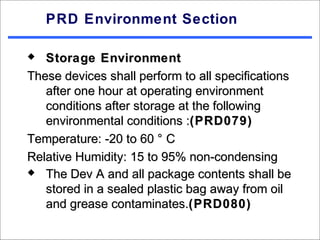
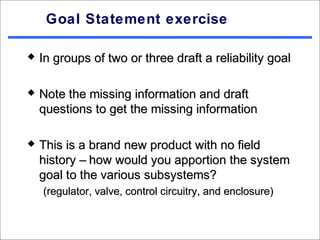
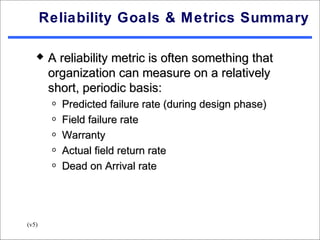
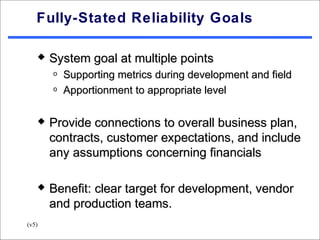
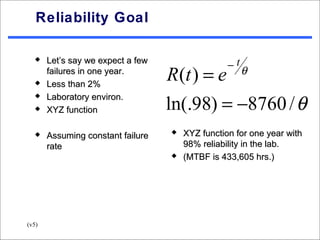
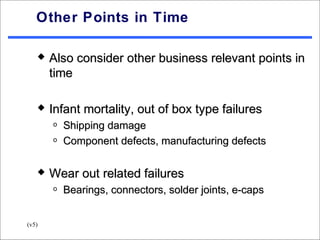
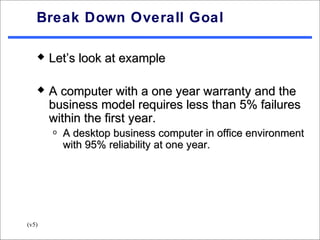
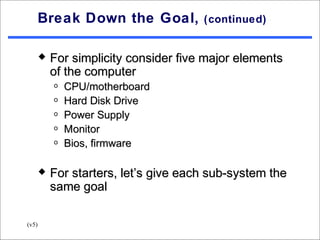
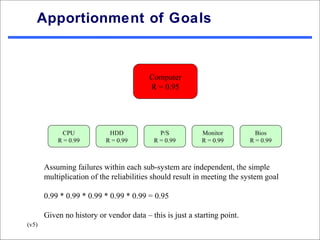
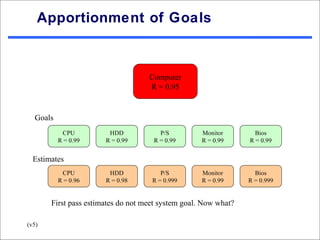
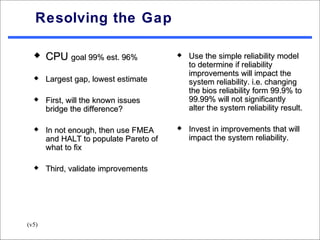
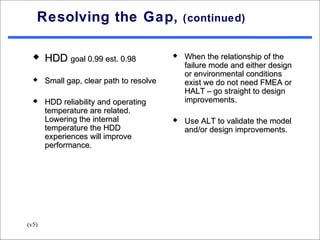
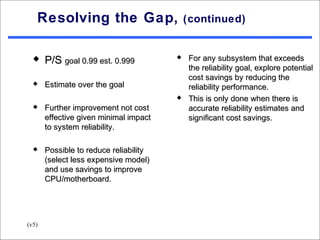
The document outlines key traits for effective reliability program management. It discusses setting reliability goals and metrics at multiple points in the product lifecycle. Goals should include intended function, operating environment, duration, and probability of success. Metrics provide milestones to track progress towards goals. The document provides an example of breaking down a system-level goal into goals for subsystems, and approaches for resolving gaps between goals and estimates.


