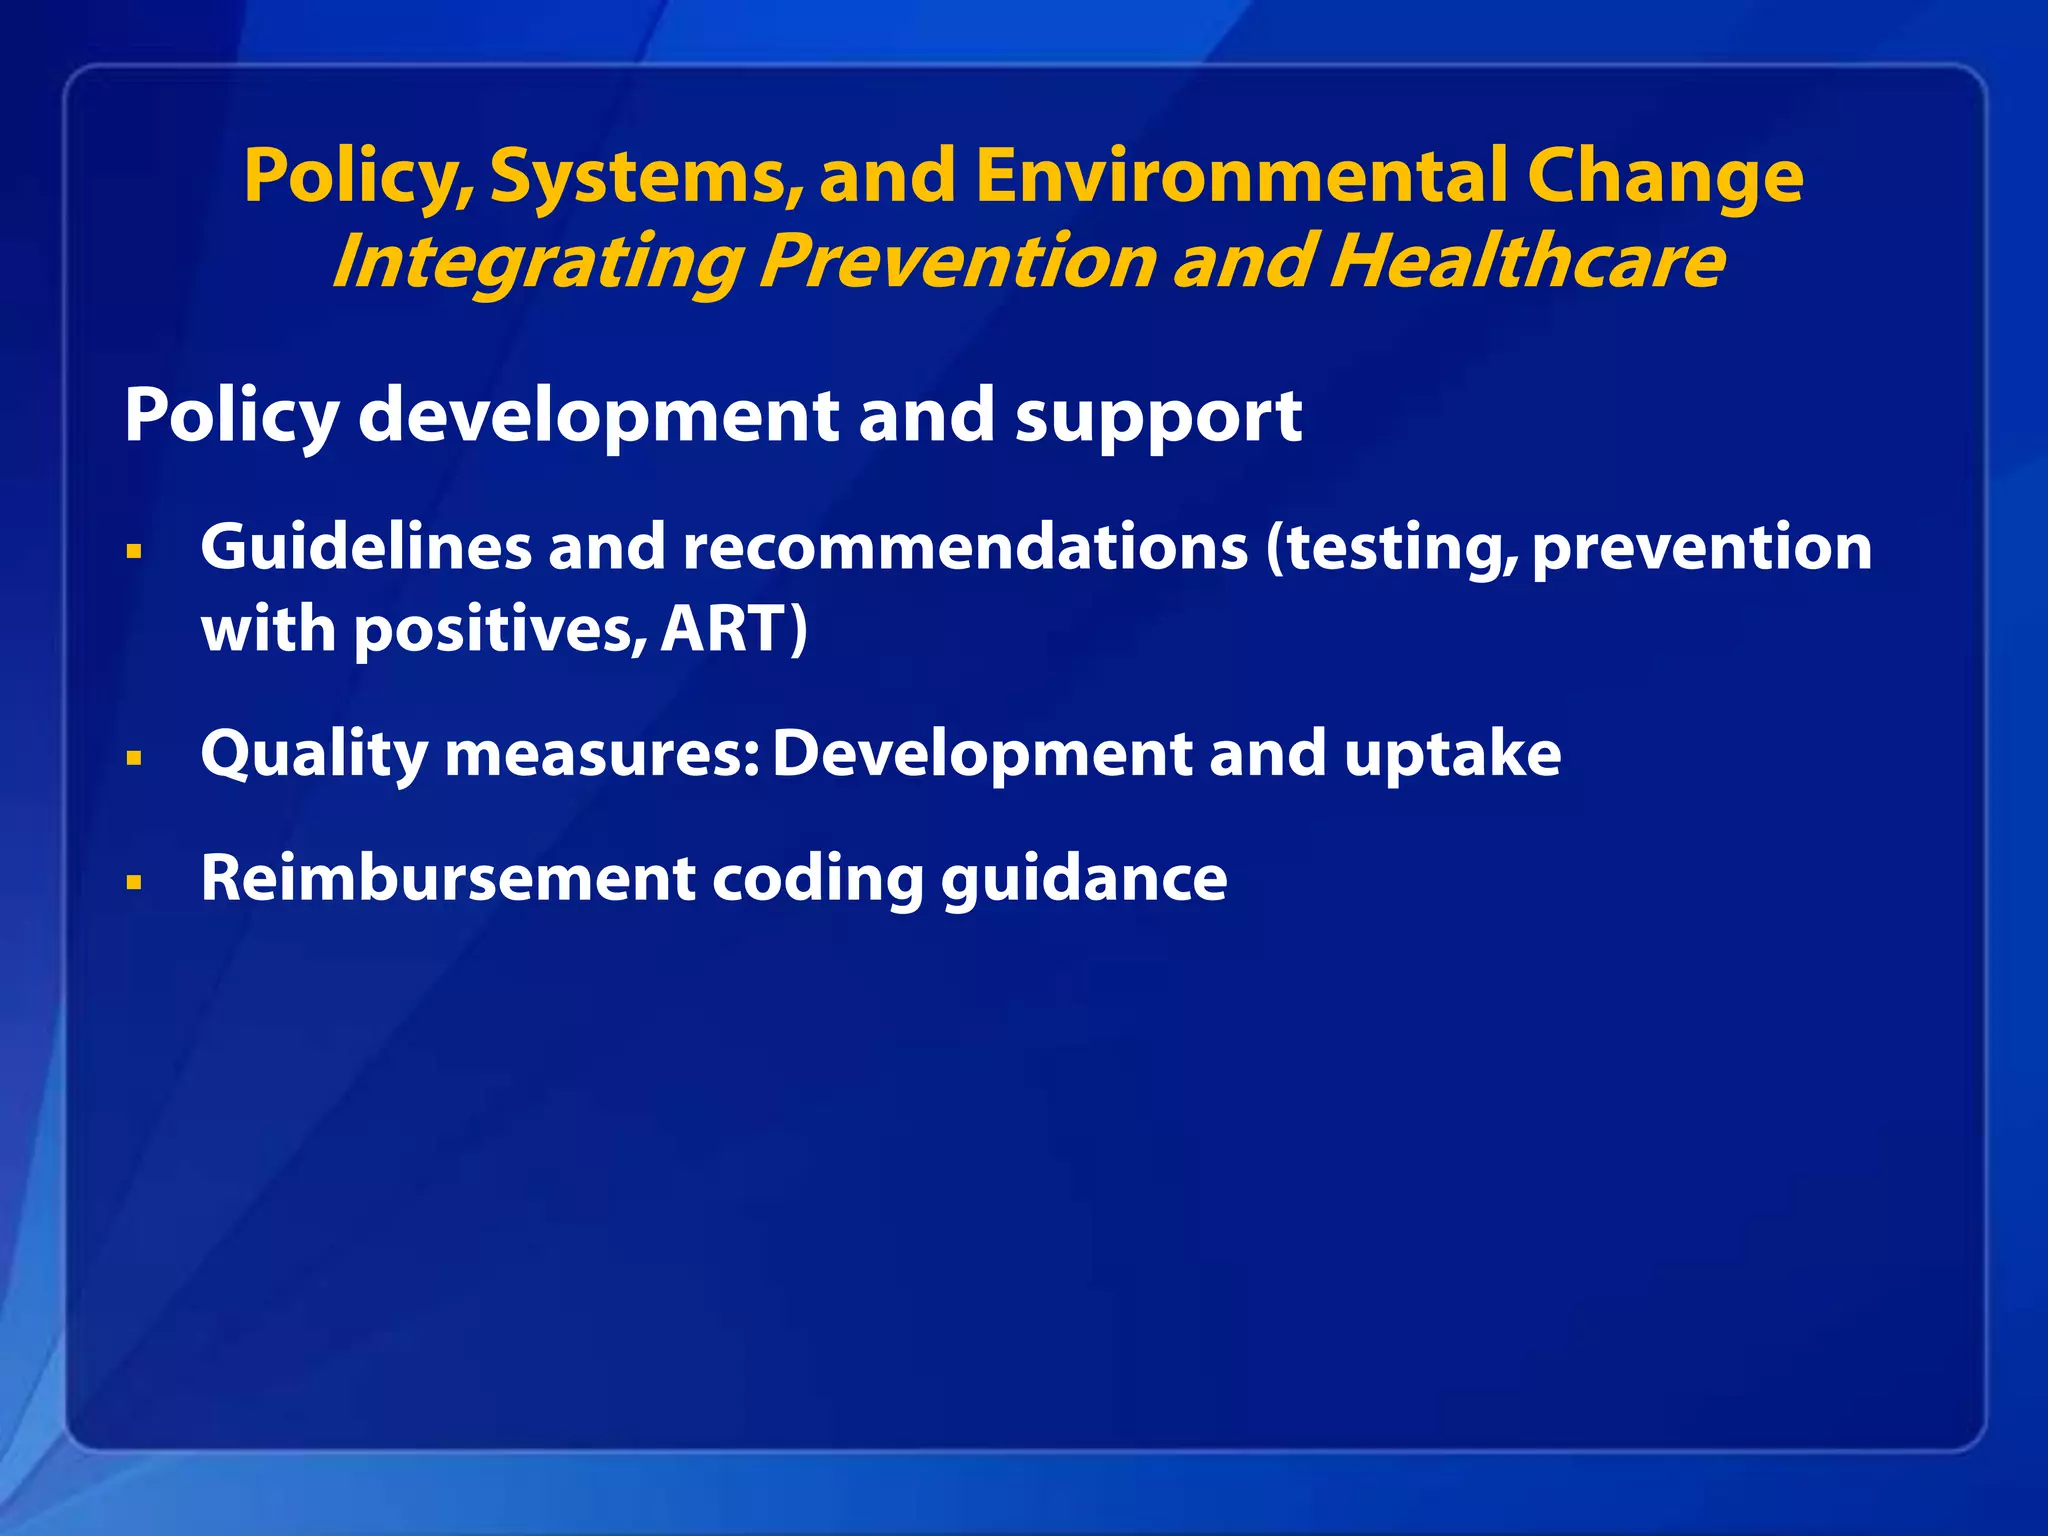
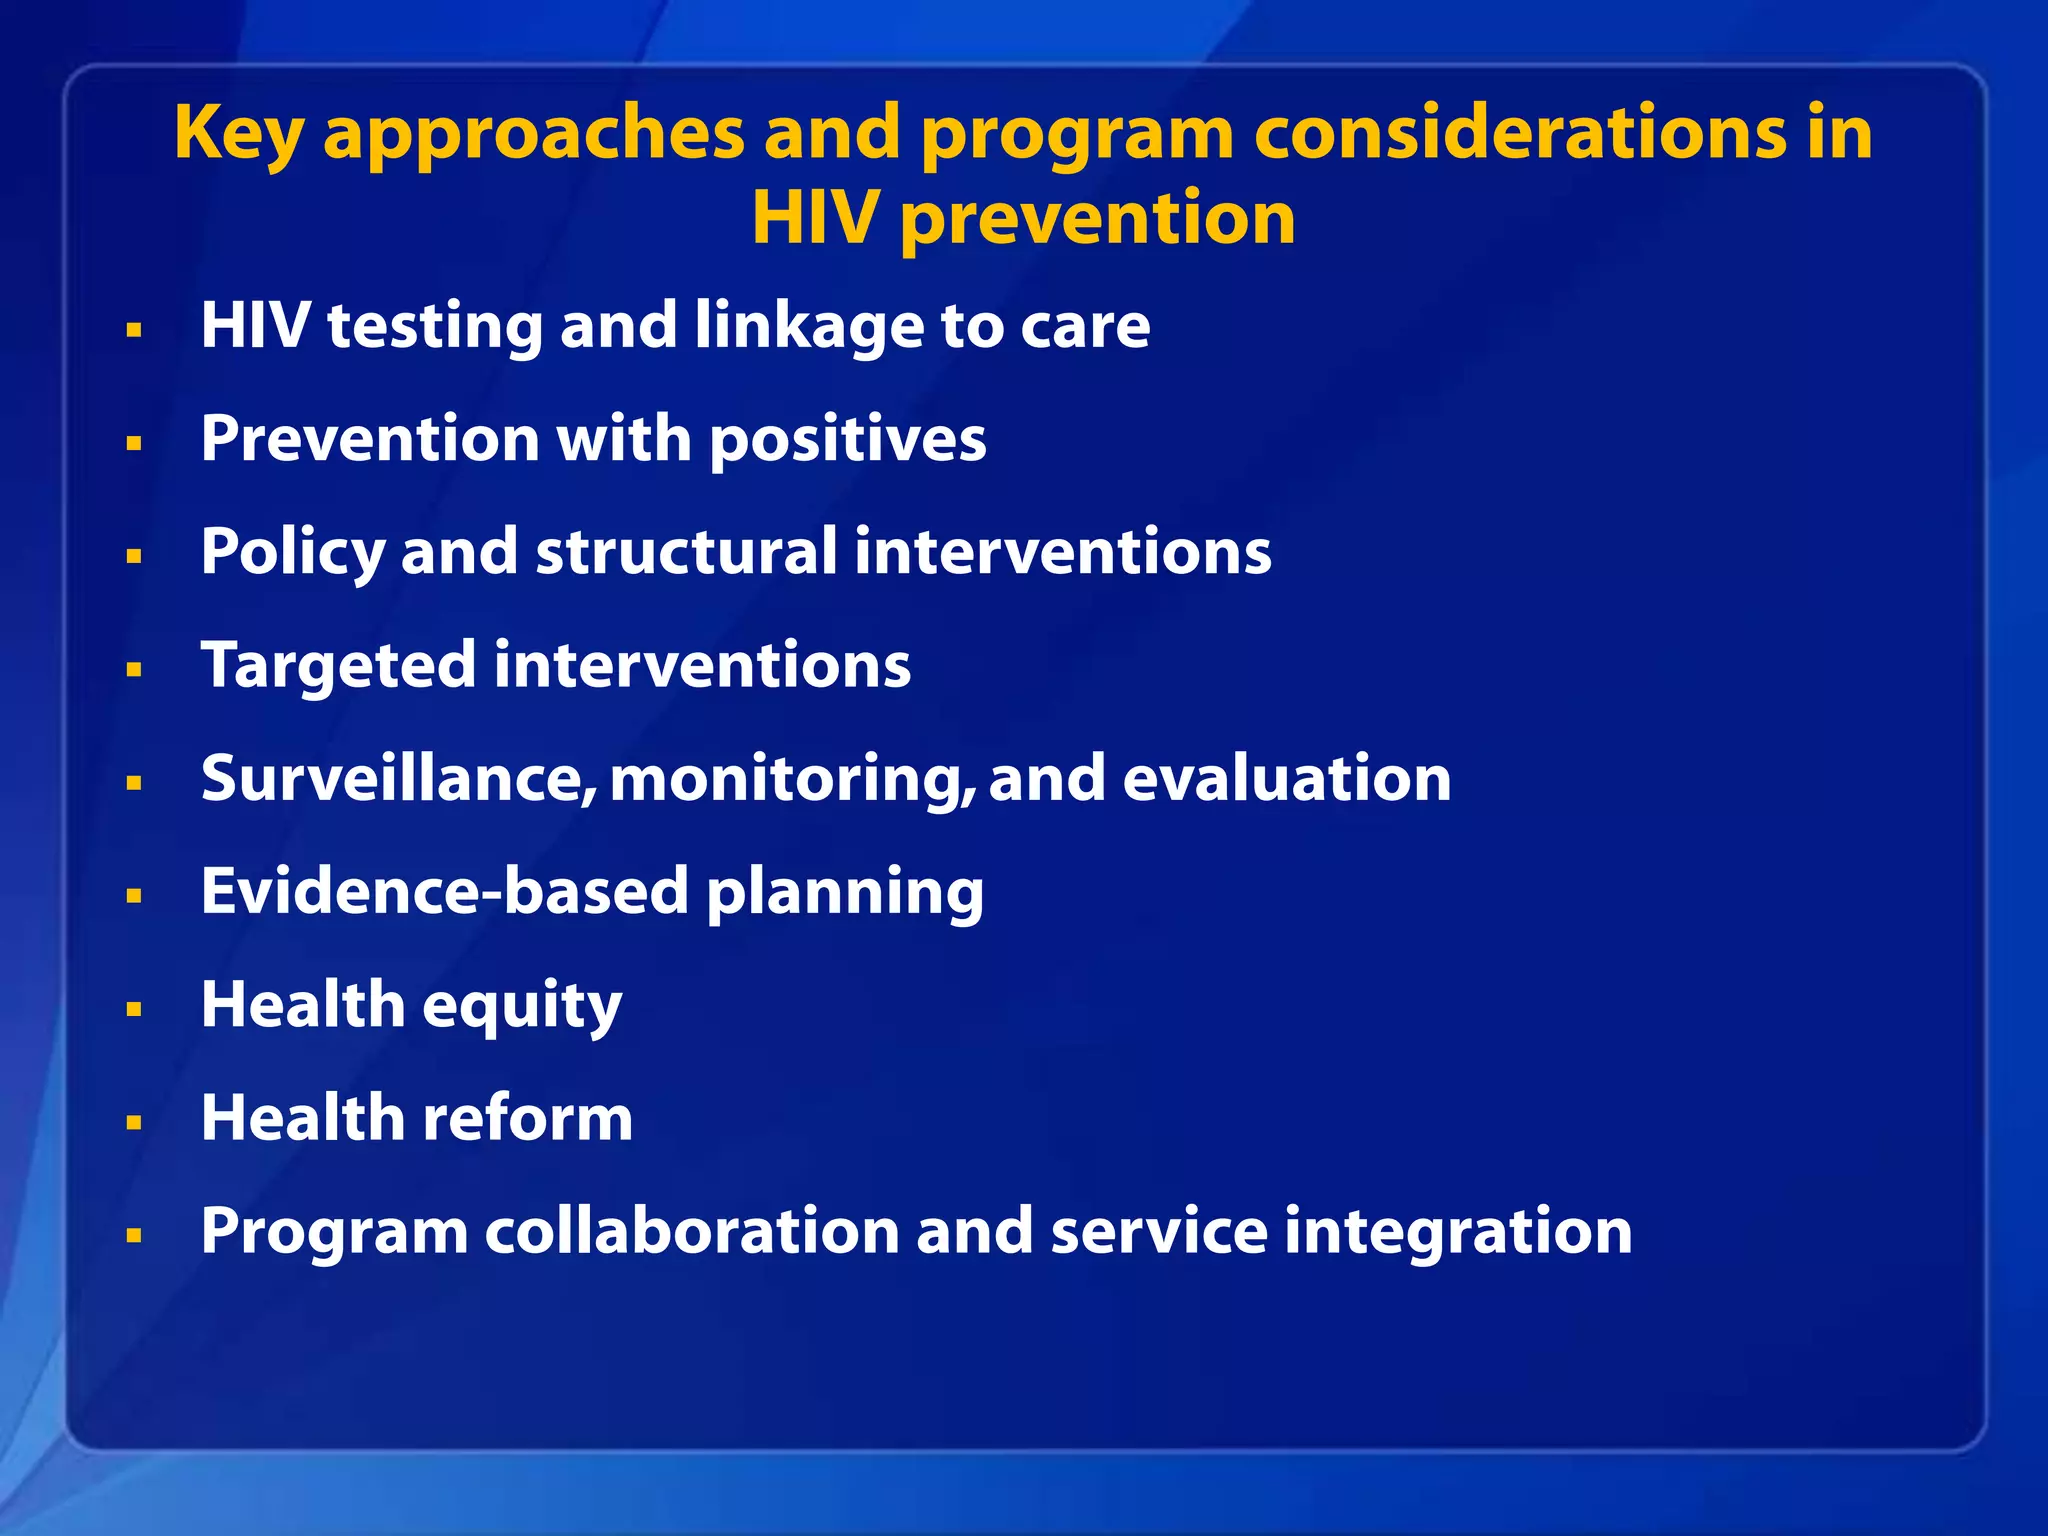
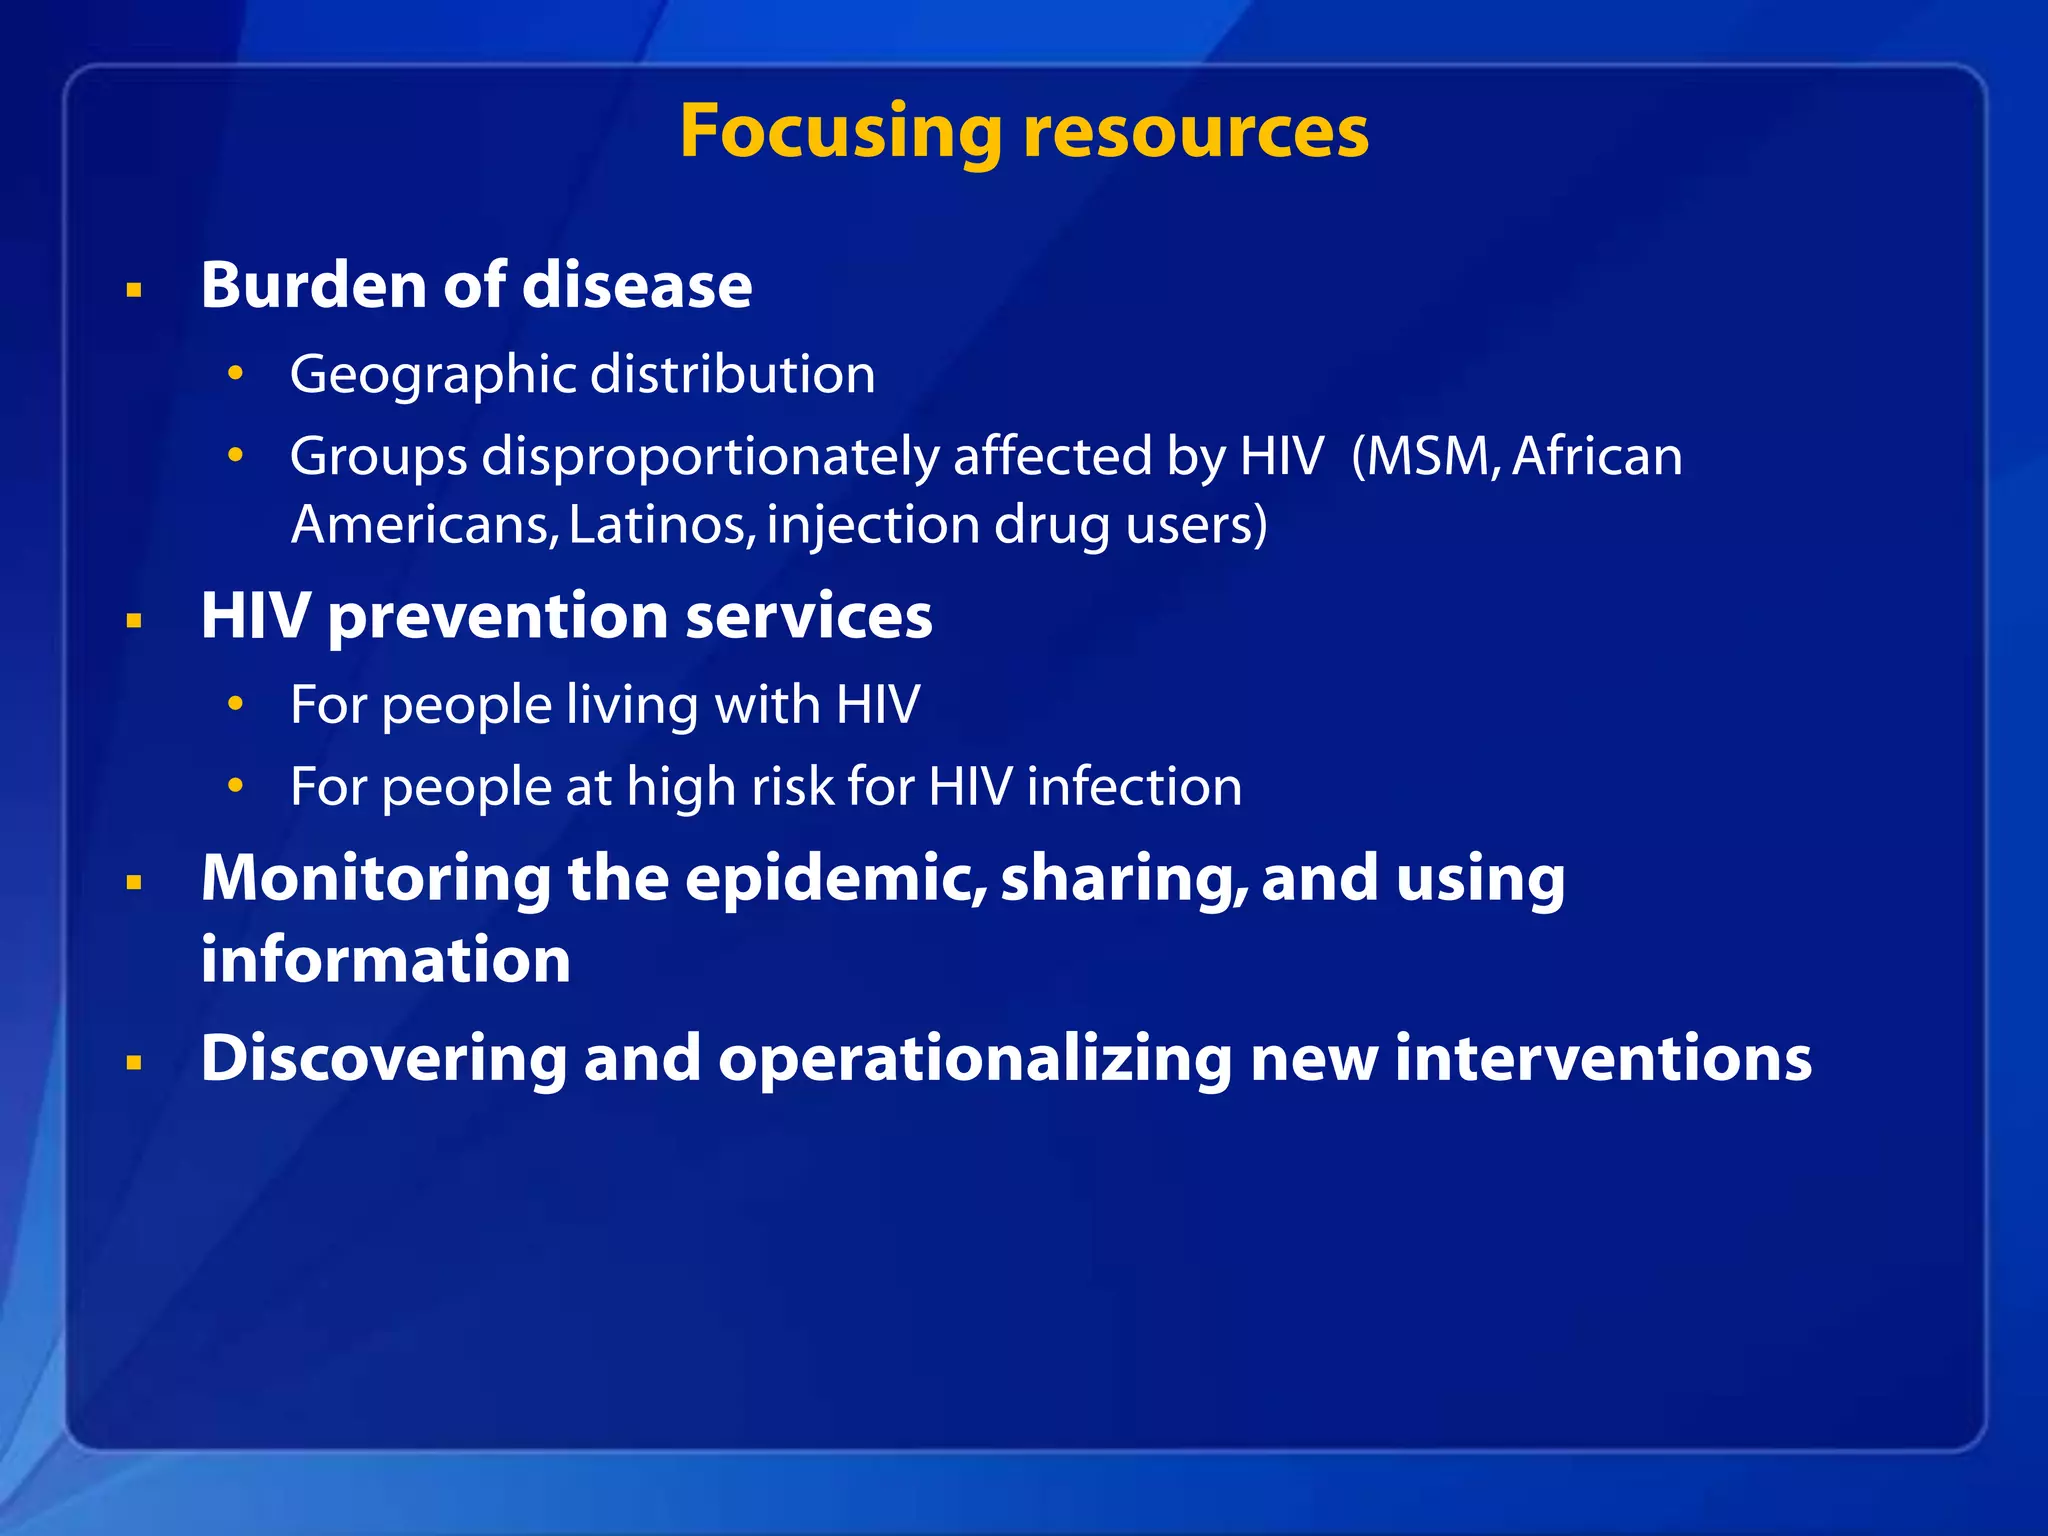
This document summarizes key information about HIV in the United States:
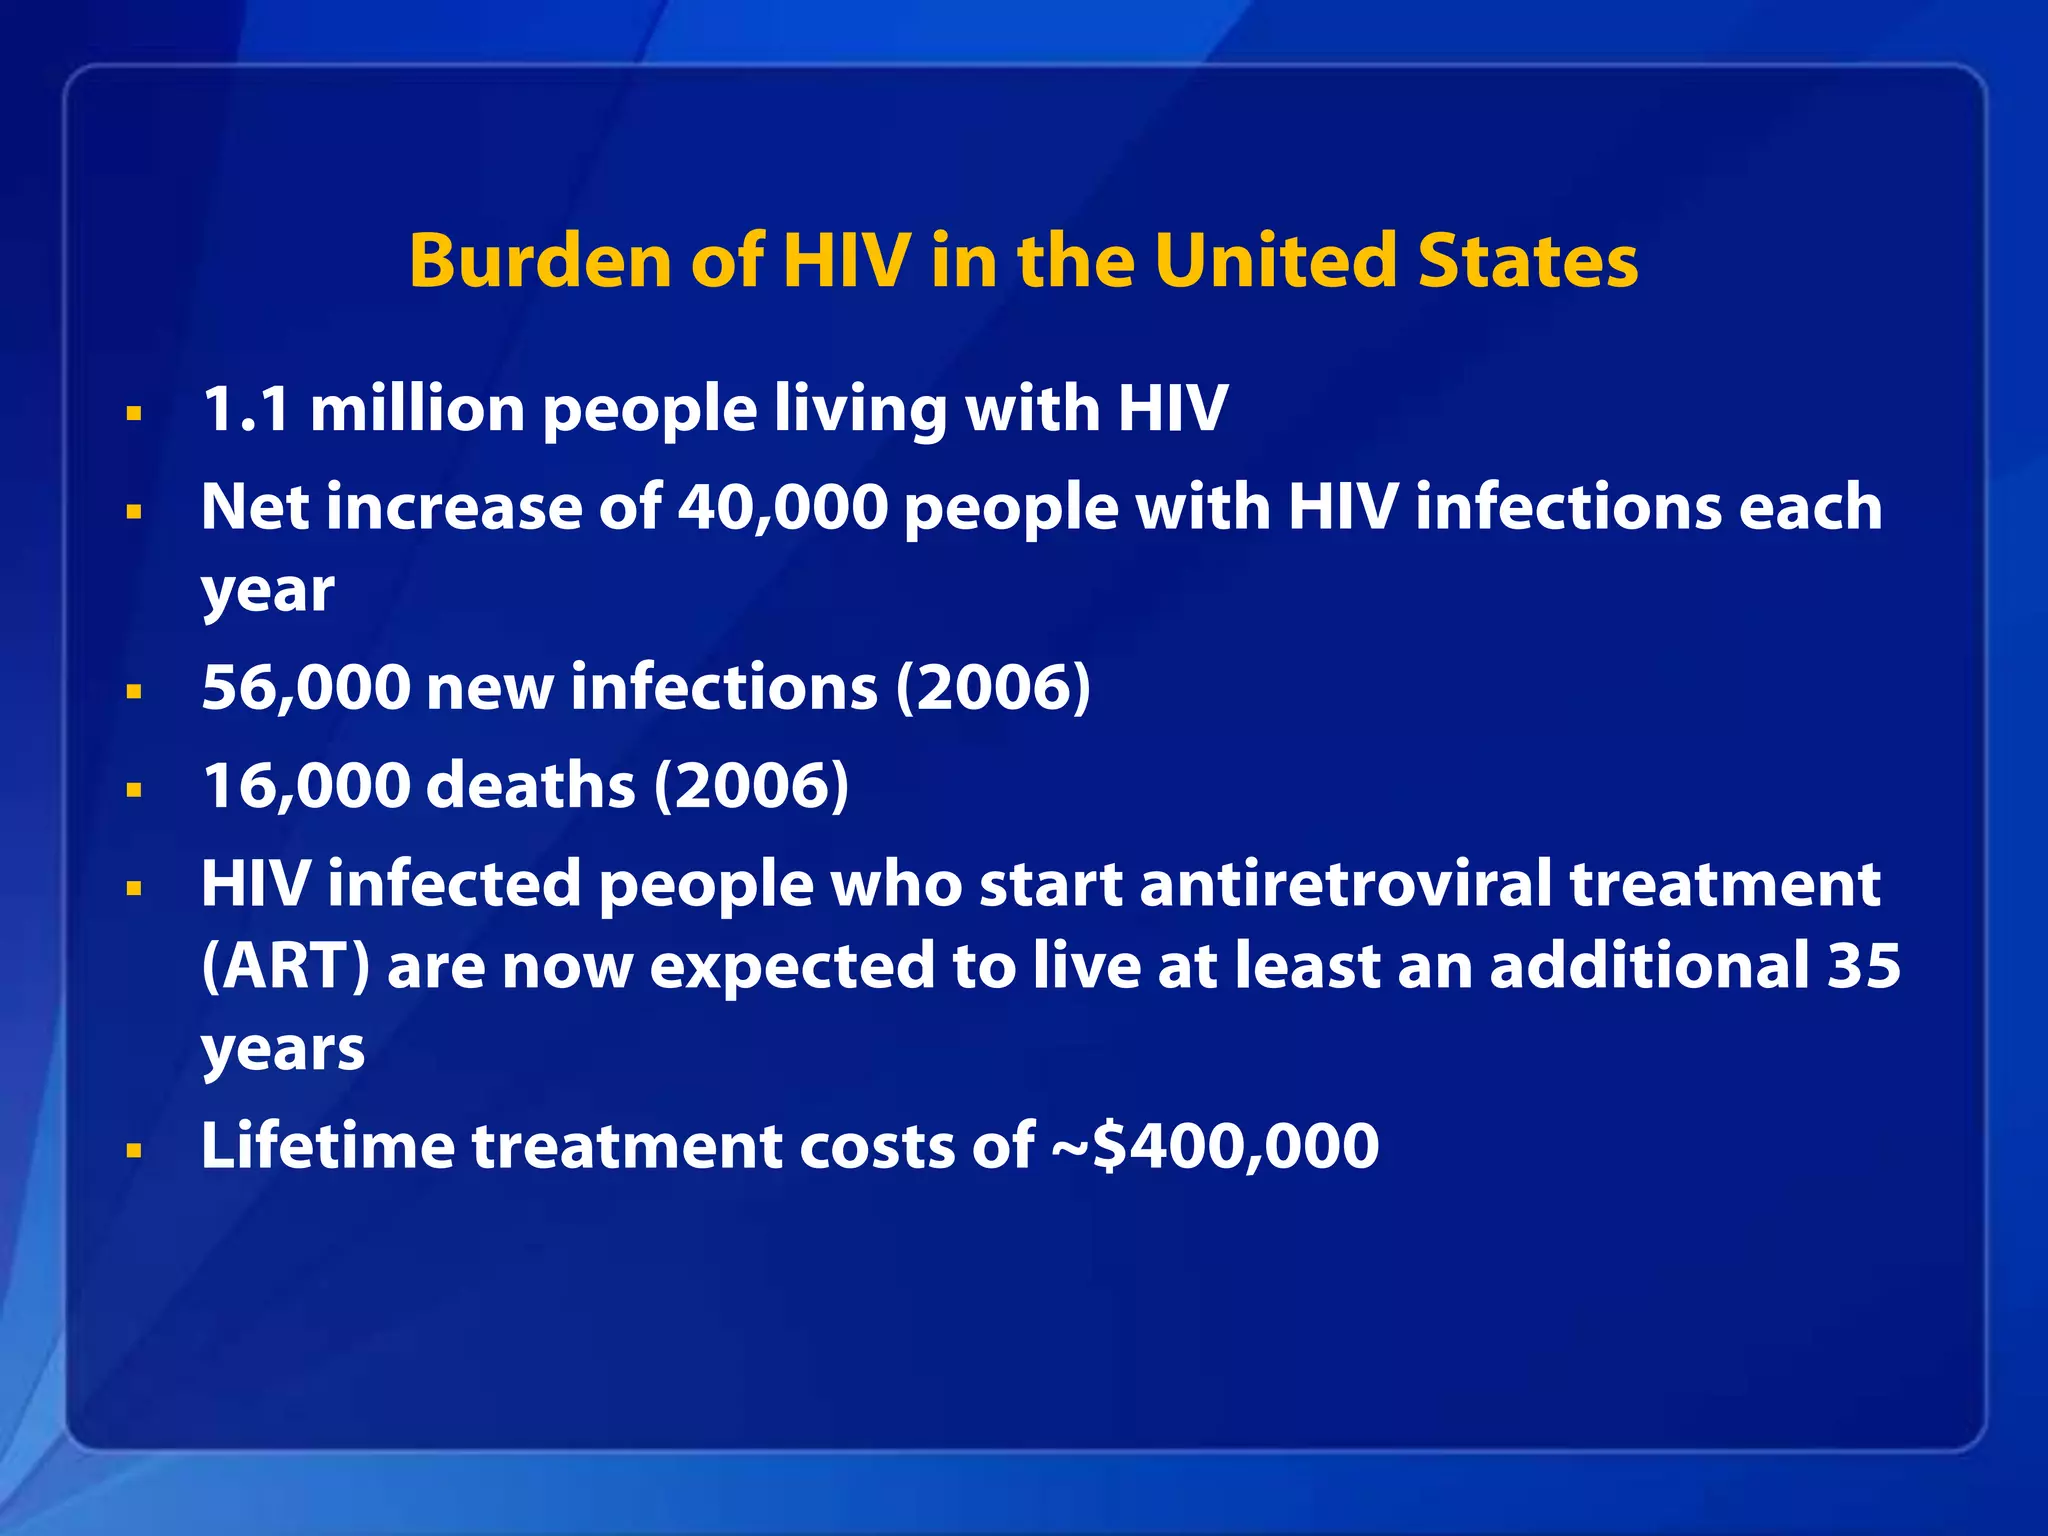
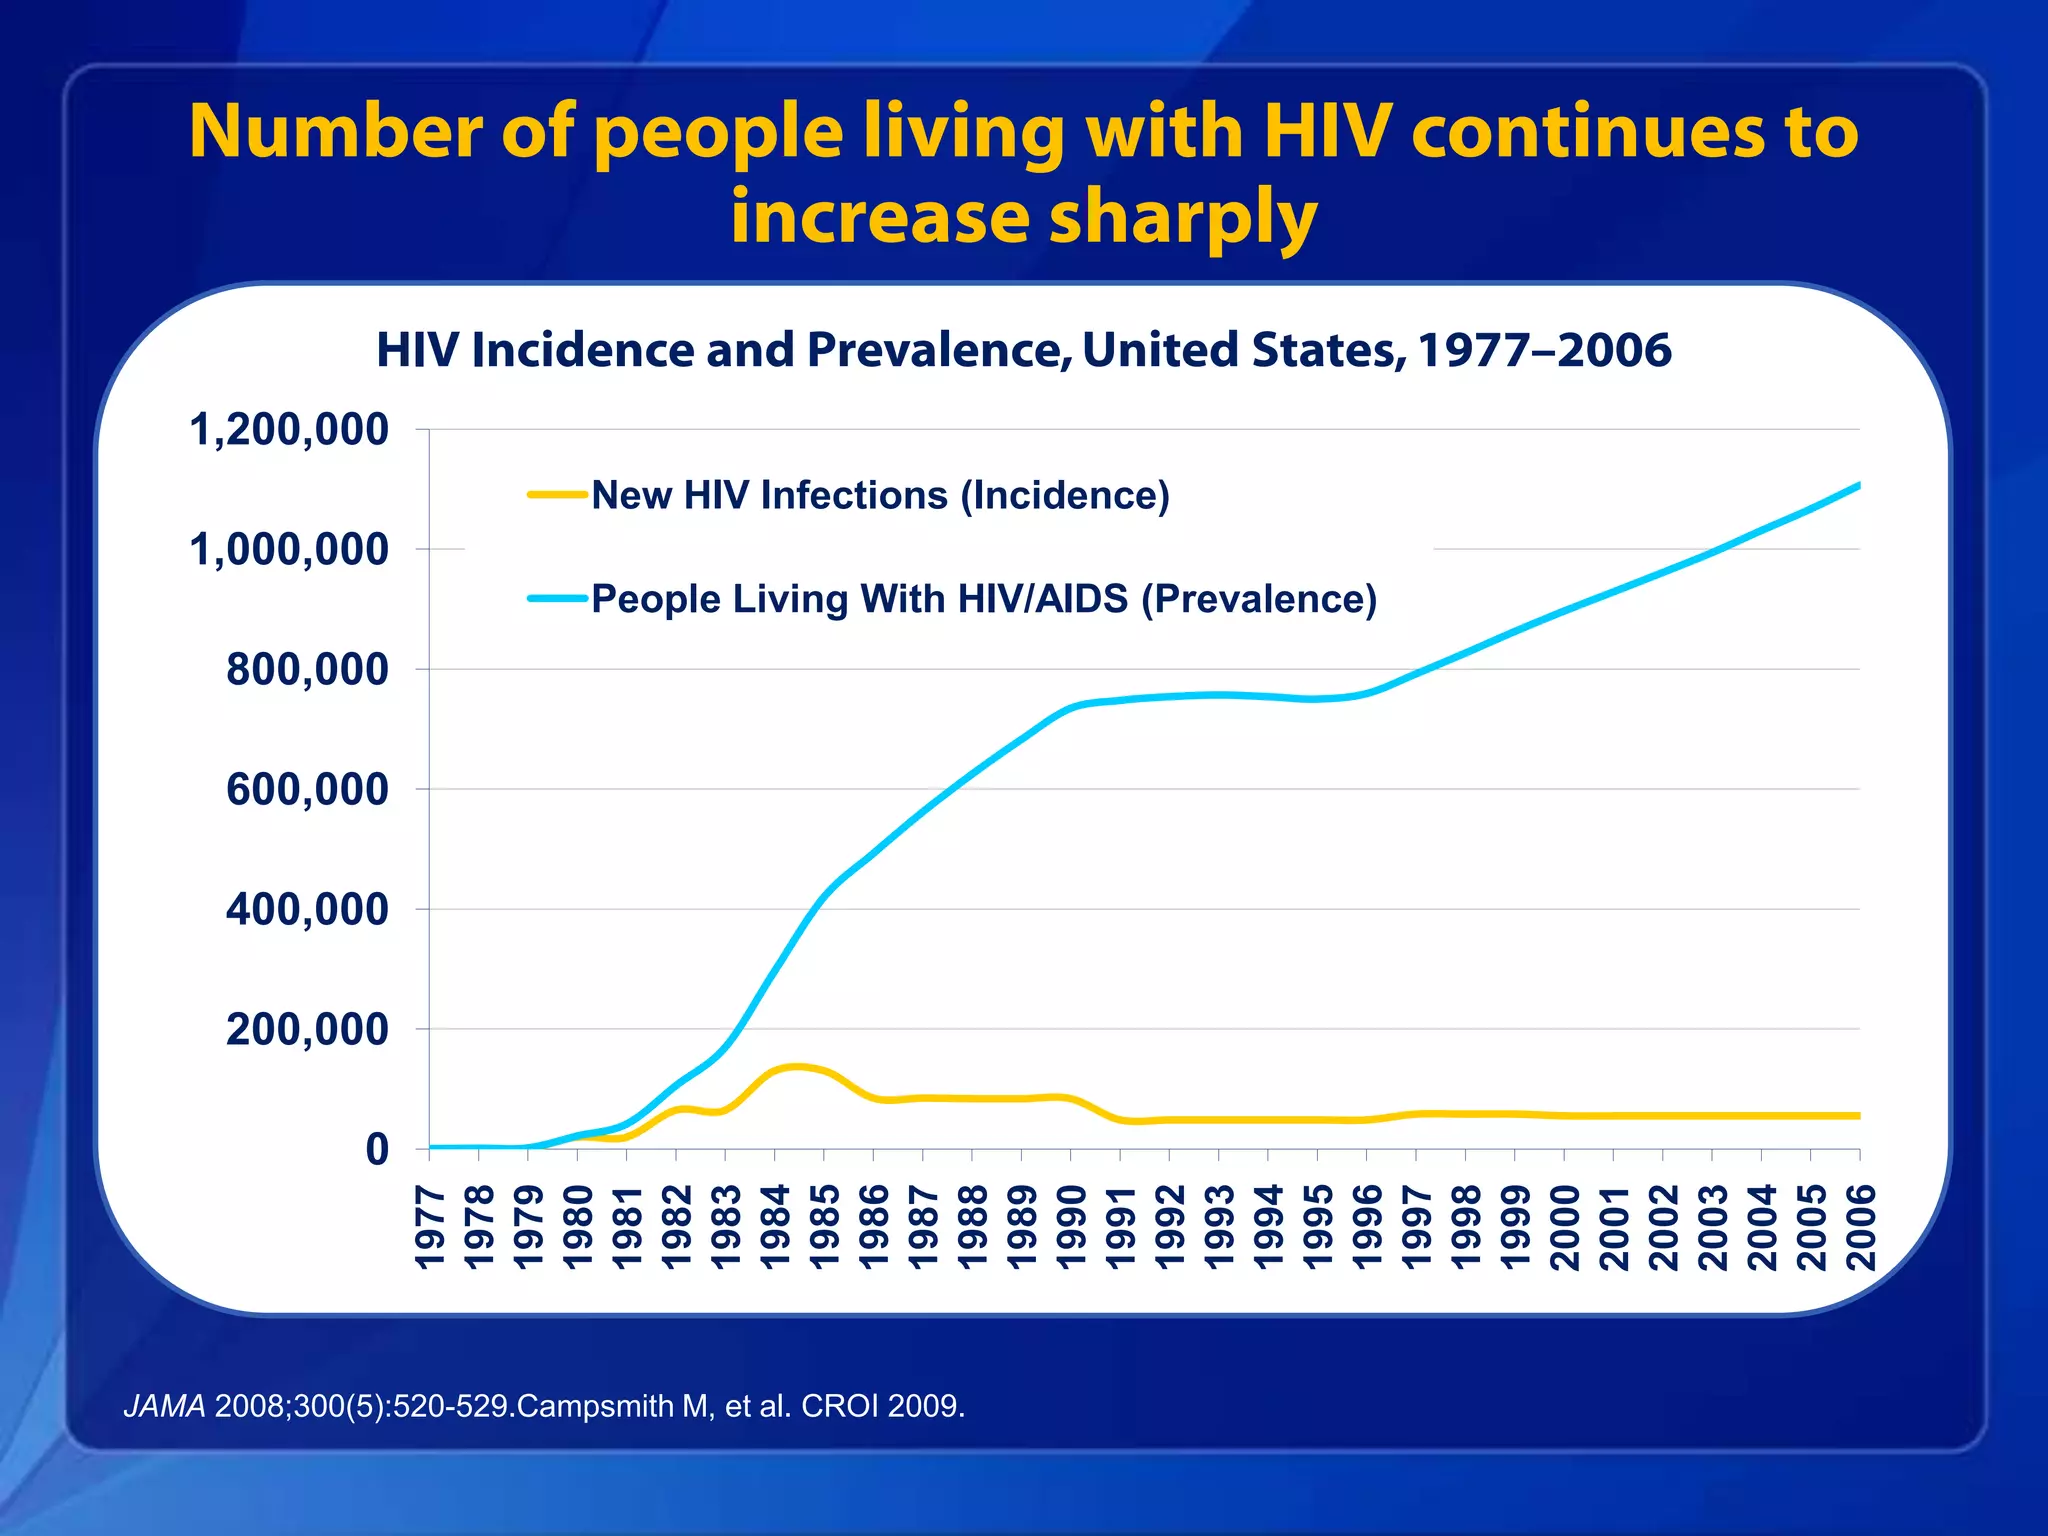
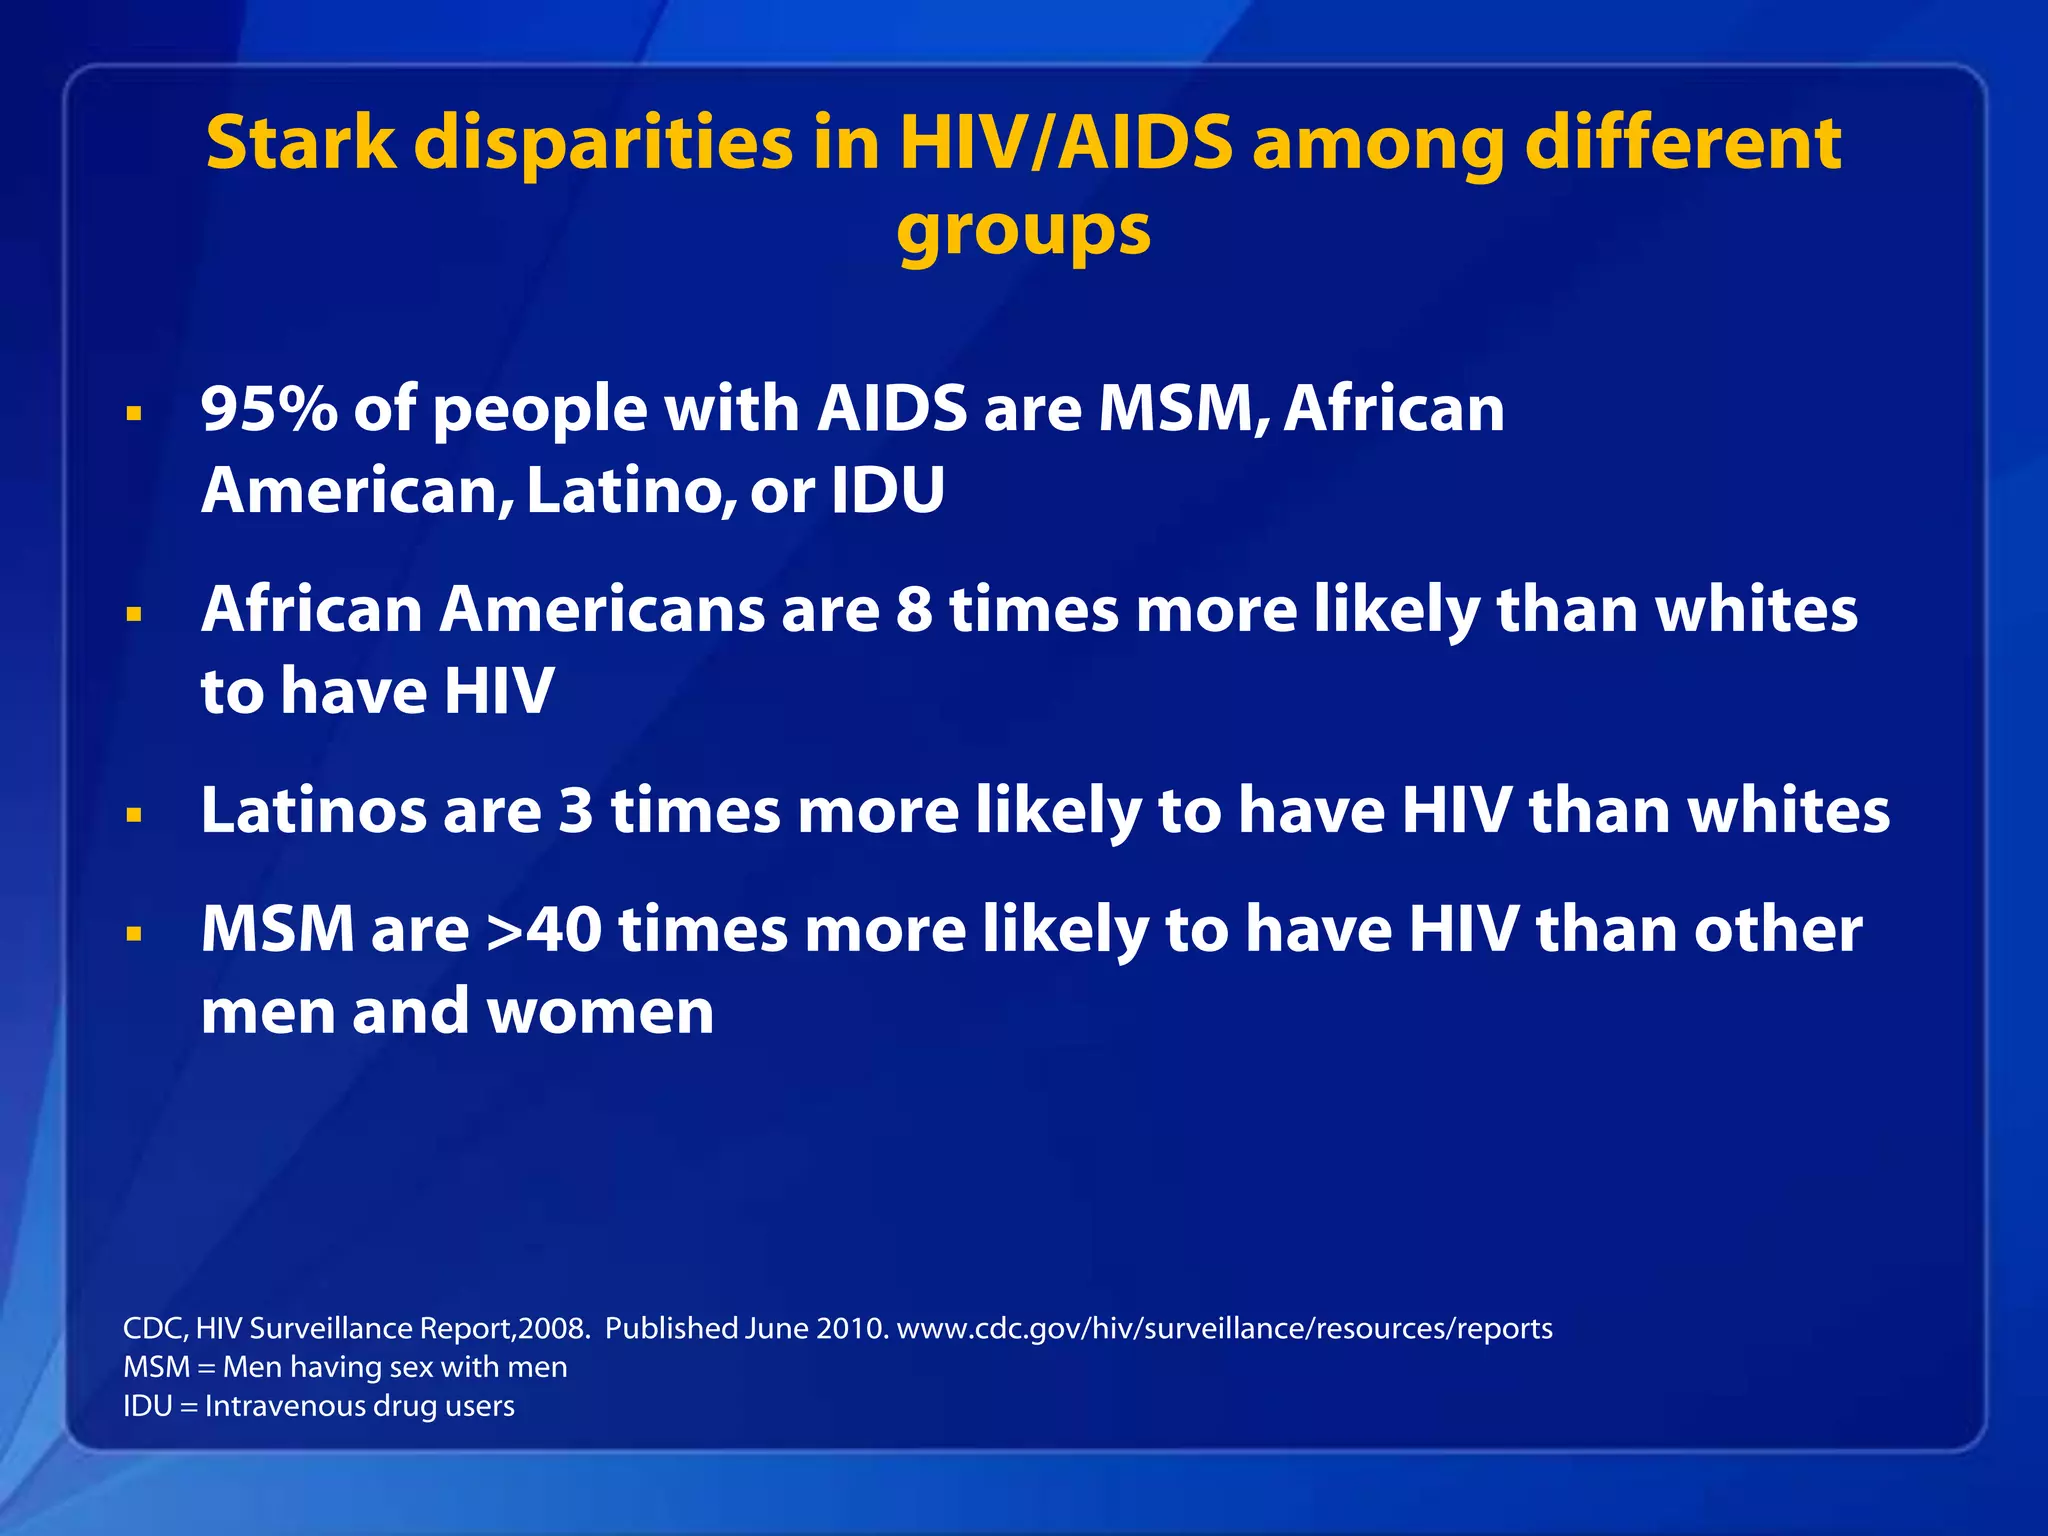
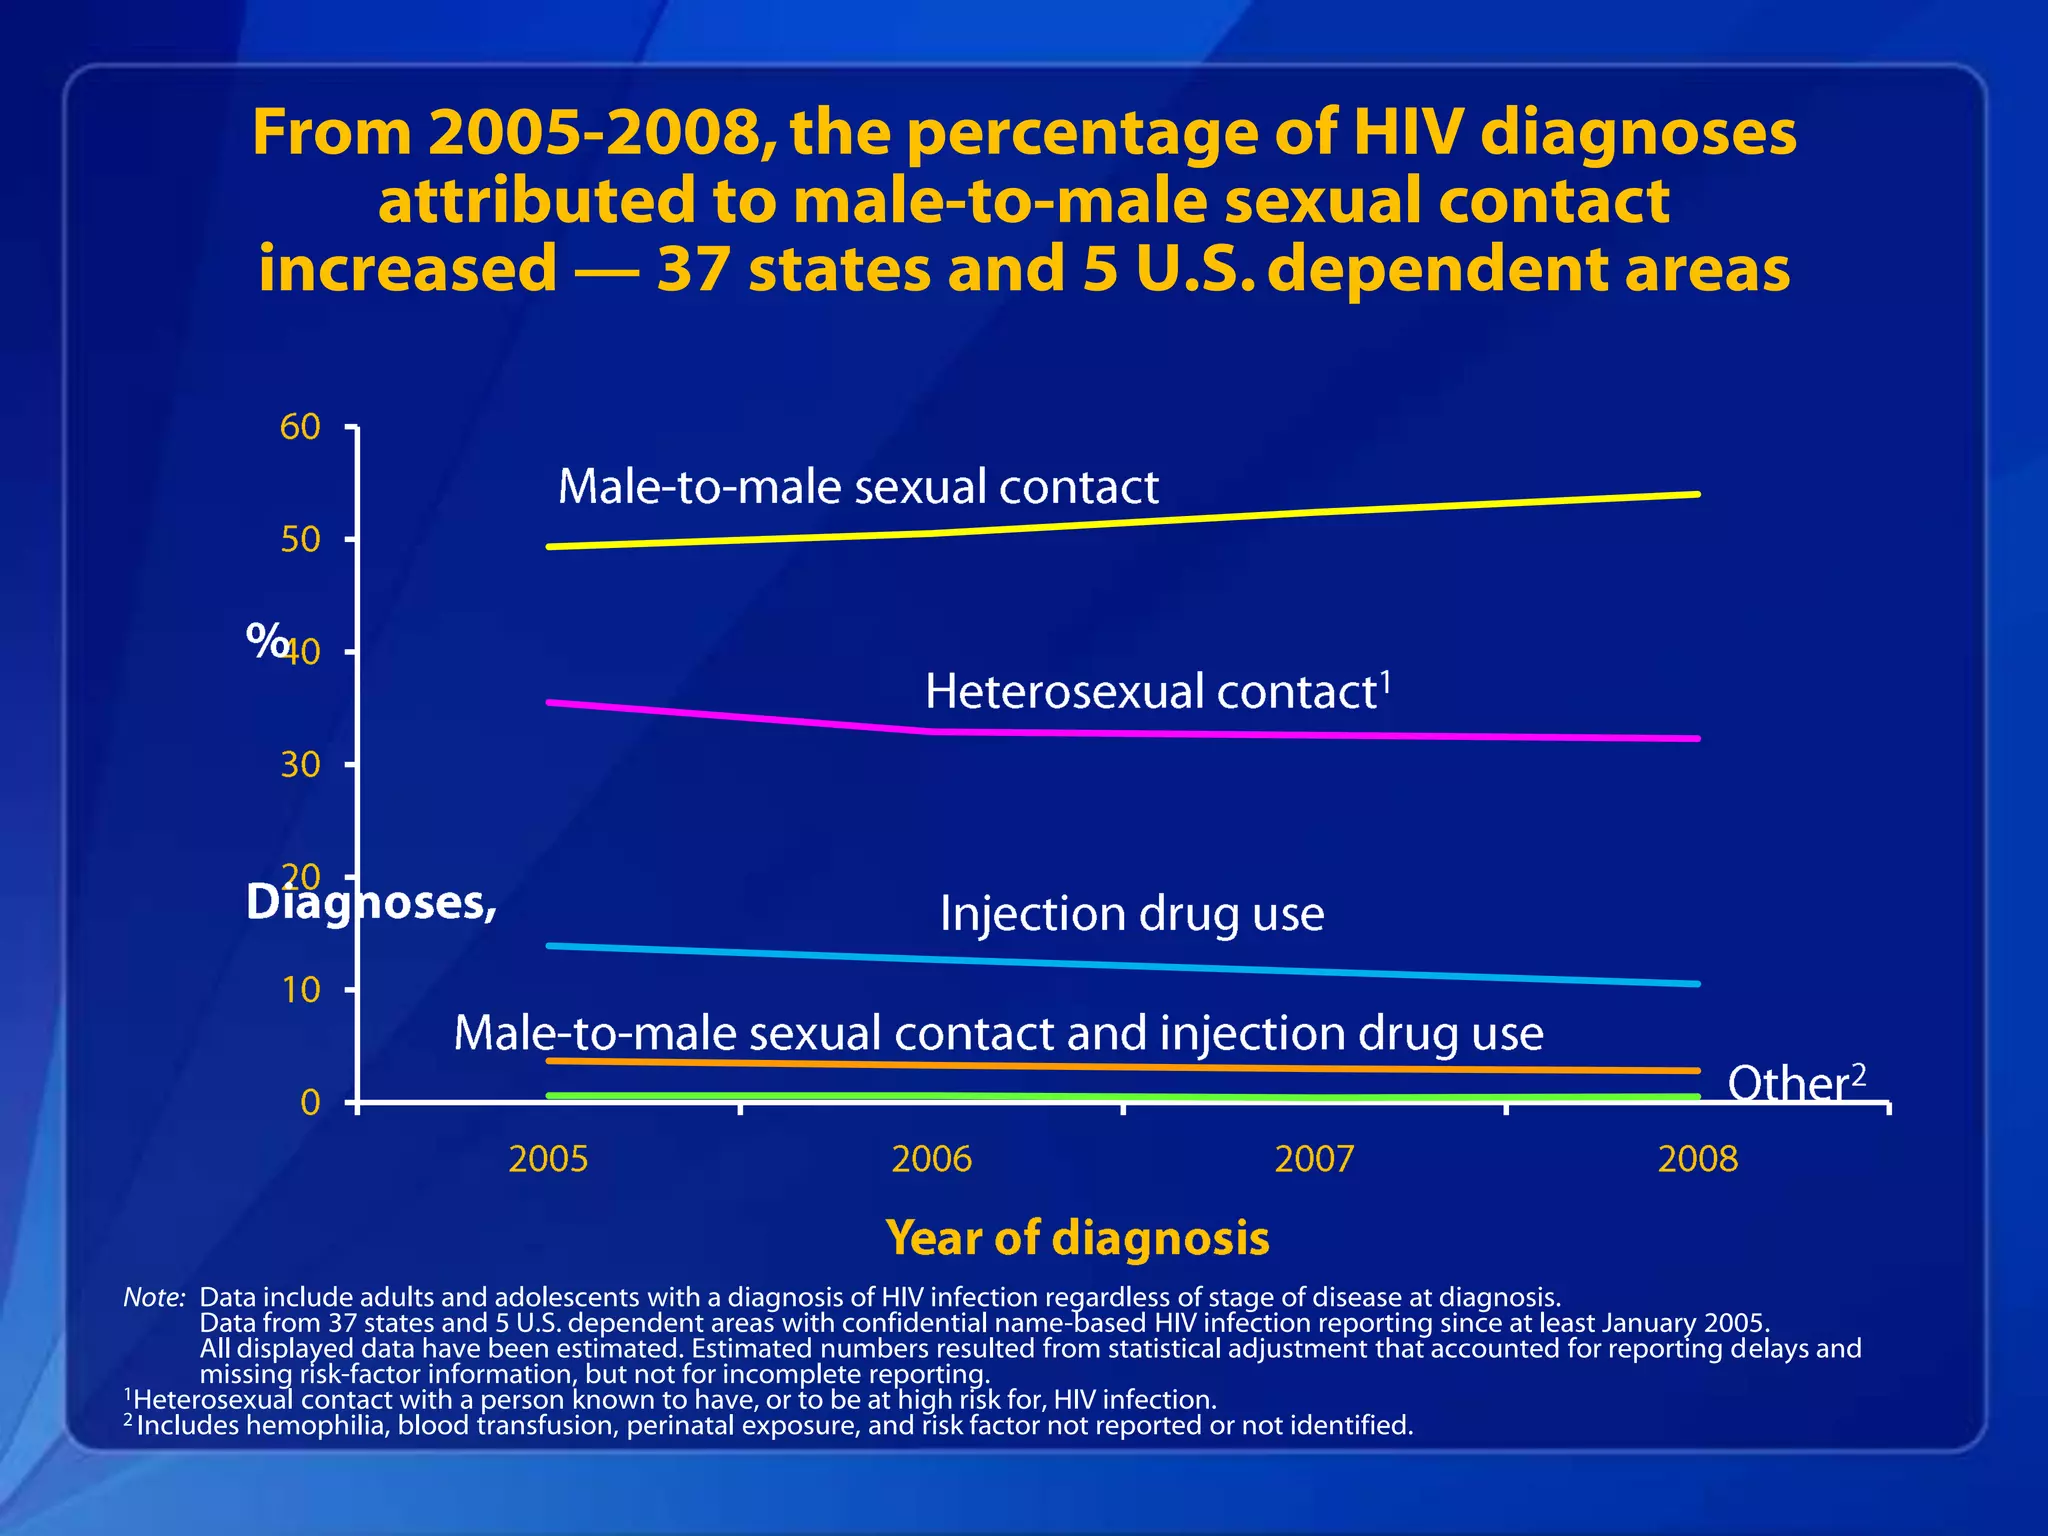
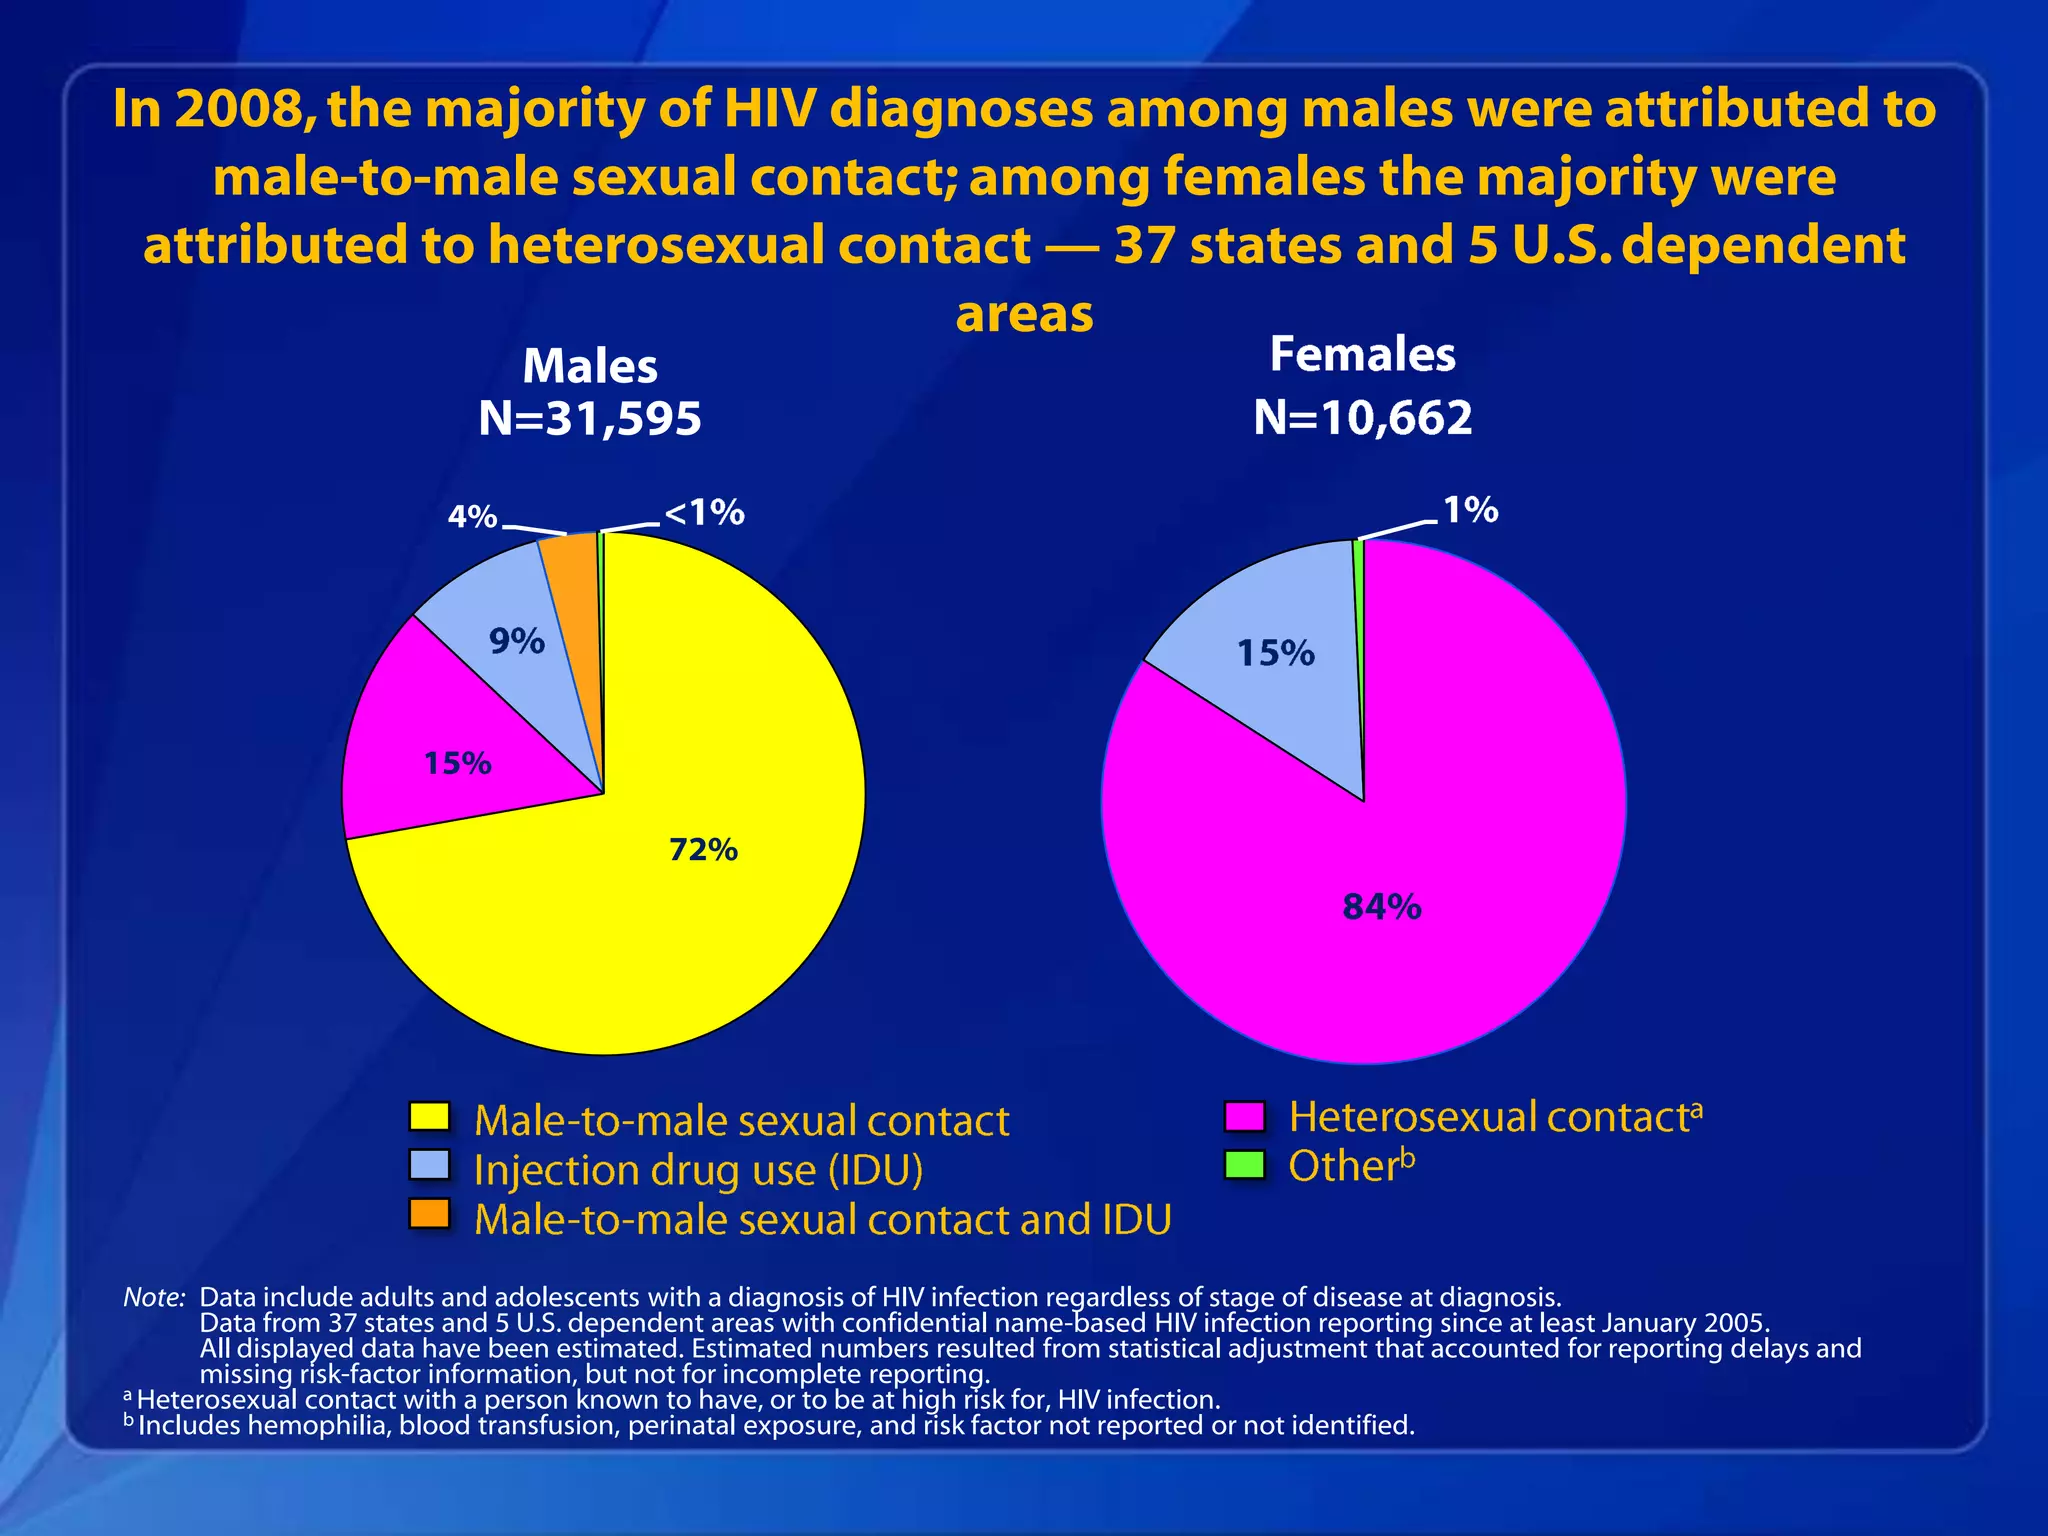
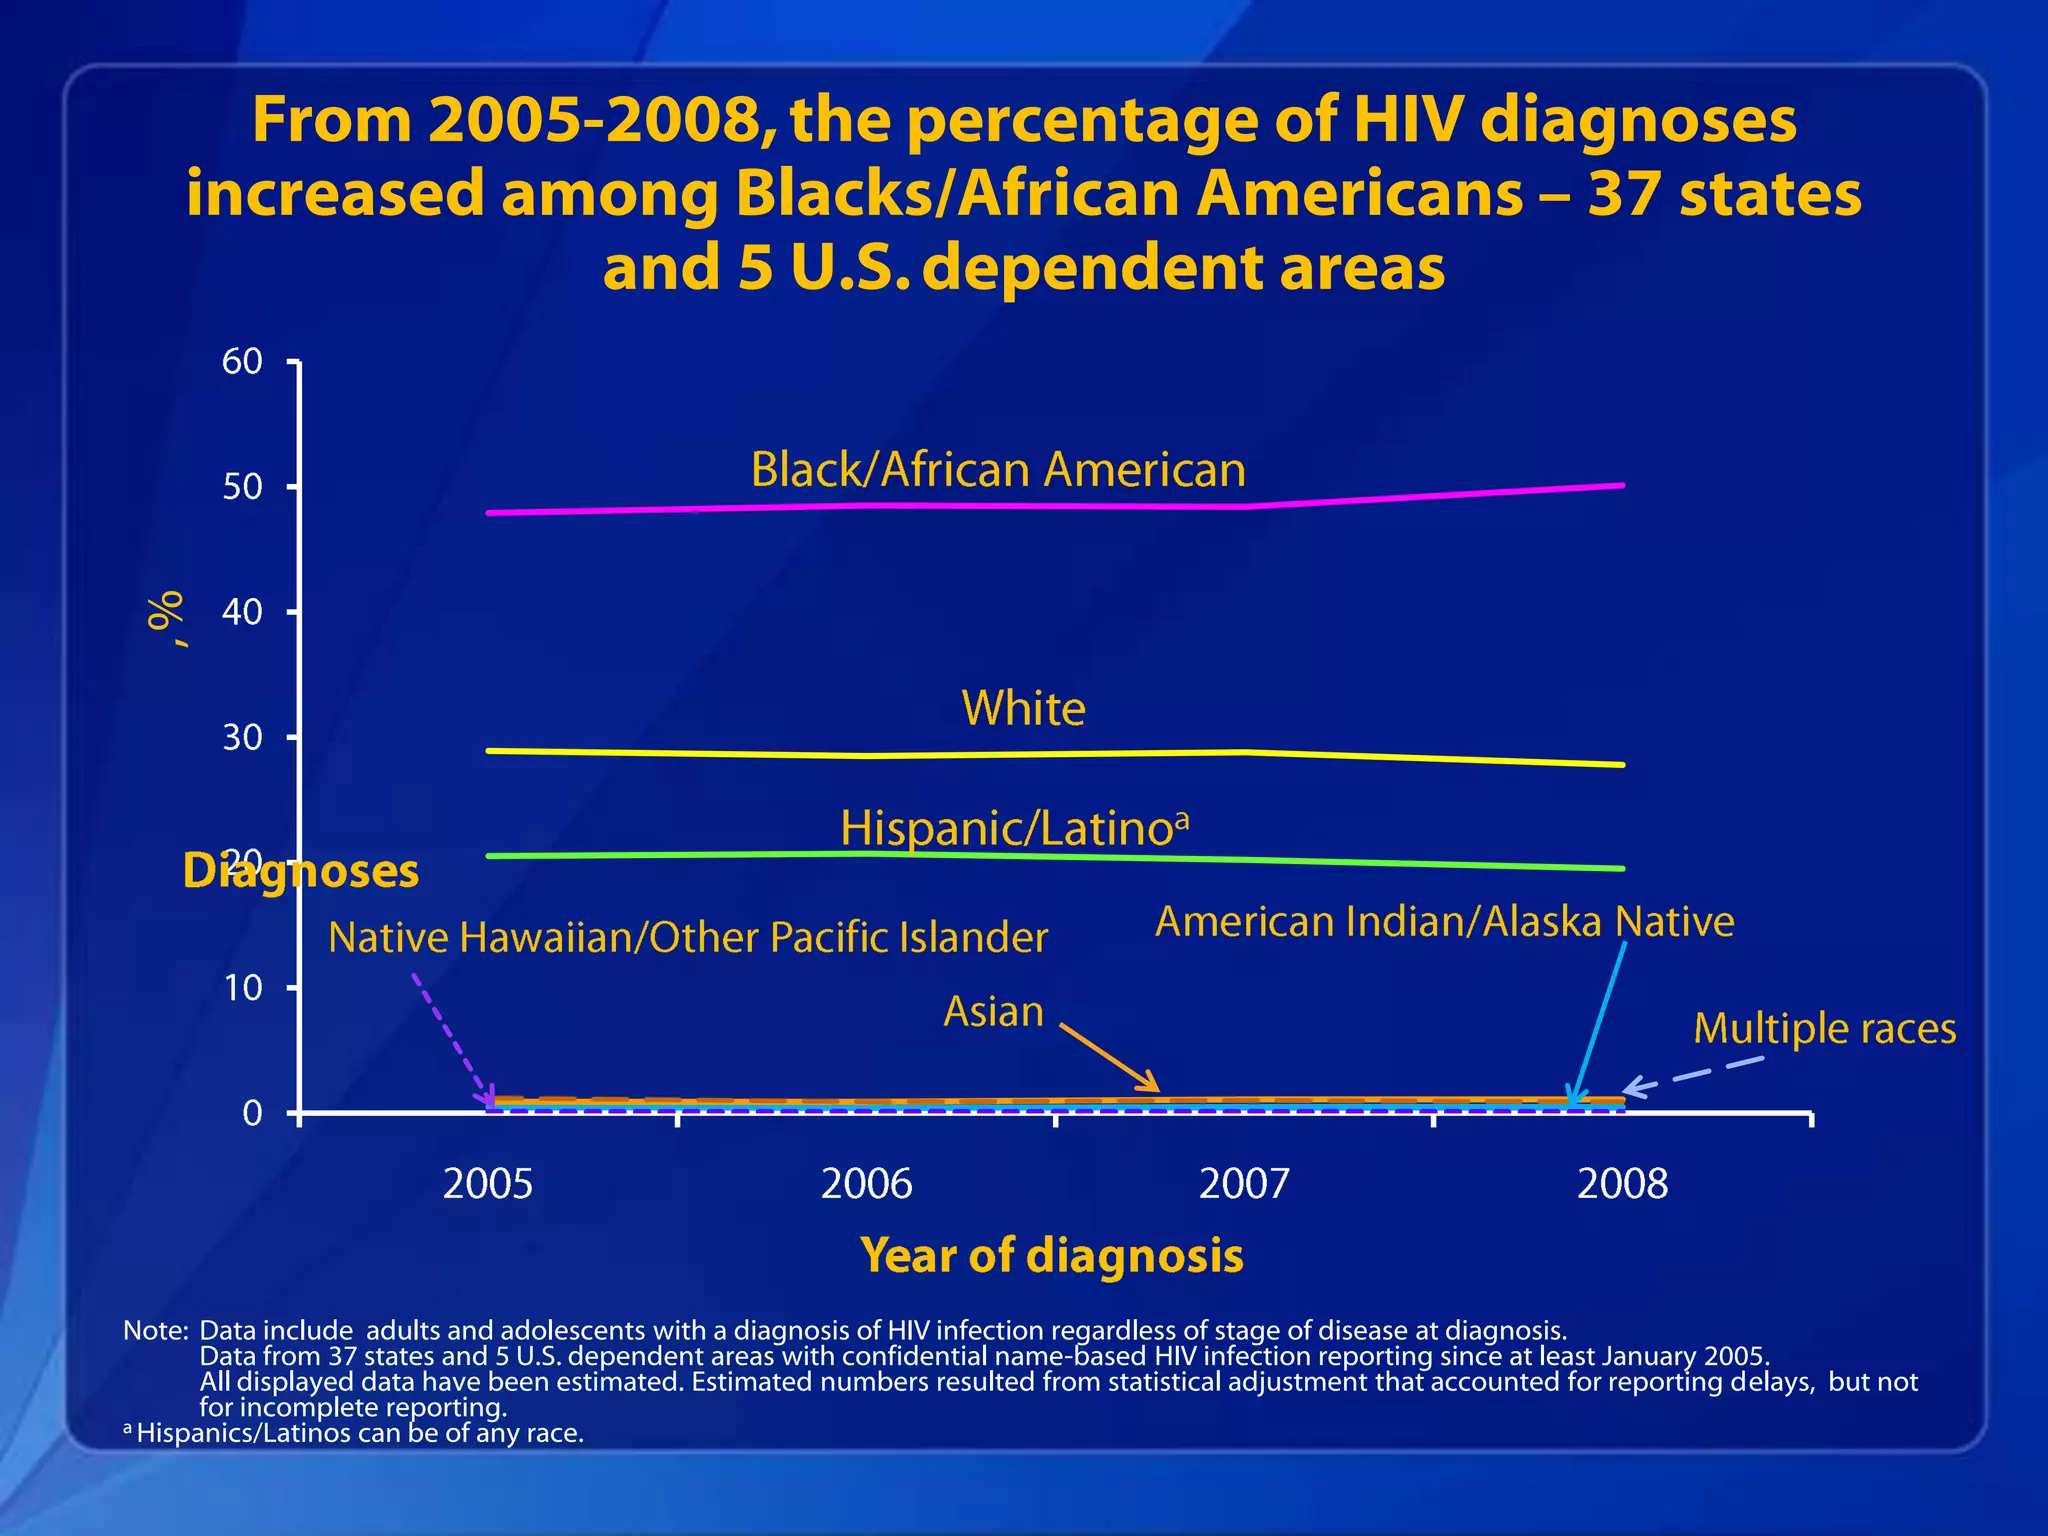
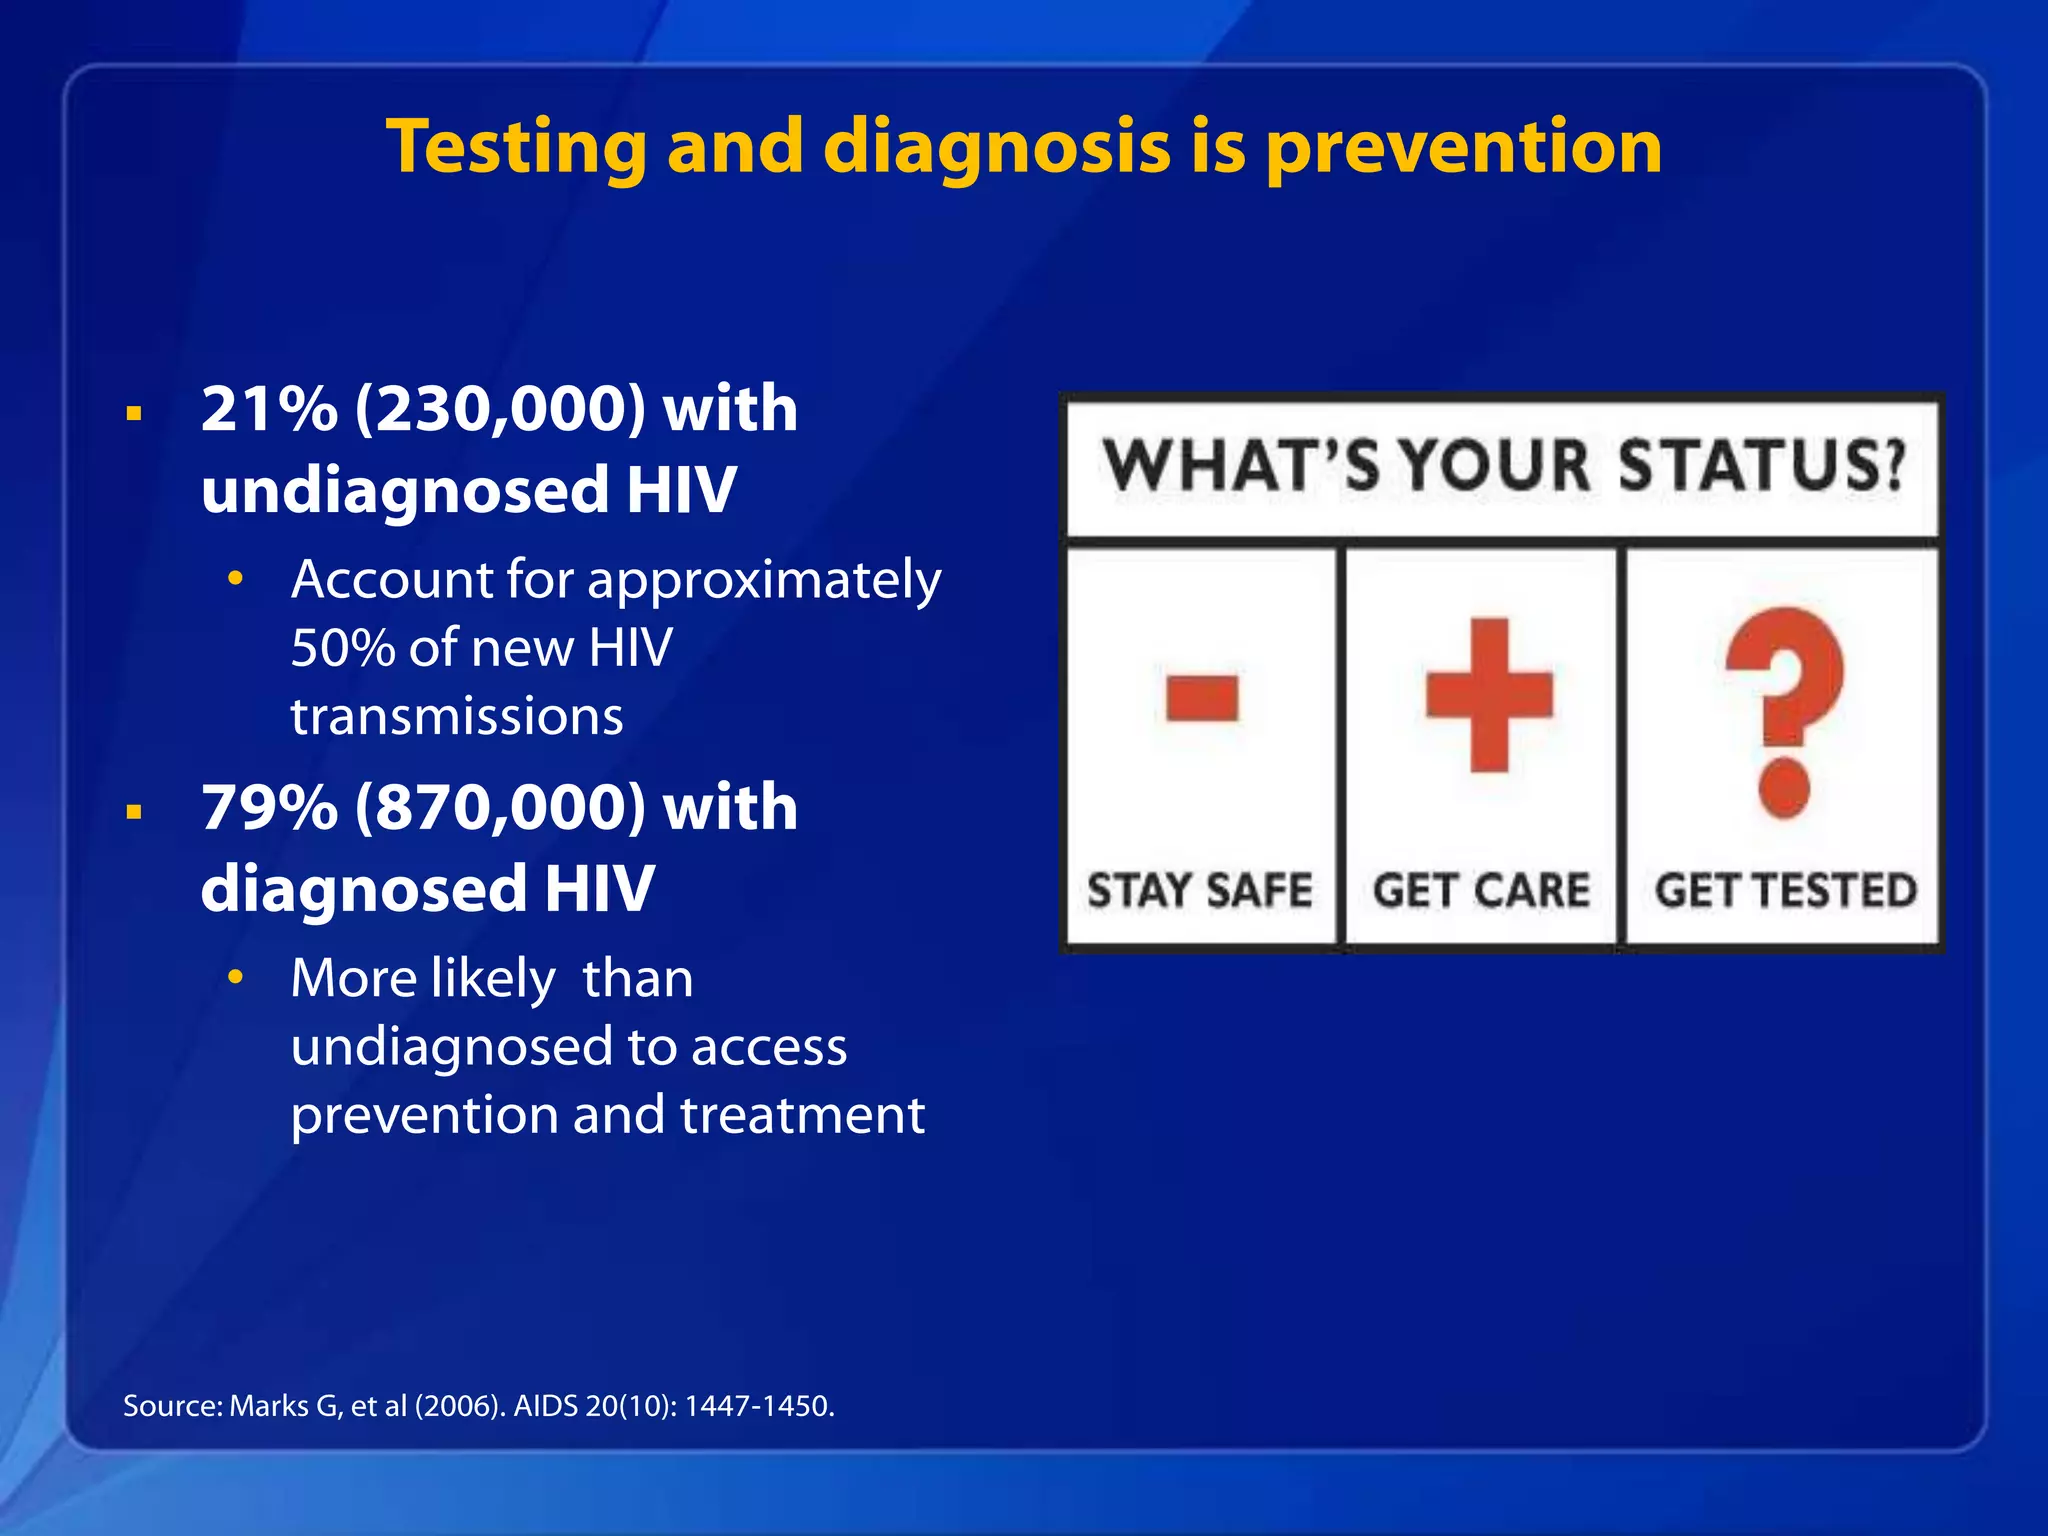
- Over 1.1 million people are living with HIV in the US, with about 56,000 new infections each year. Rates are highest among men who have sex with men, African Americans, Latinos, and intravenous drug users.
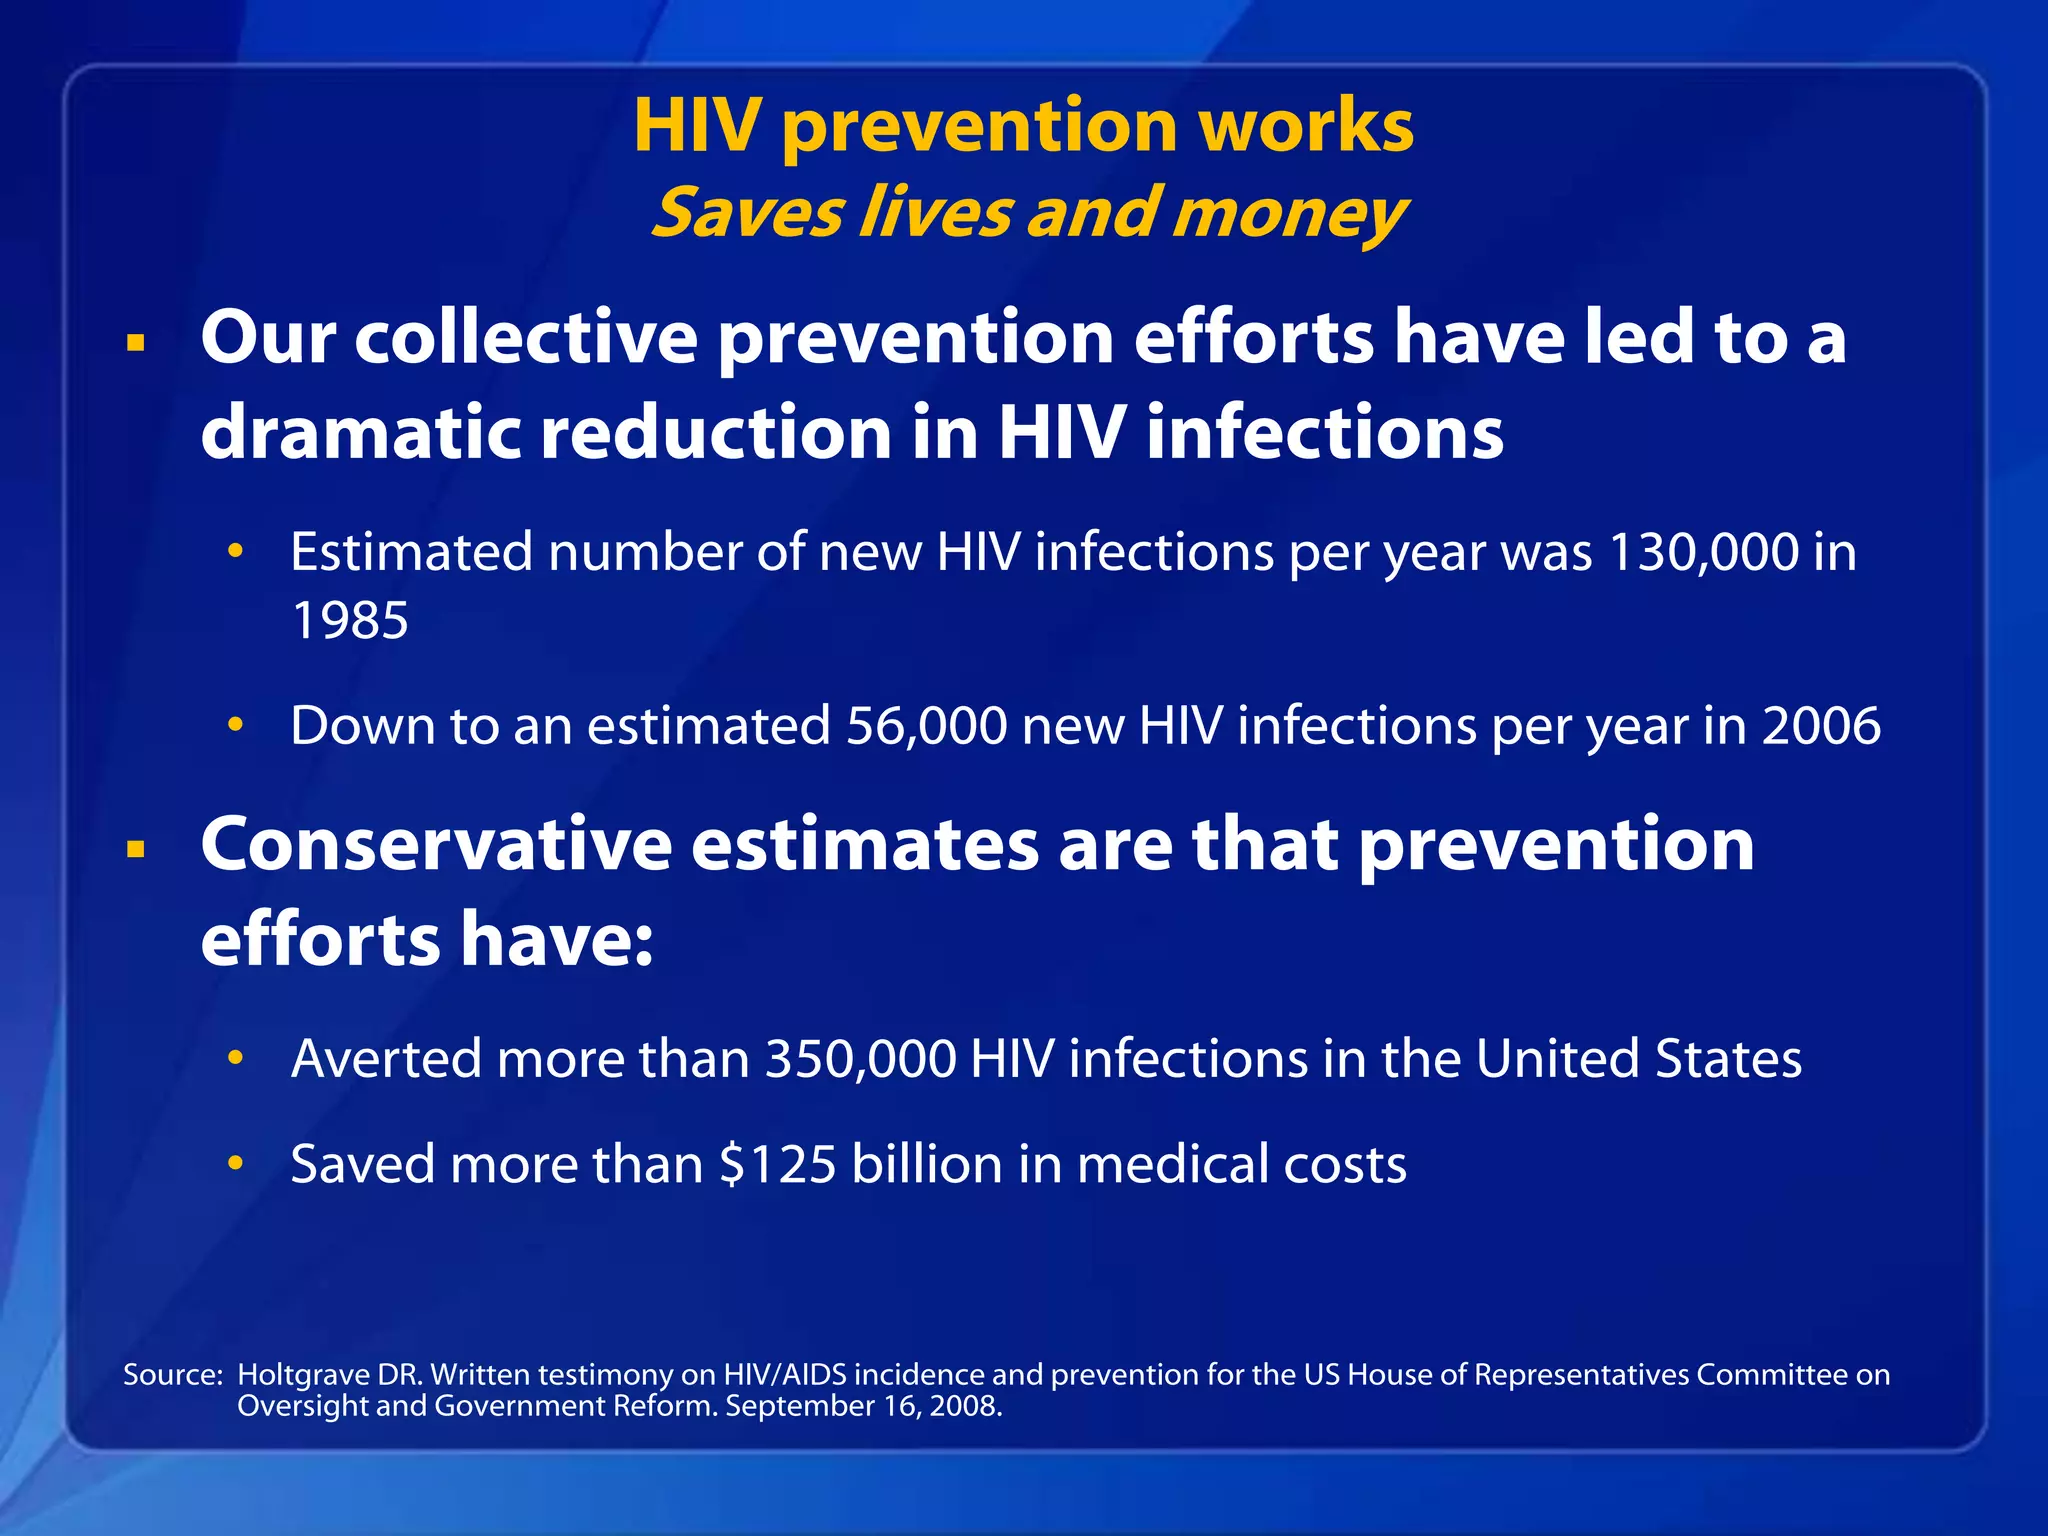
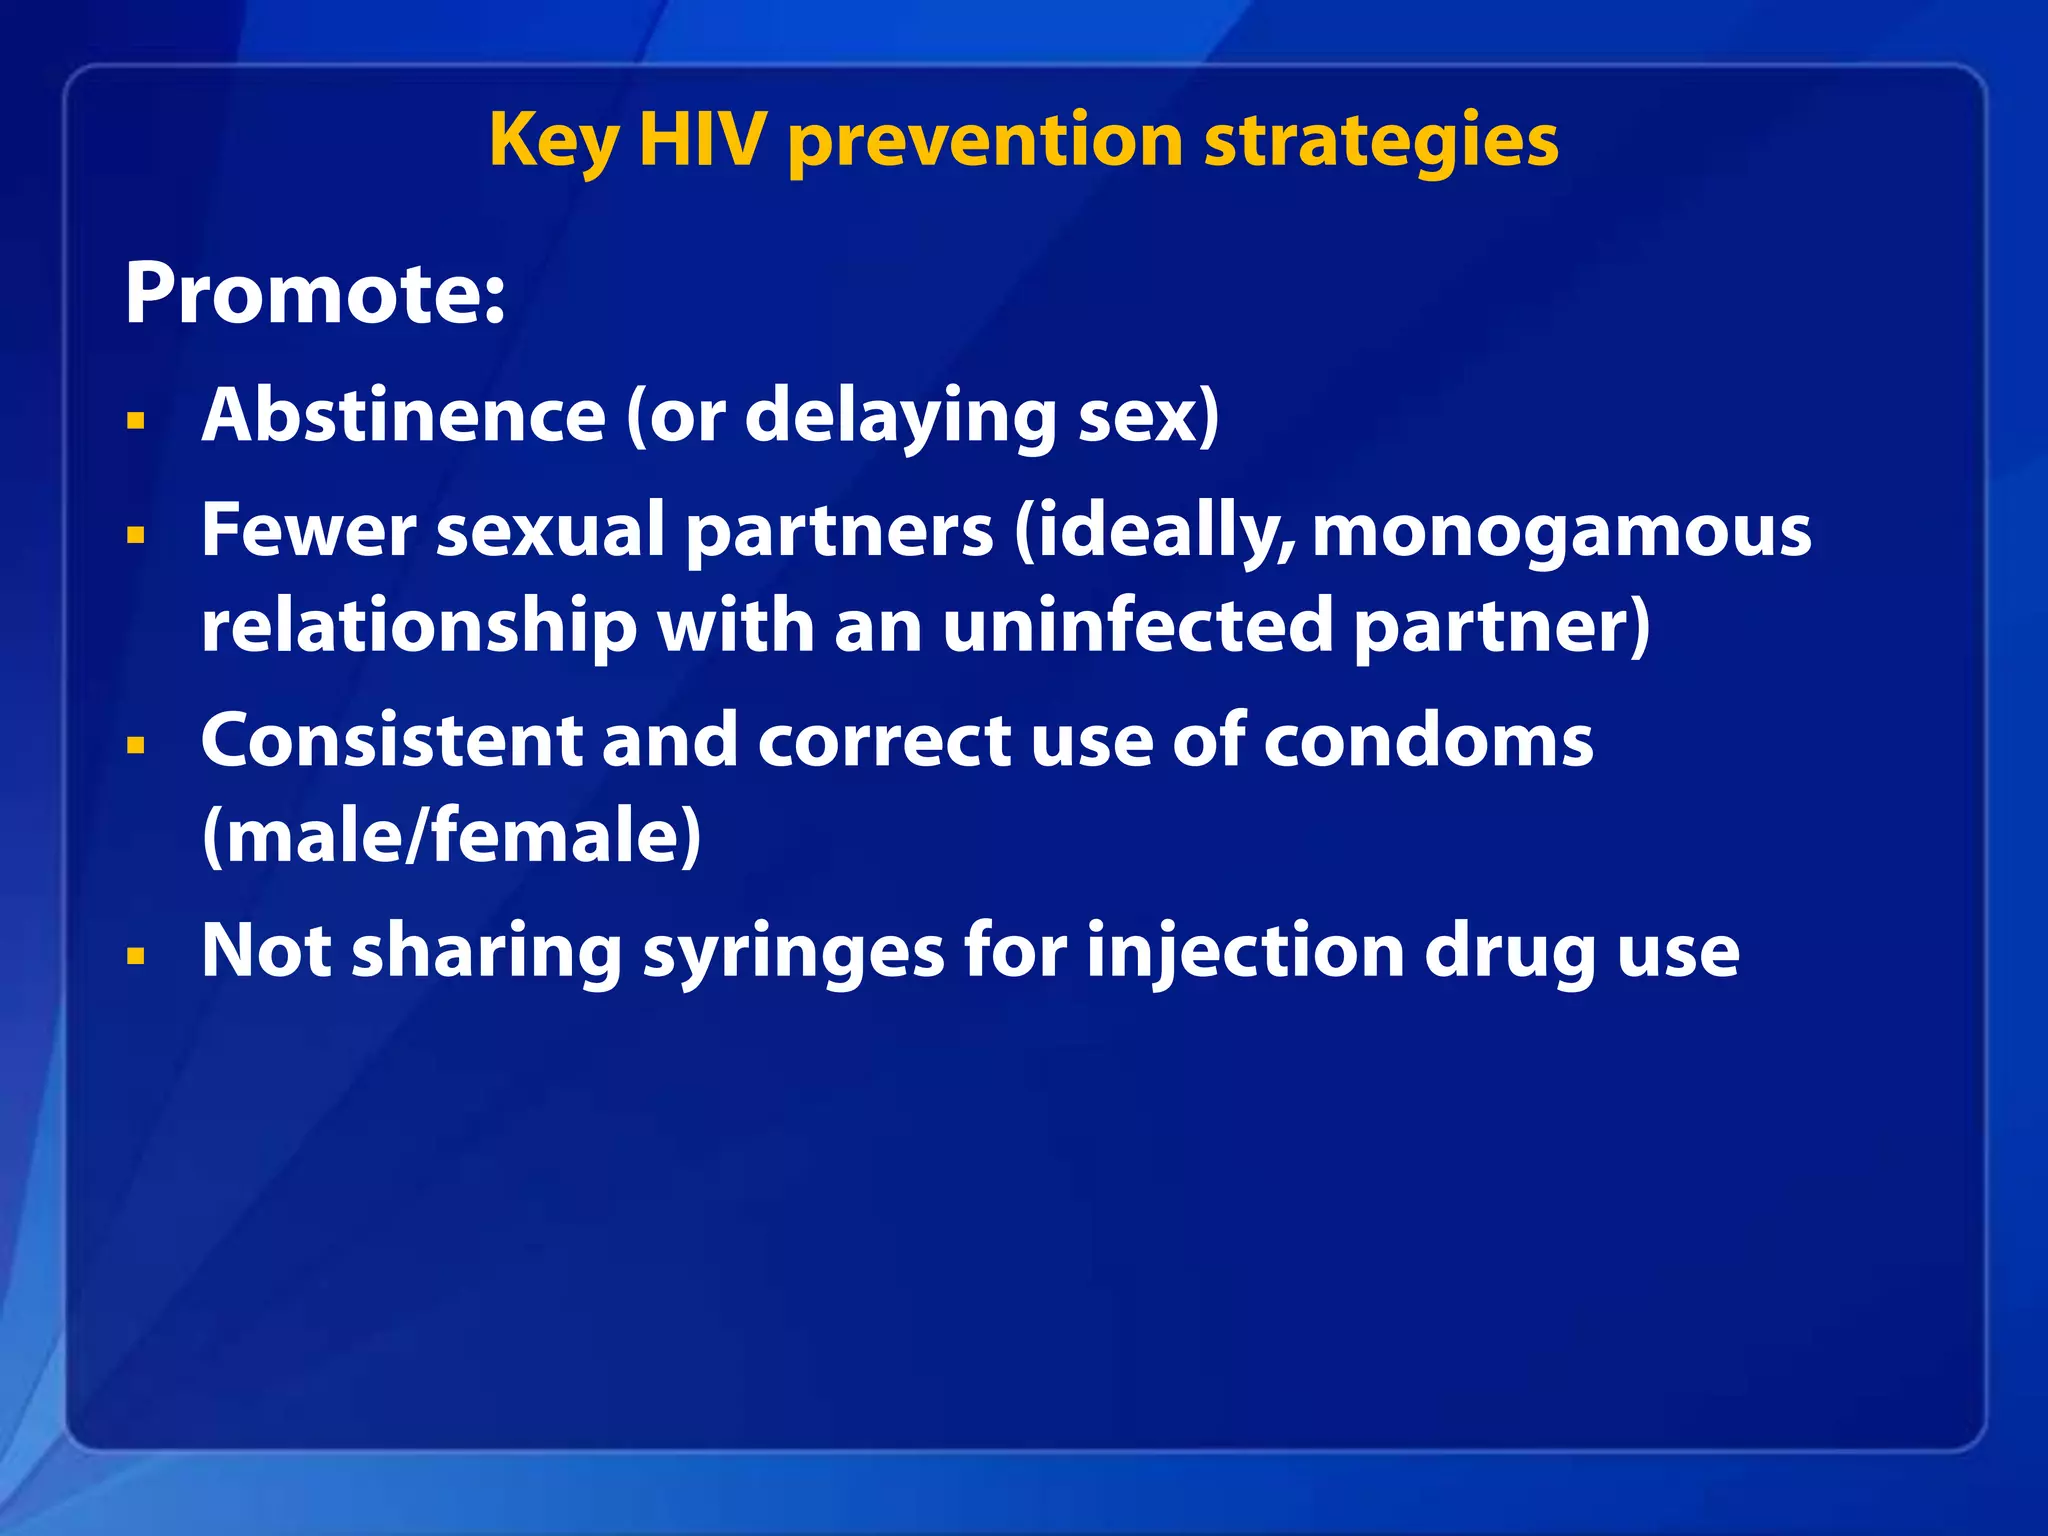
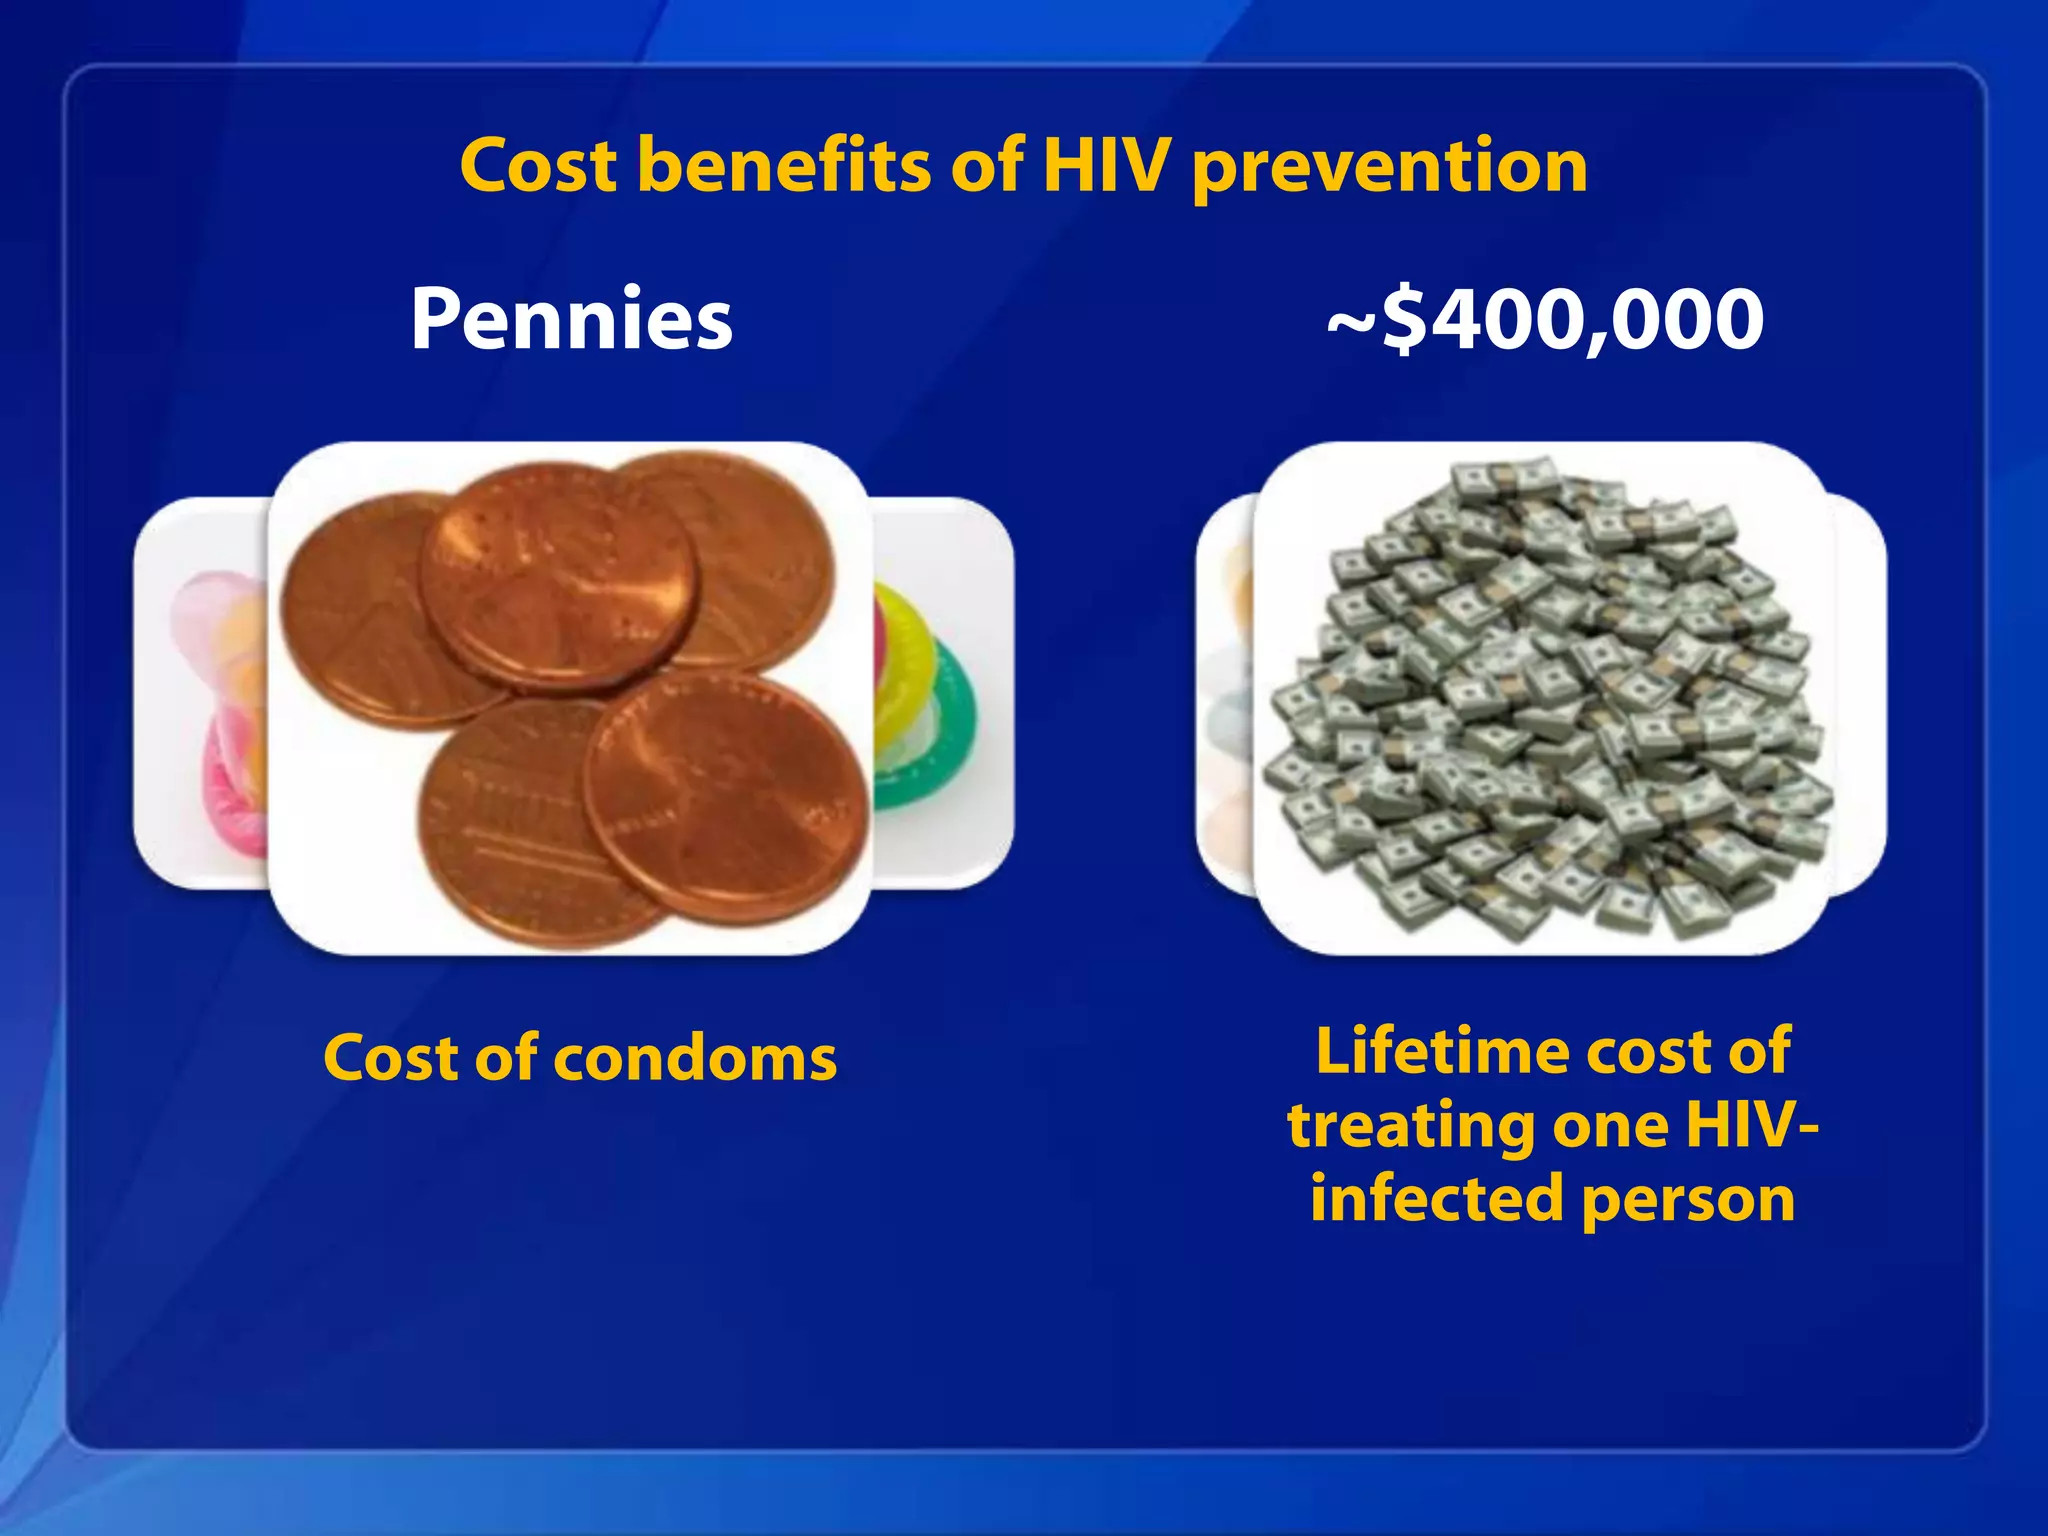
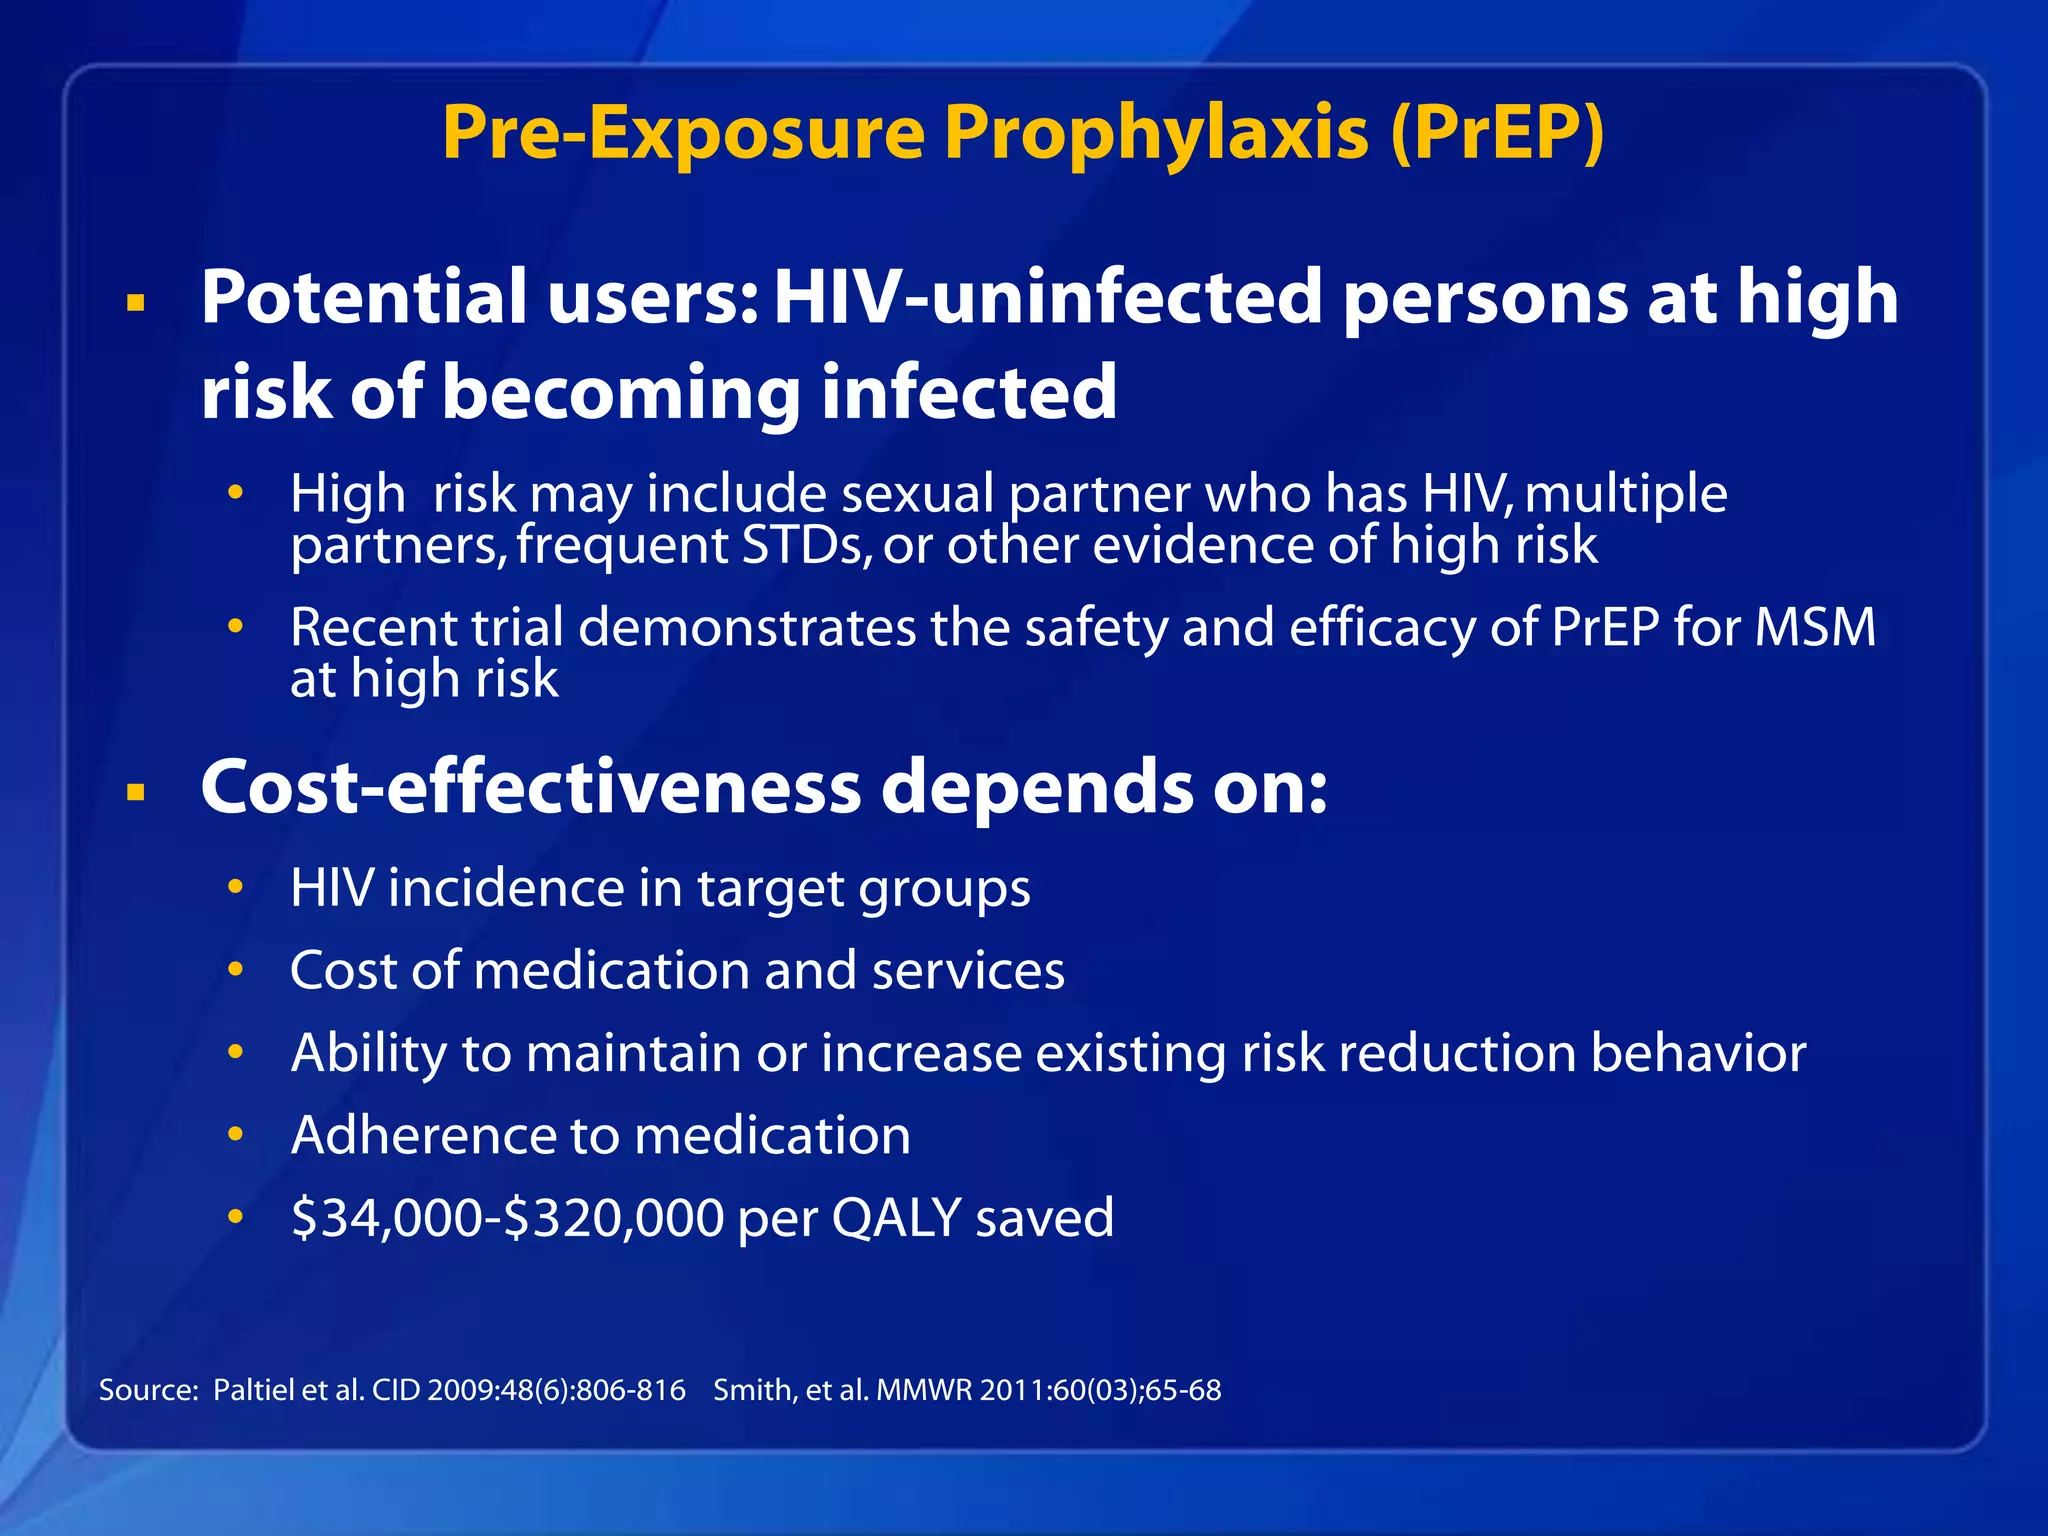
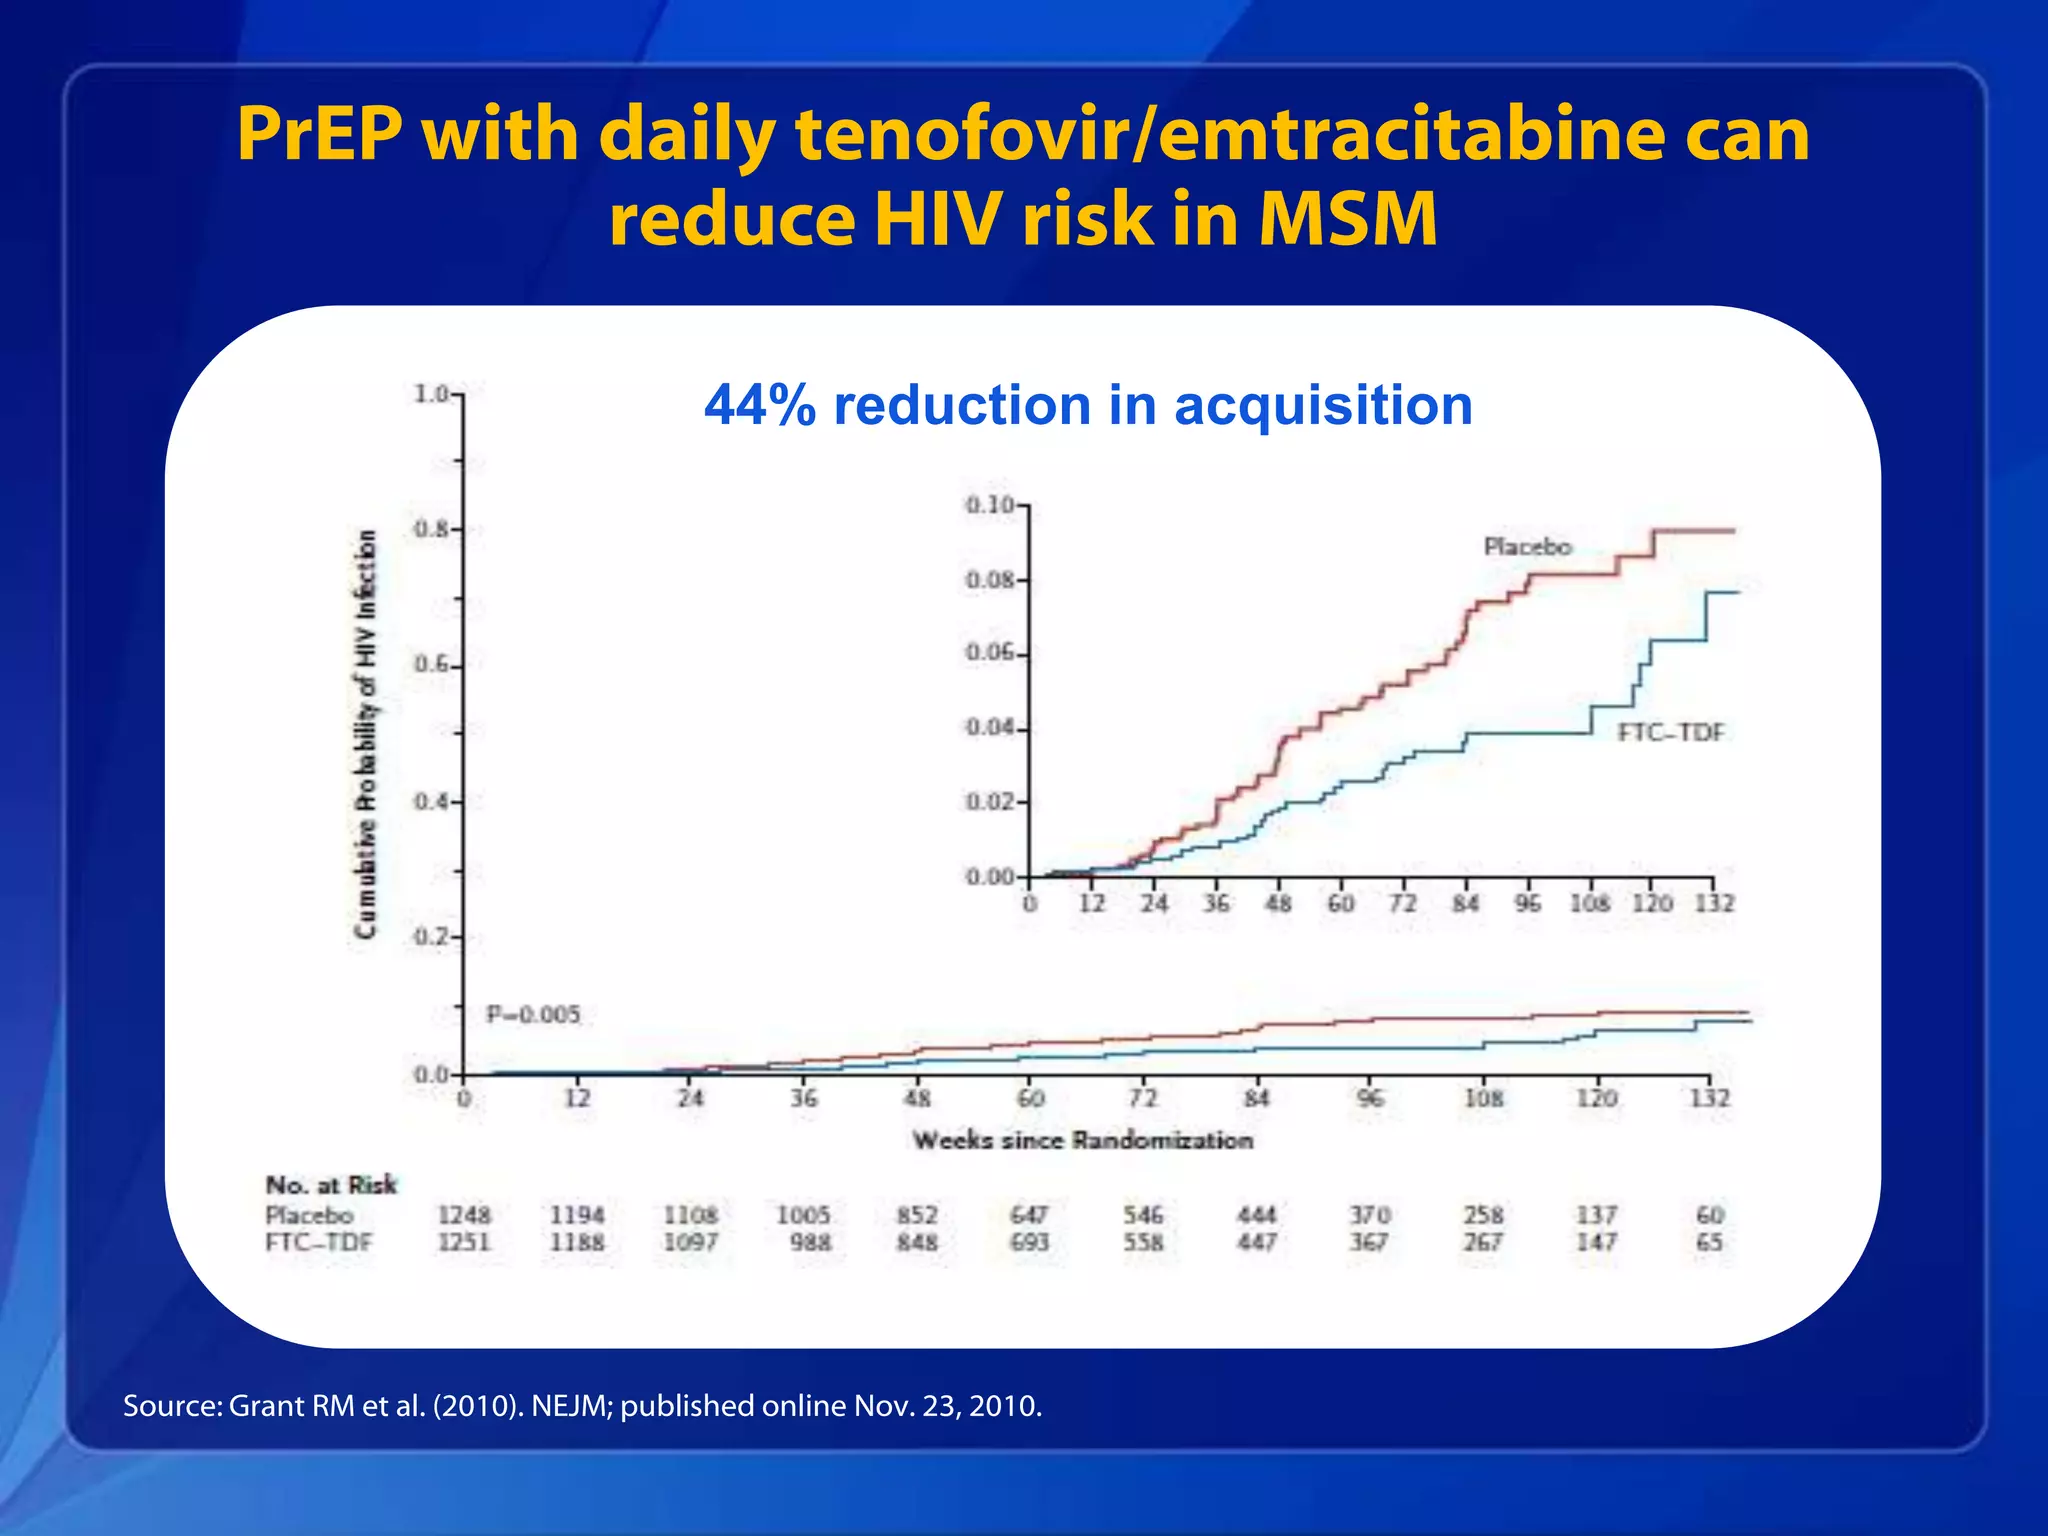
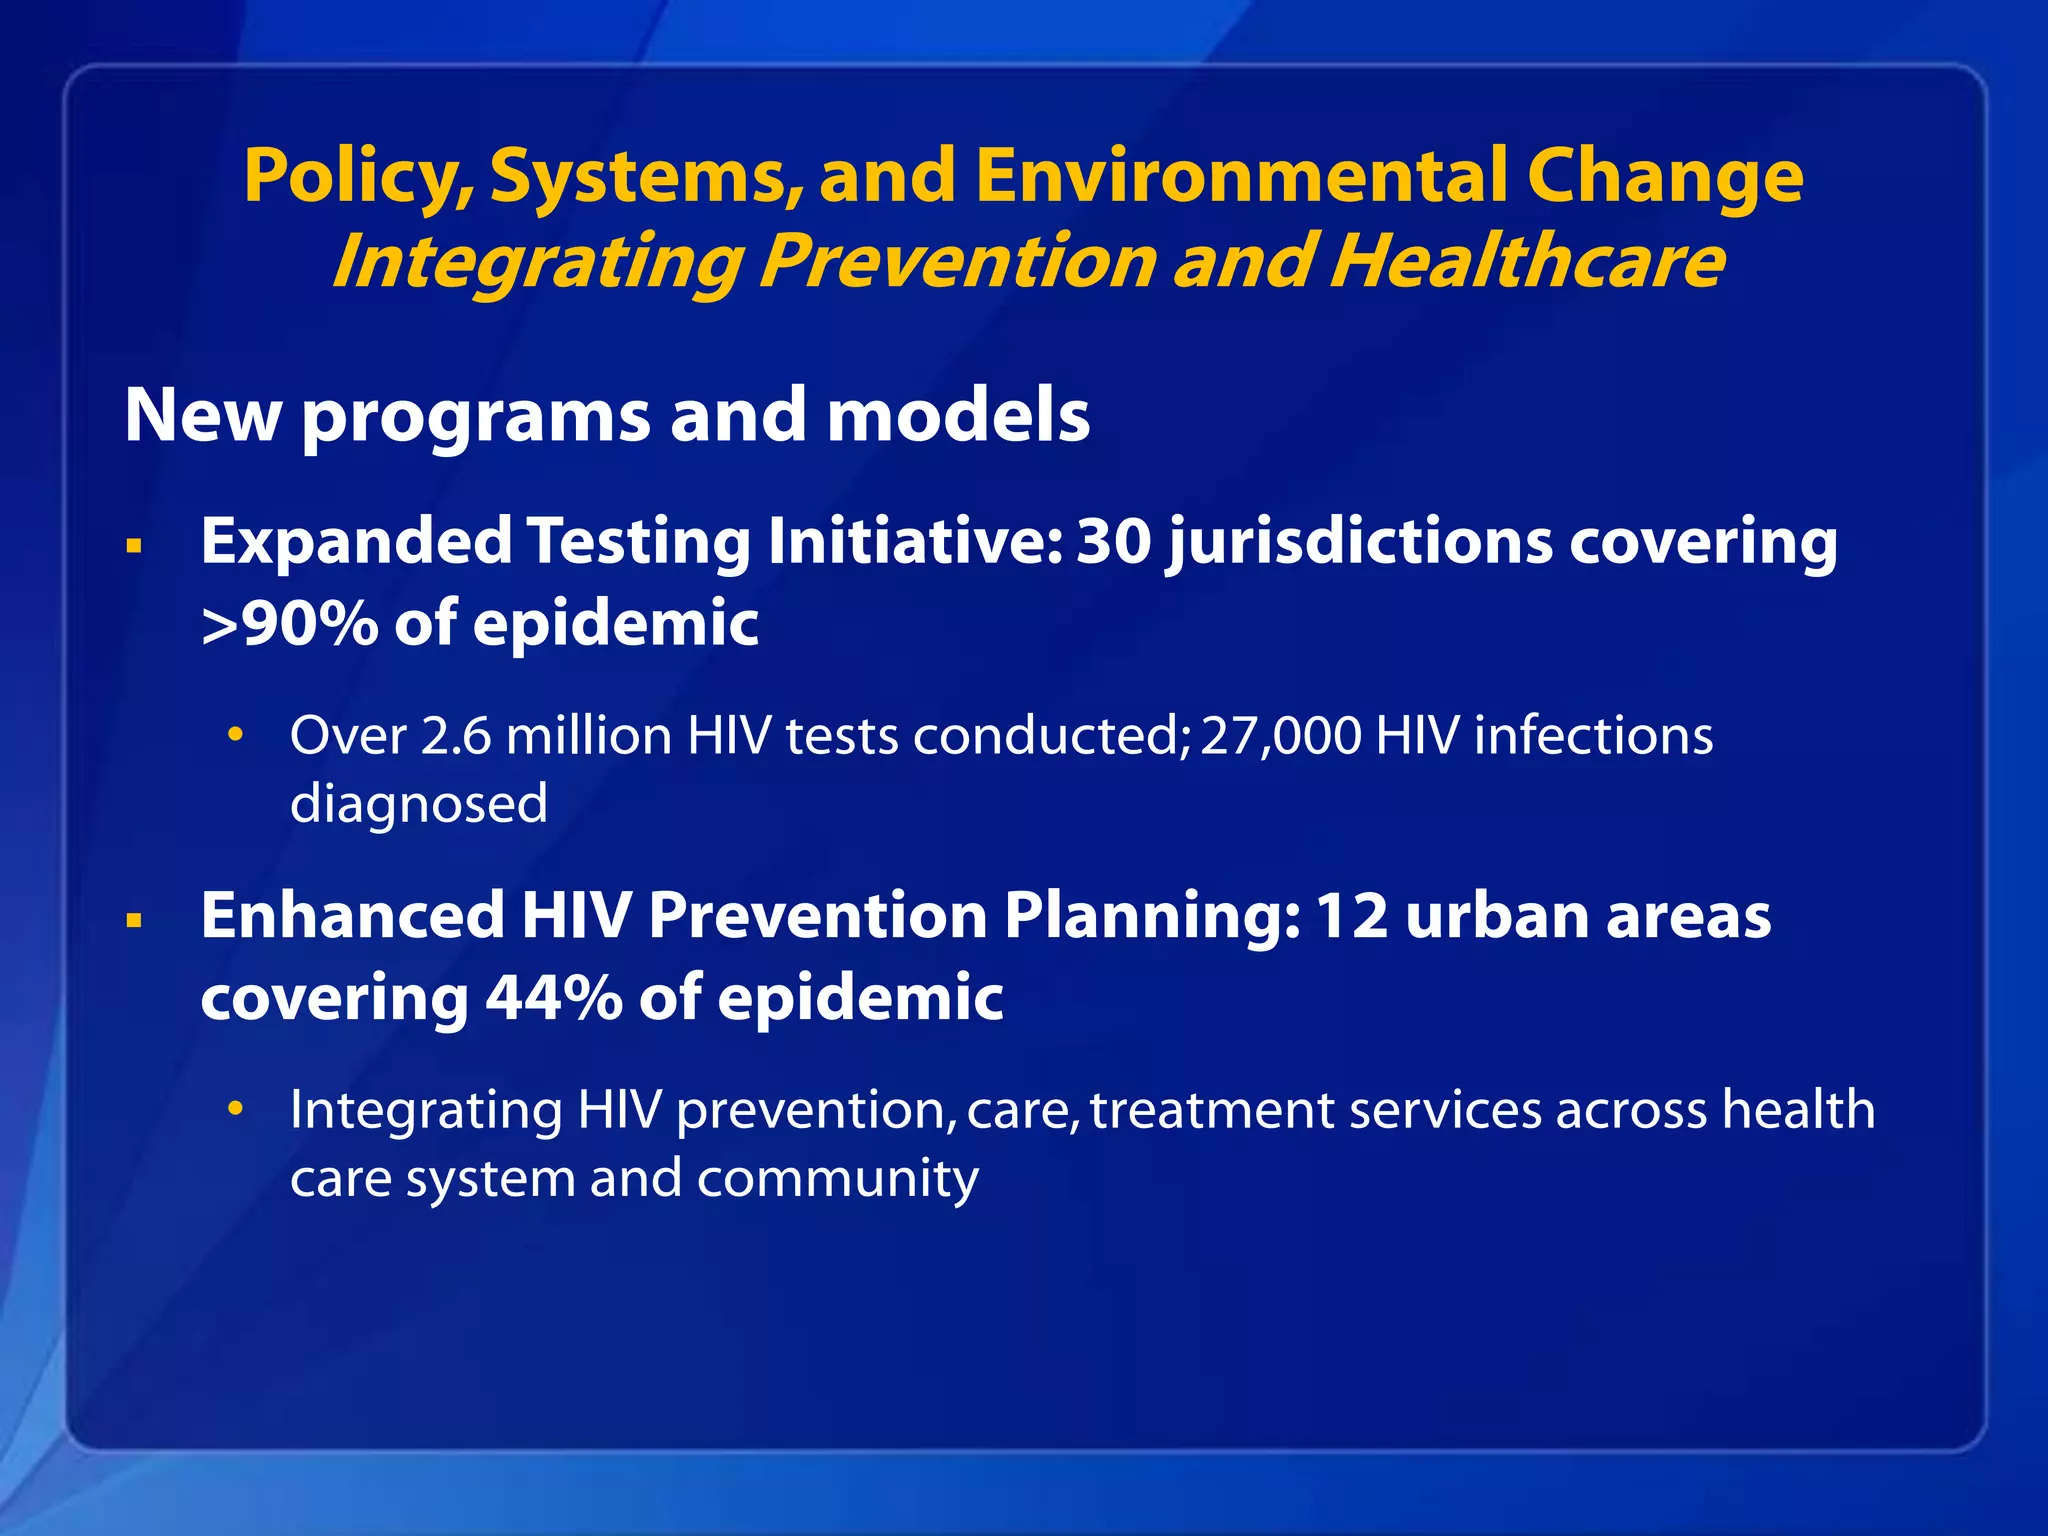
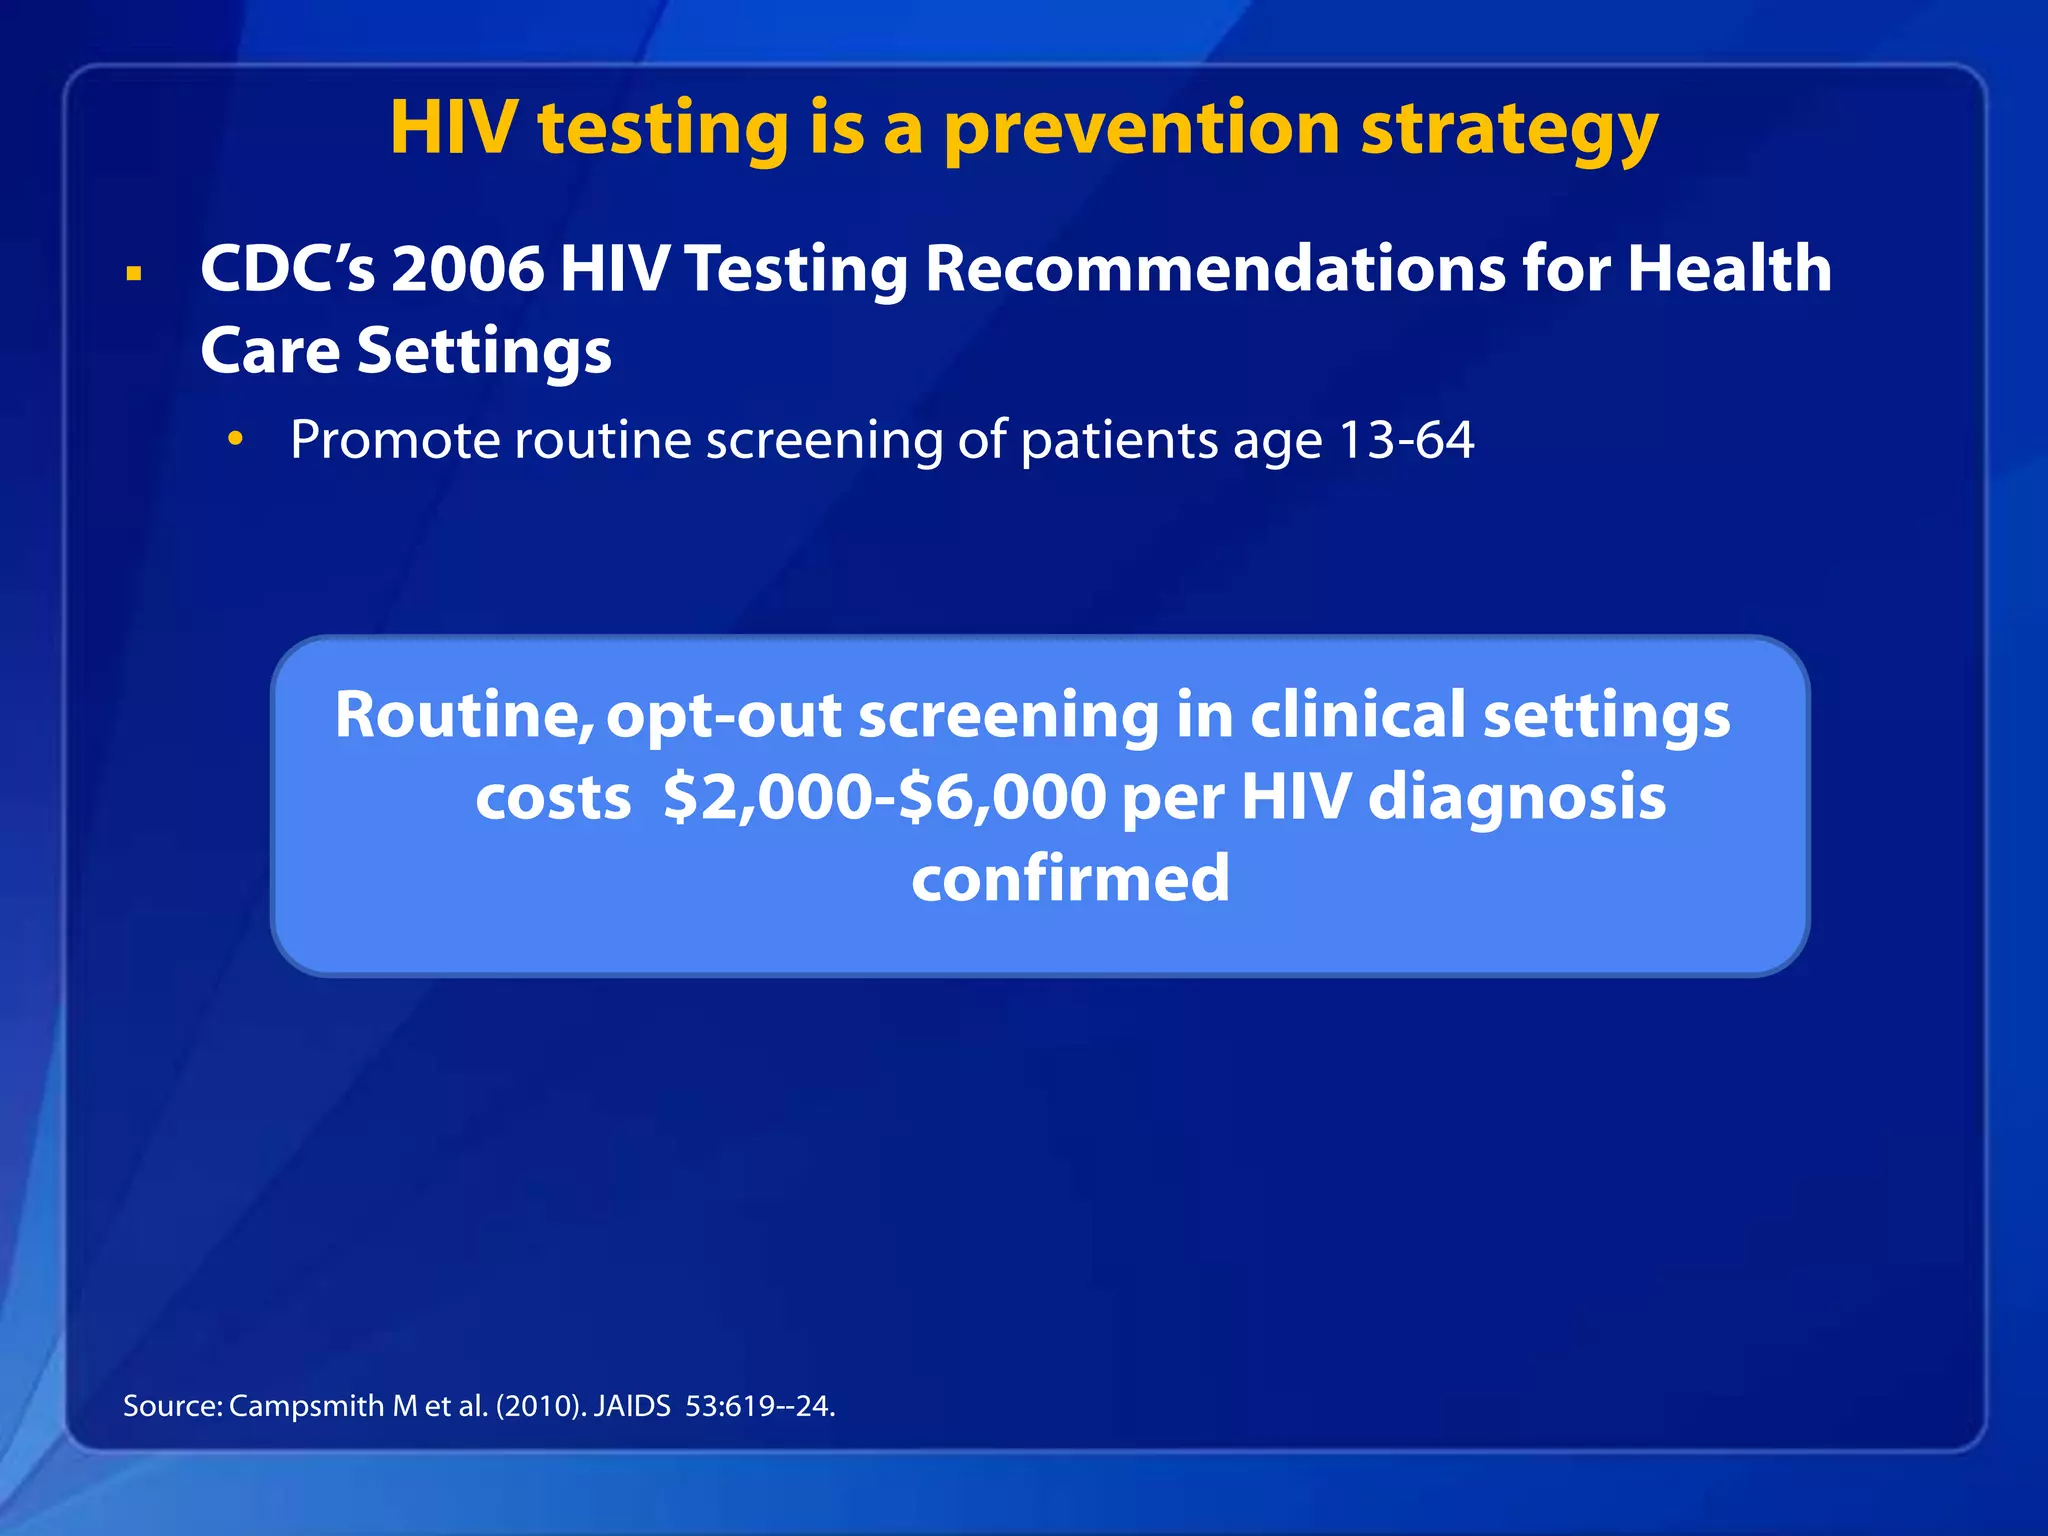
- Effective prevention strategies include promoting abstinence, fewer partners, condom use, not sharing needles, antiretroviral treatment, male circumcision, and pre-exposure prophylaxis. Widespread testing is also an important prevention approach.
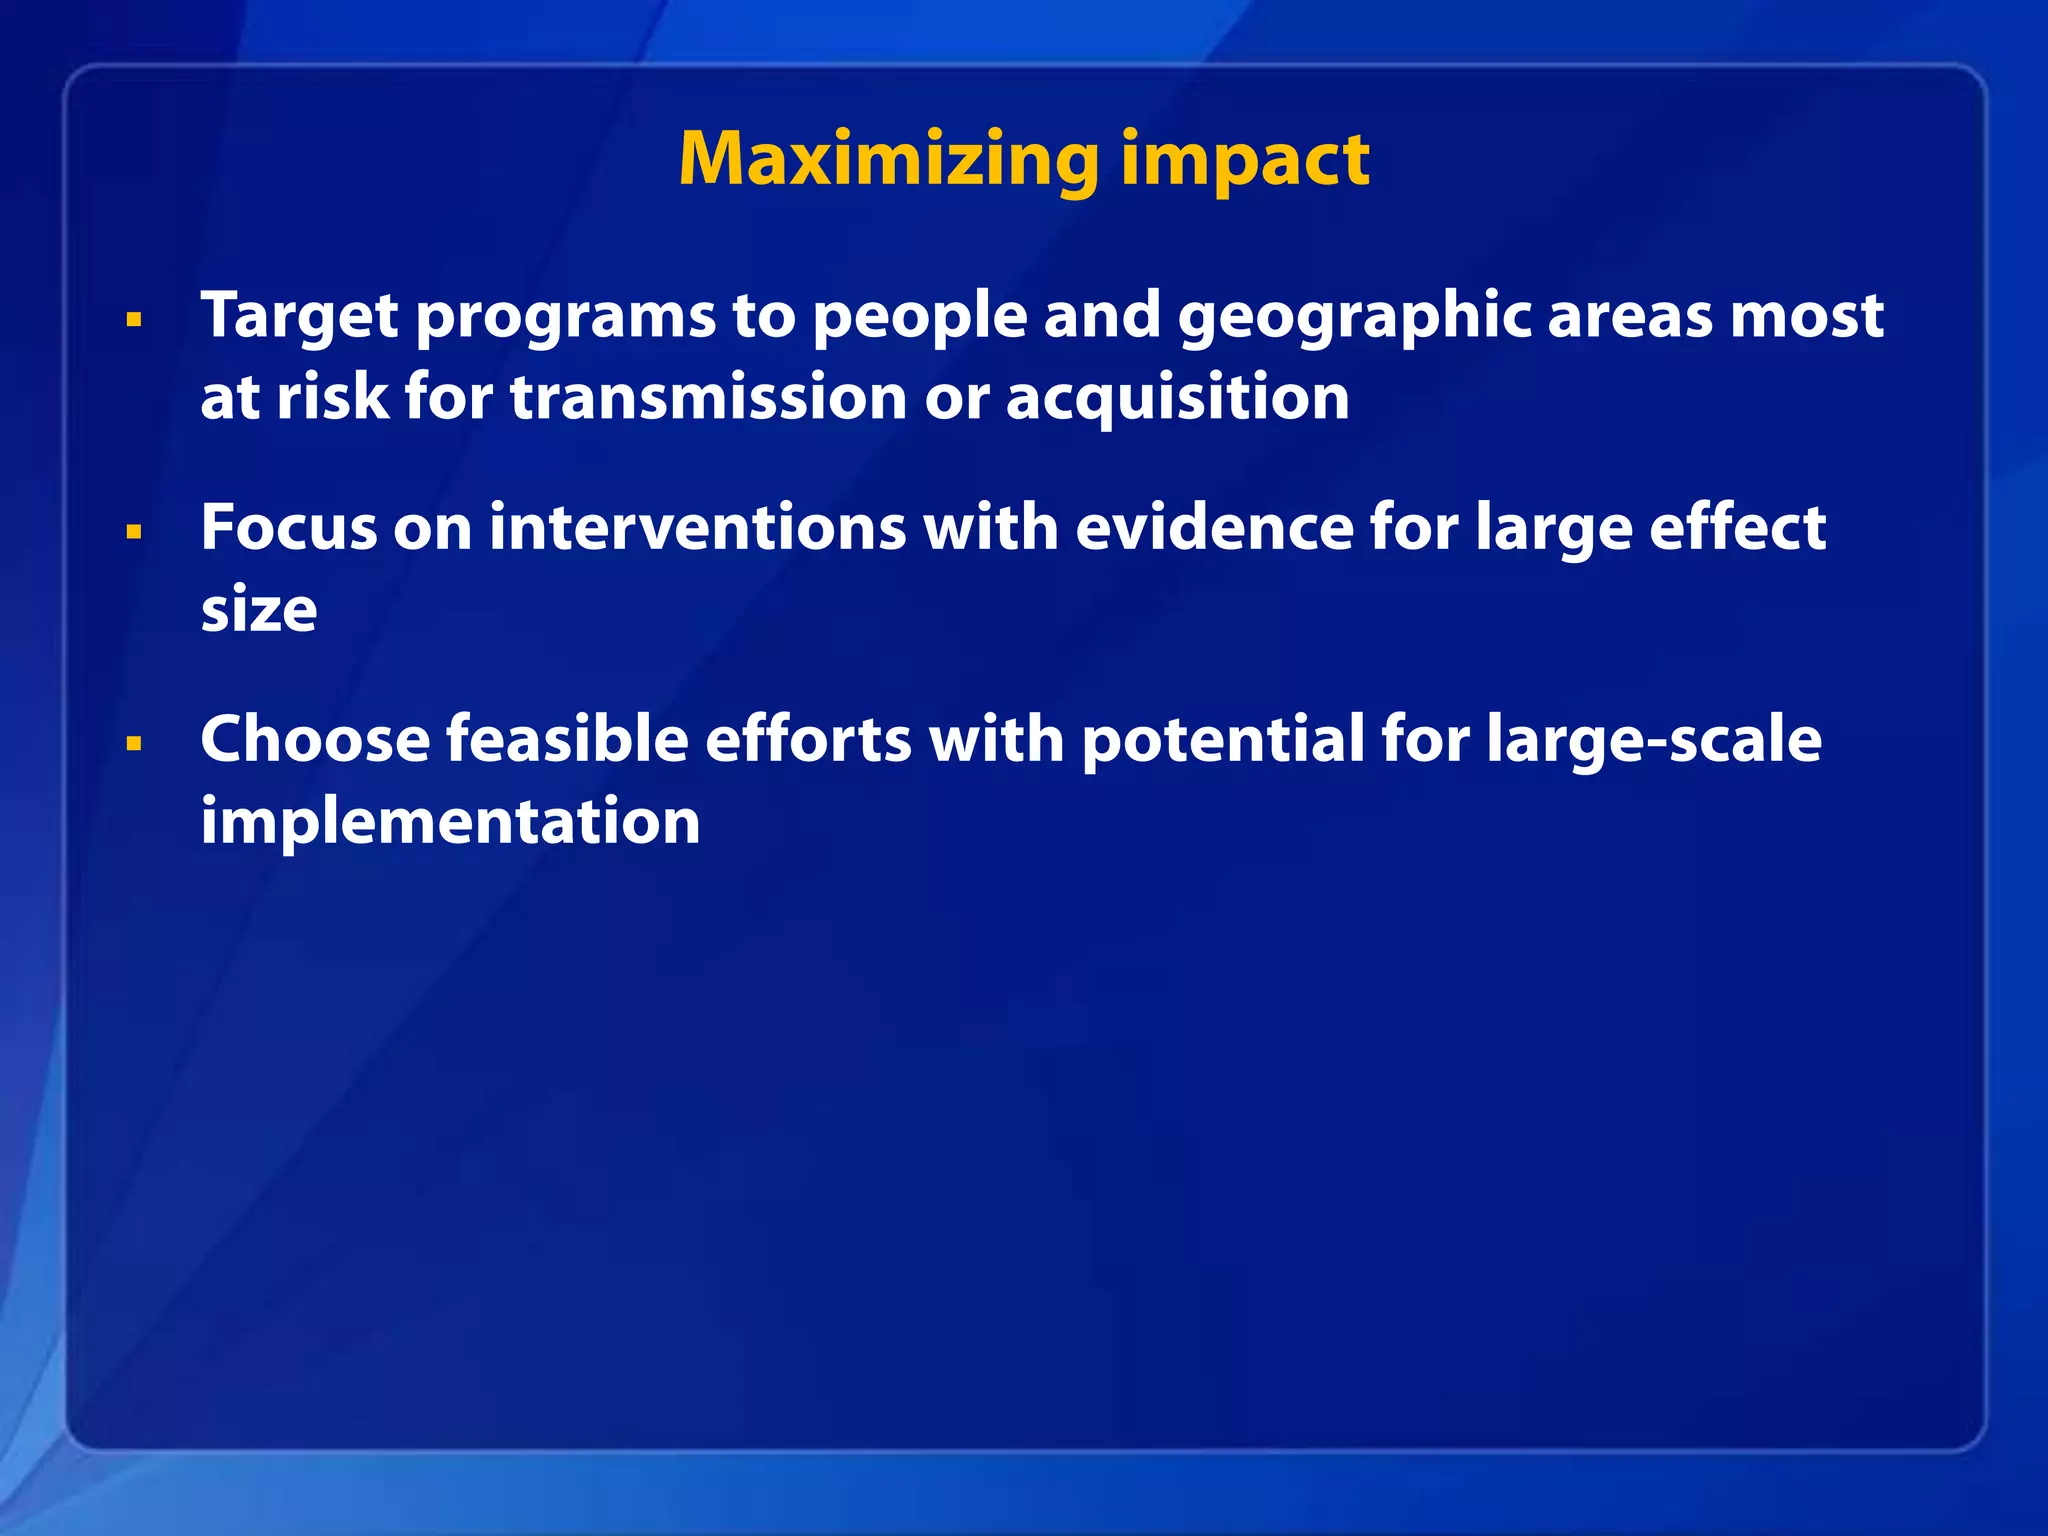
- Combining multiple prevention approaches and targeting high-risk groups can maximize the impact of HIV prevention and reduce transmission rates in the US.
![Other HIV prevention strategies
Antiretroviral drugs (ARVs):
• To prevent perinatal
transmission
• To reduce infectiousness
• To prevent new infections (as
Pre-Exposure Prophylaxis
[PrEP])
Male circumcision
• To reduce risk of HIV infection
through penile-vaginal sex](https://image.slidesharecdn.com/hivwinnablebattlespresentation1-111121091544-phpapp02/75/HIV-Winnable-Battle-presentation-11-2048.jpg)


![2014_HIV_prevention_and_control[1].pptx](https://cdn.slidesharecdn.com/ss_thumbnails/2014hivpreventionandcontrol1-220810084127-bc7e0dd9-thumbnail.jpg?width=640&height=640&fit=bounds)
![Hiv aids part 1[6]](https://cdn.slidesharecdn.com/ss_thumbnails/hivaidspart16-111114103159-phpapp02-thumbnail.jpg?width=640&height=640&fit=bounds)


