Tobacco Control:

              A Winnable Battle


U.S. Department of Health and Human Services
Centers for Disease Control and Prevention
Tobacco use damages virtually
    every part of the body

Smoking          Secondhand Smoke
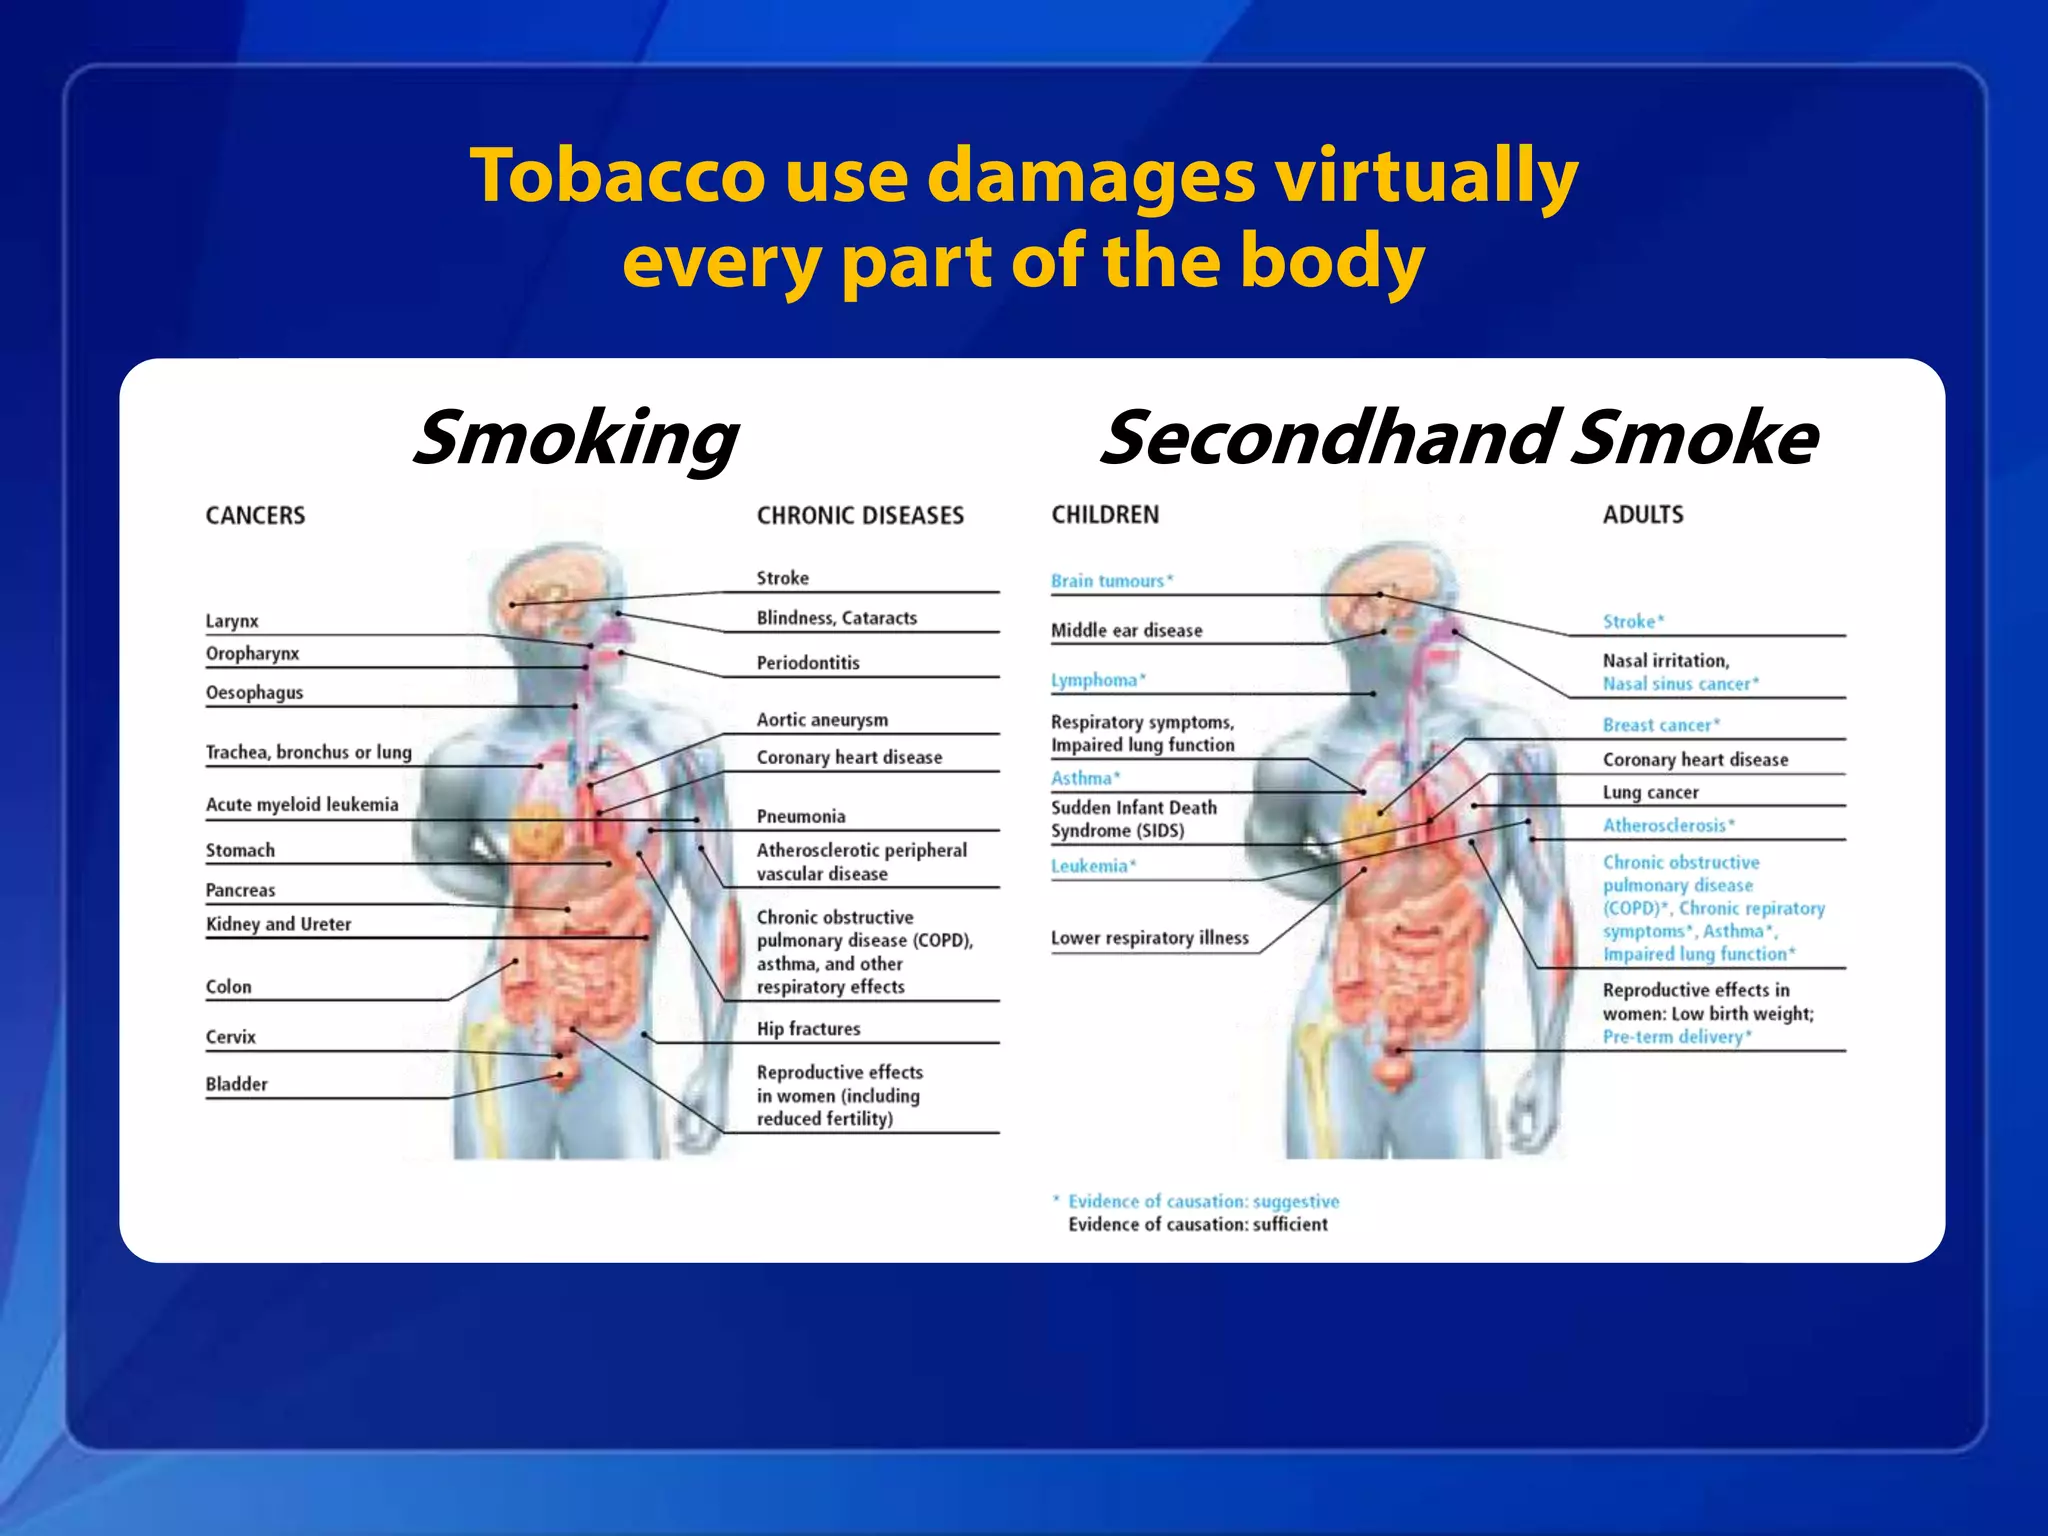
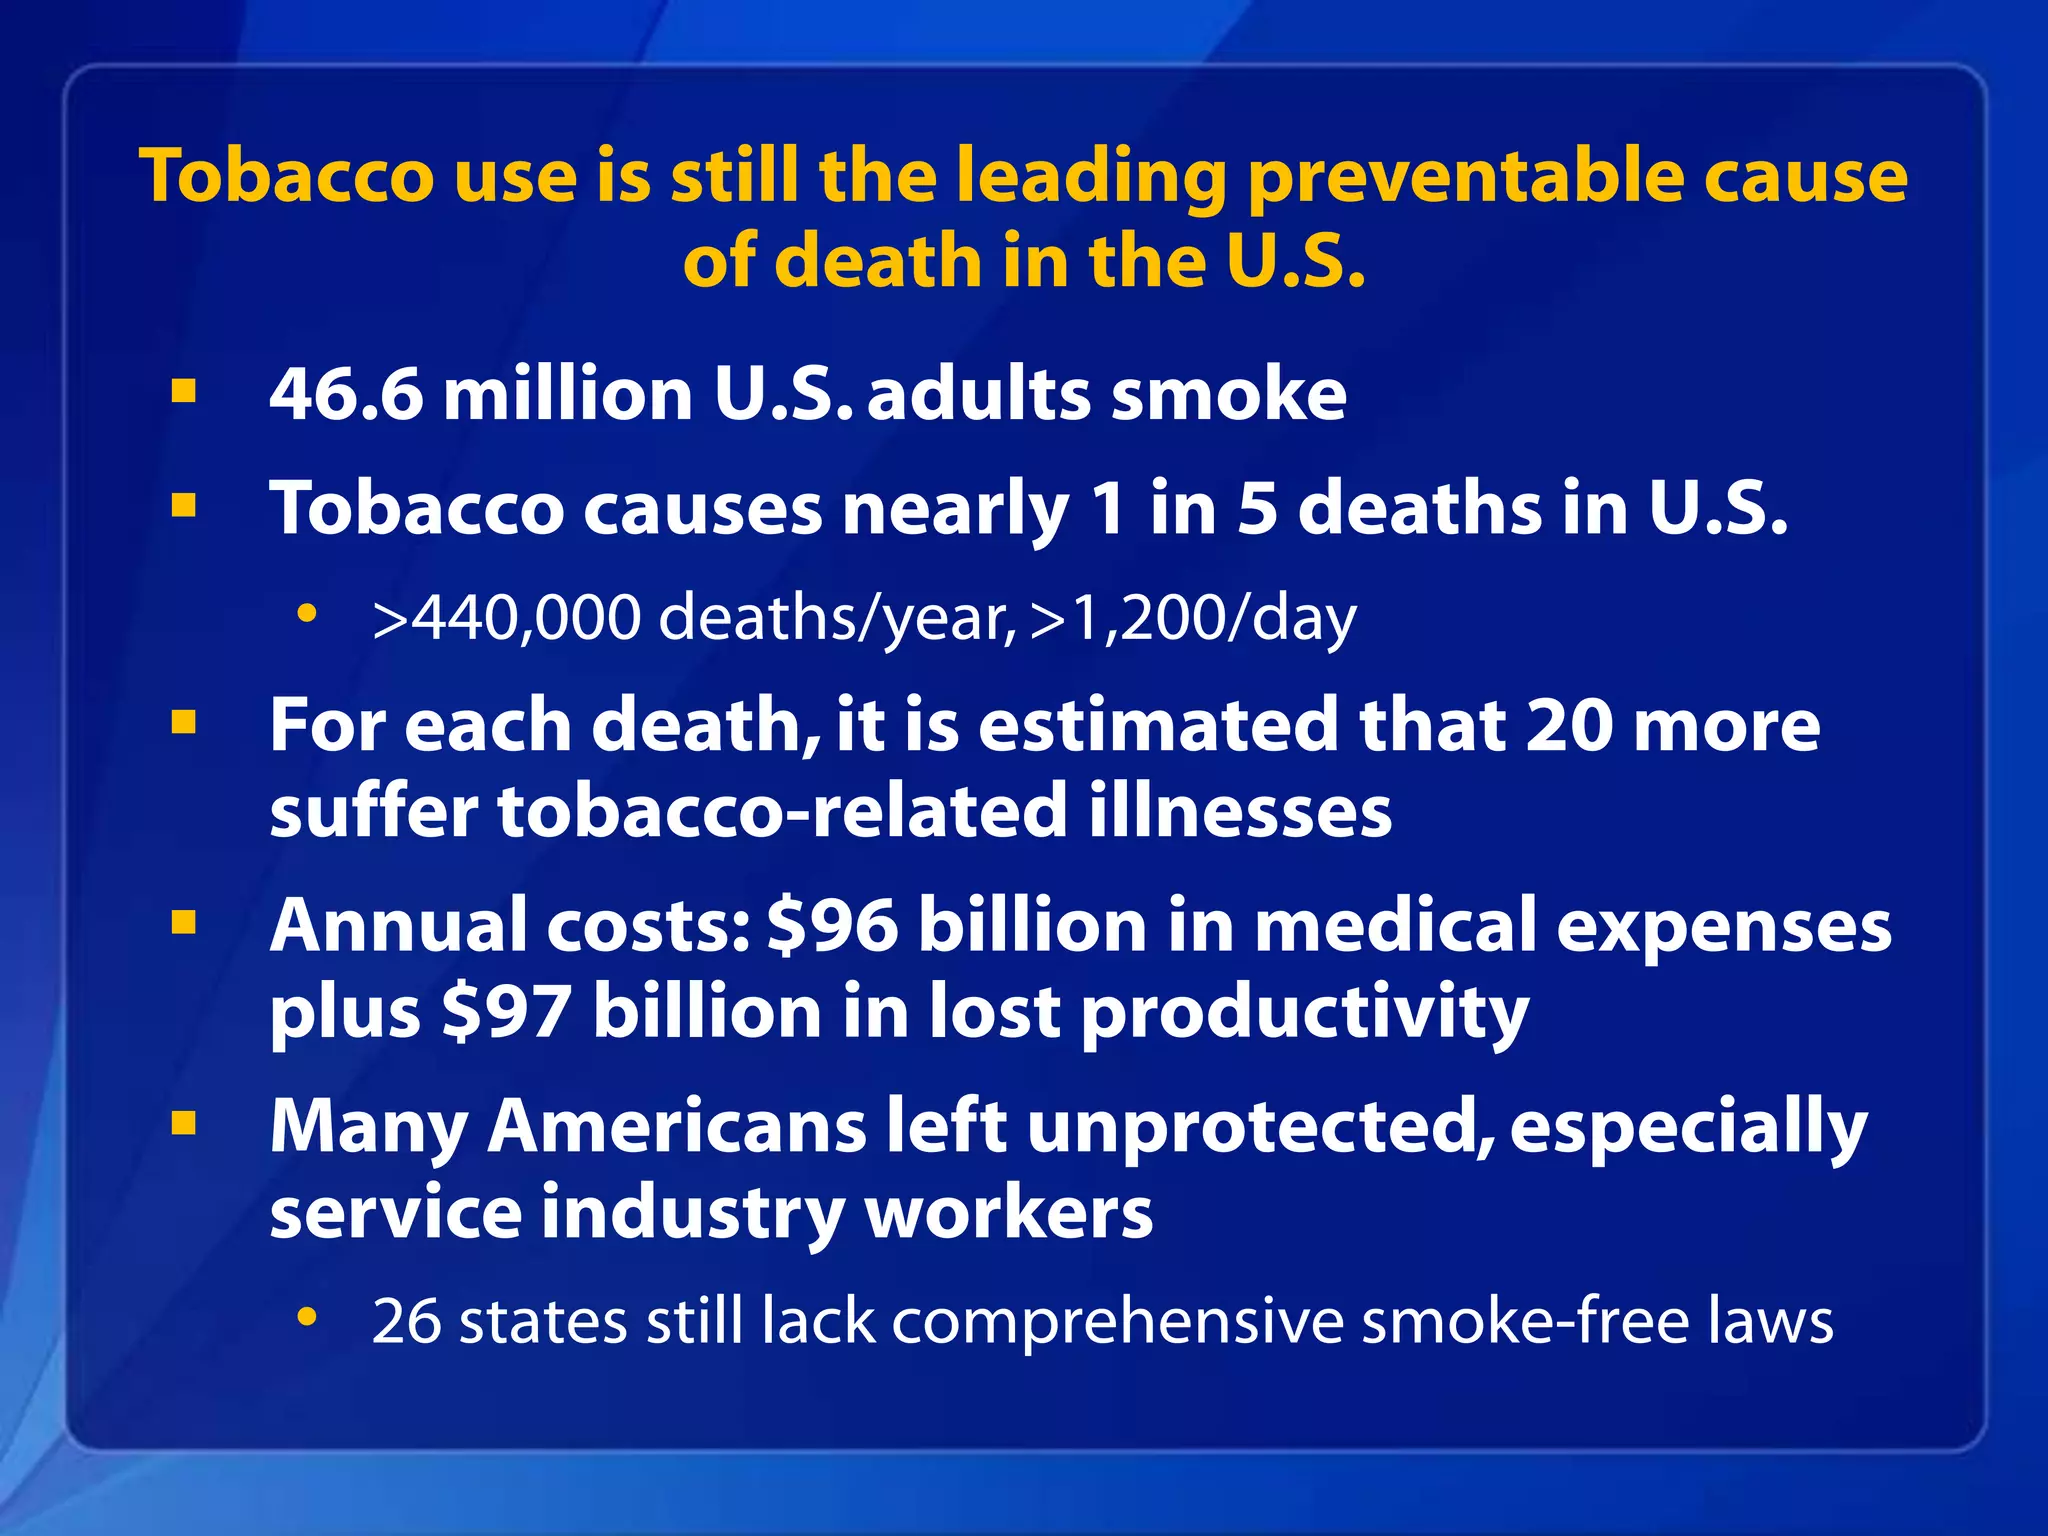
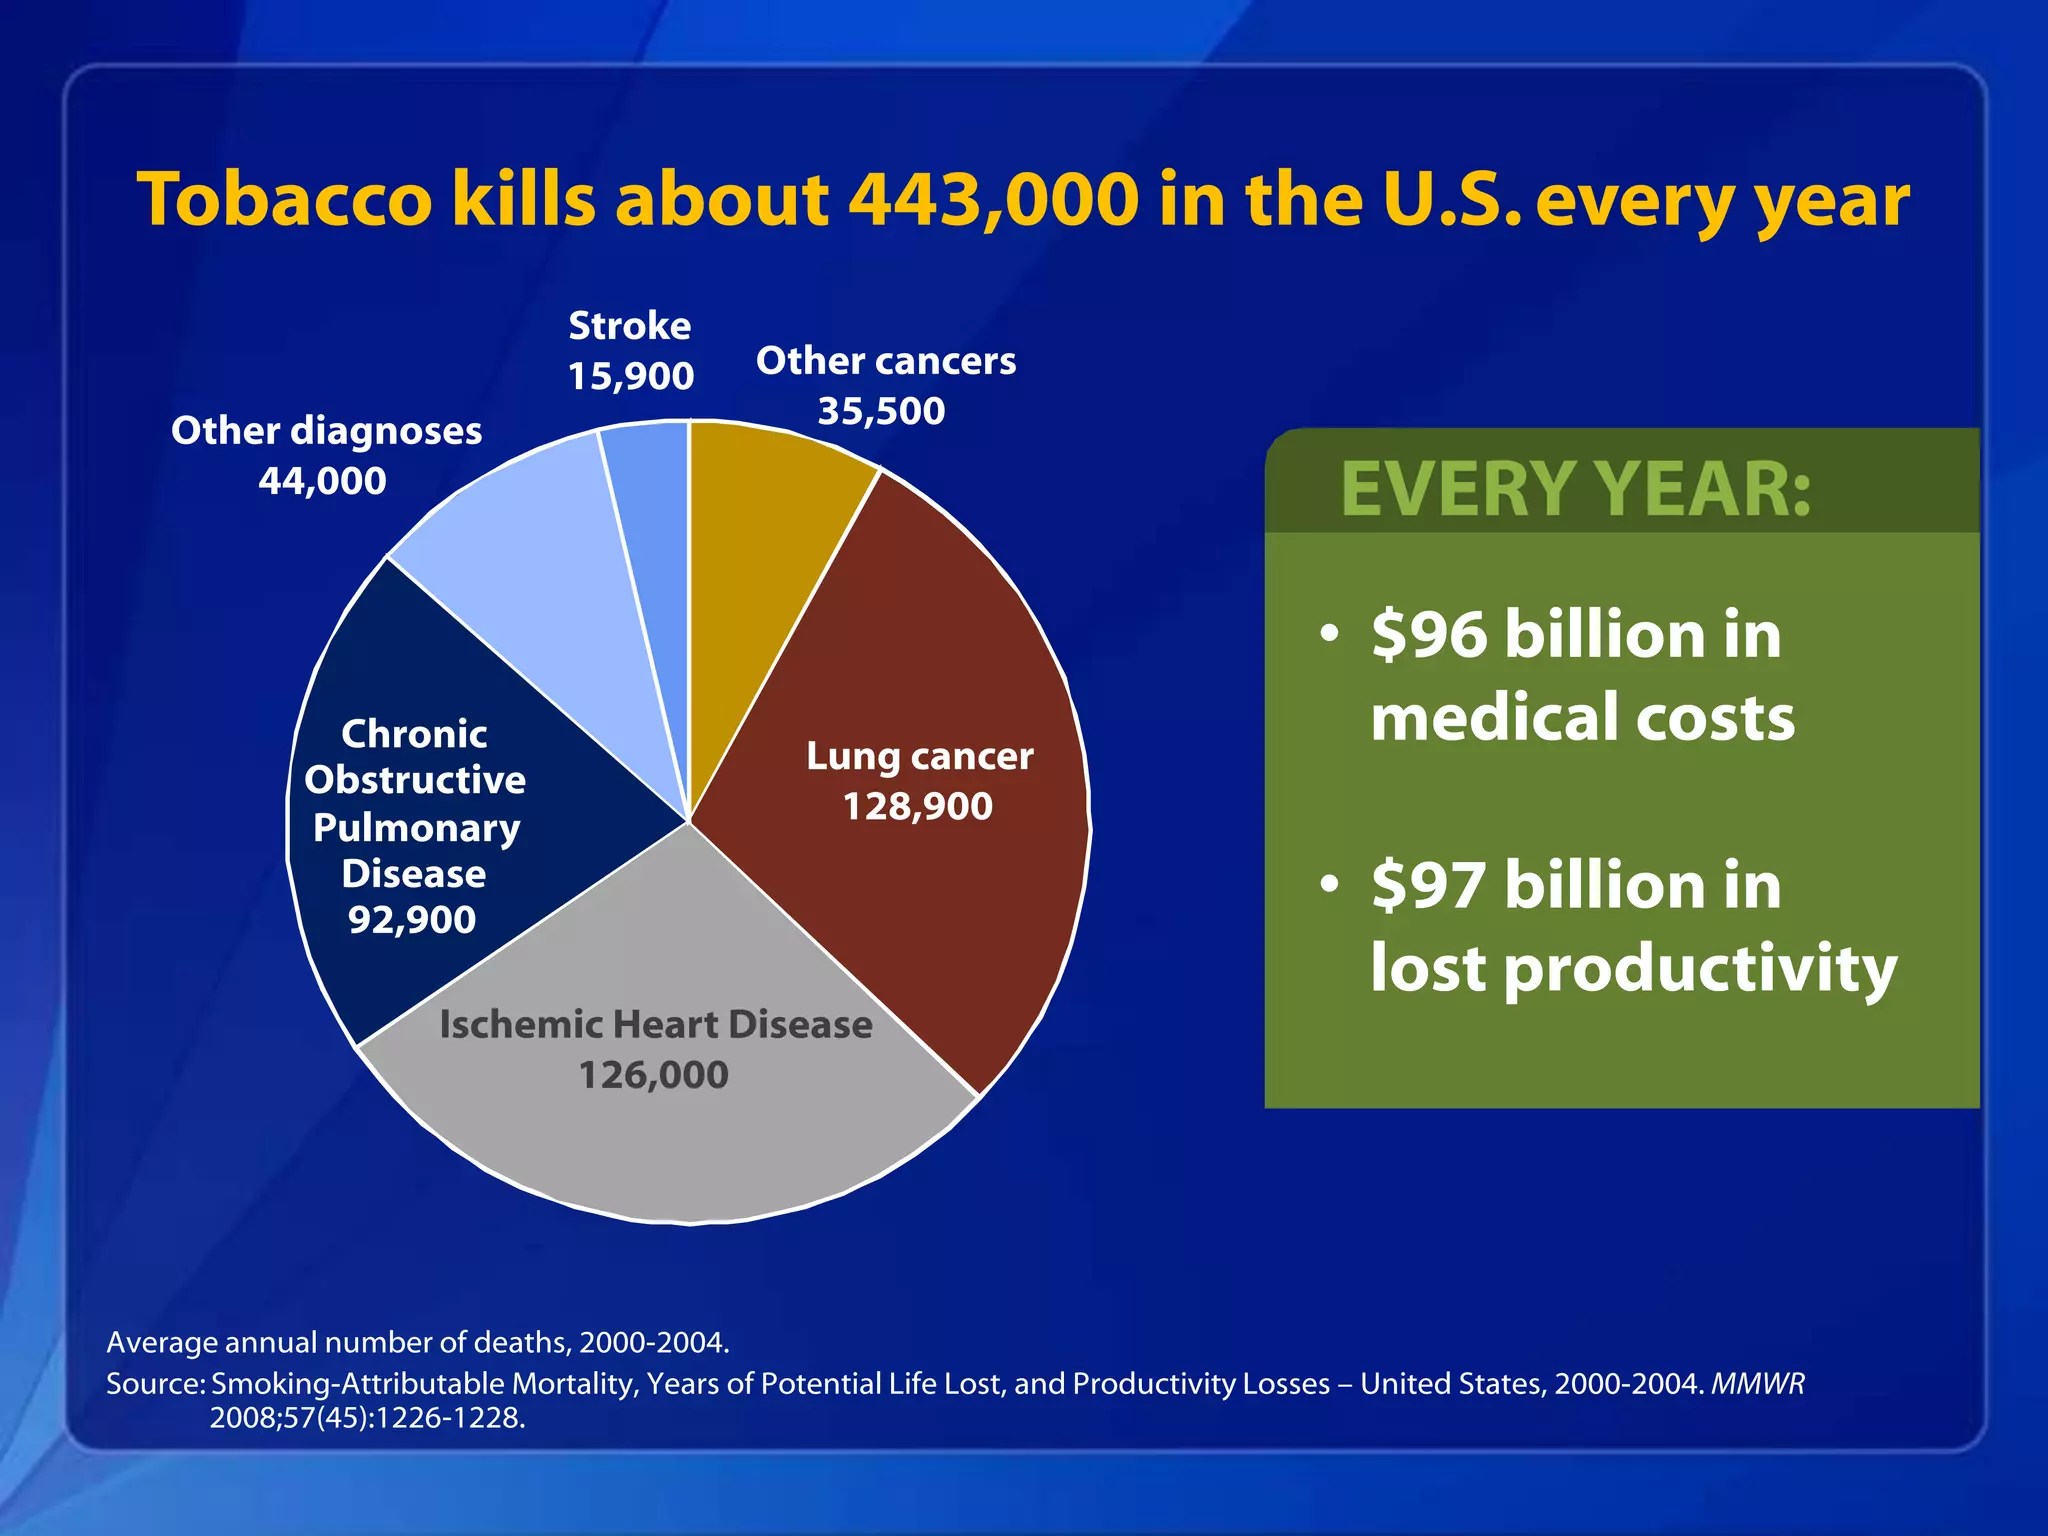
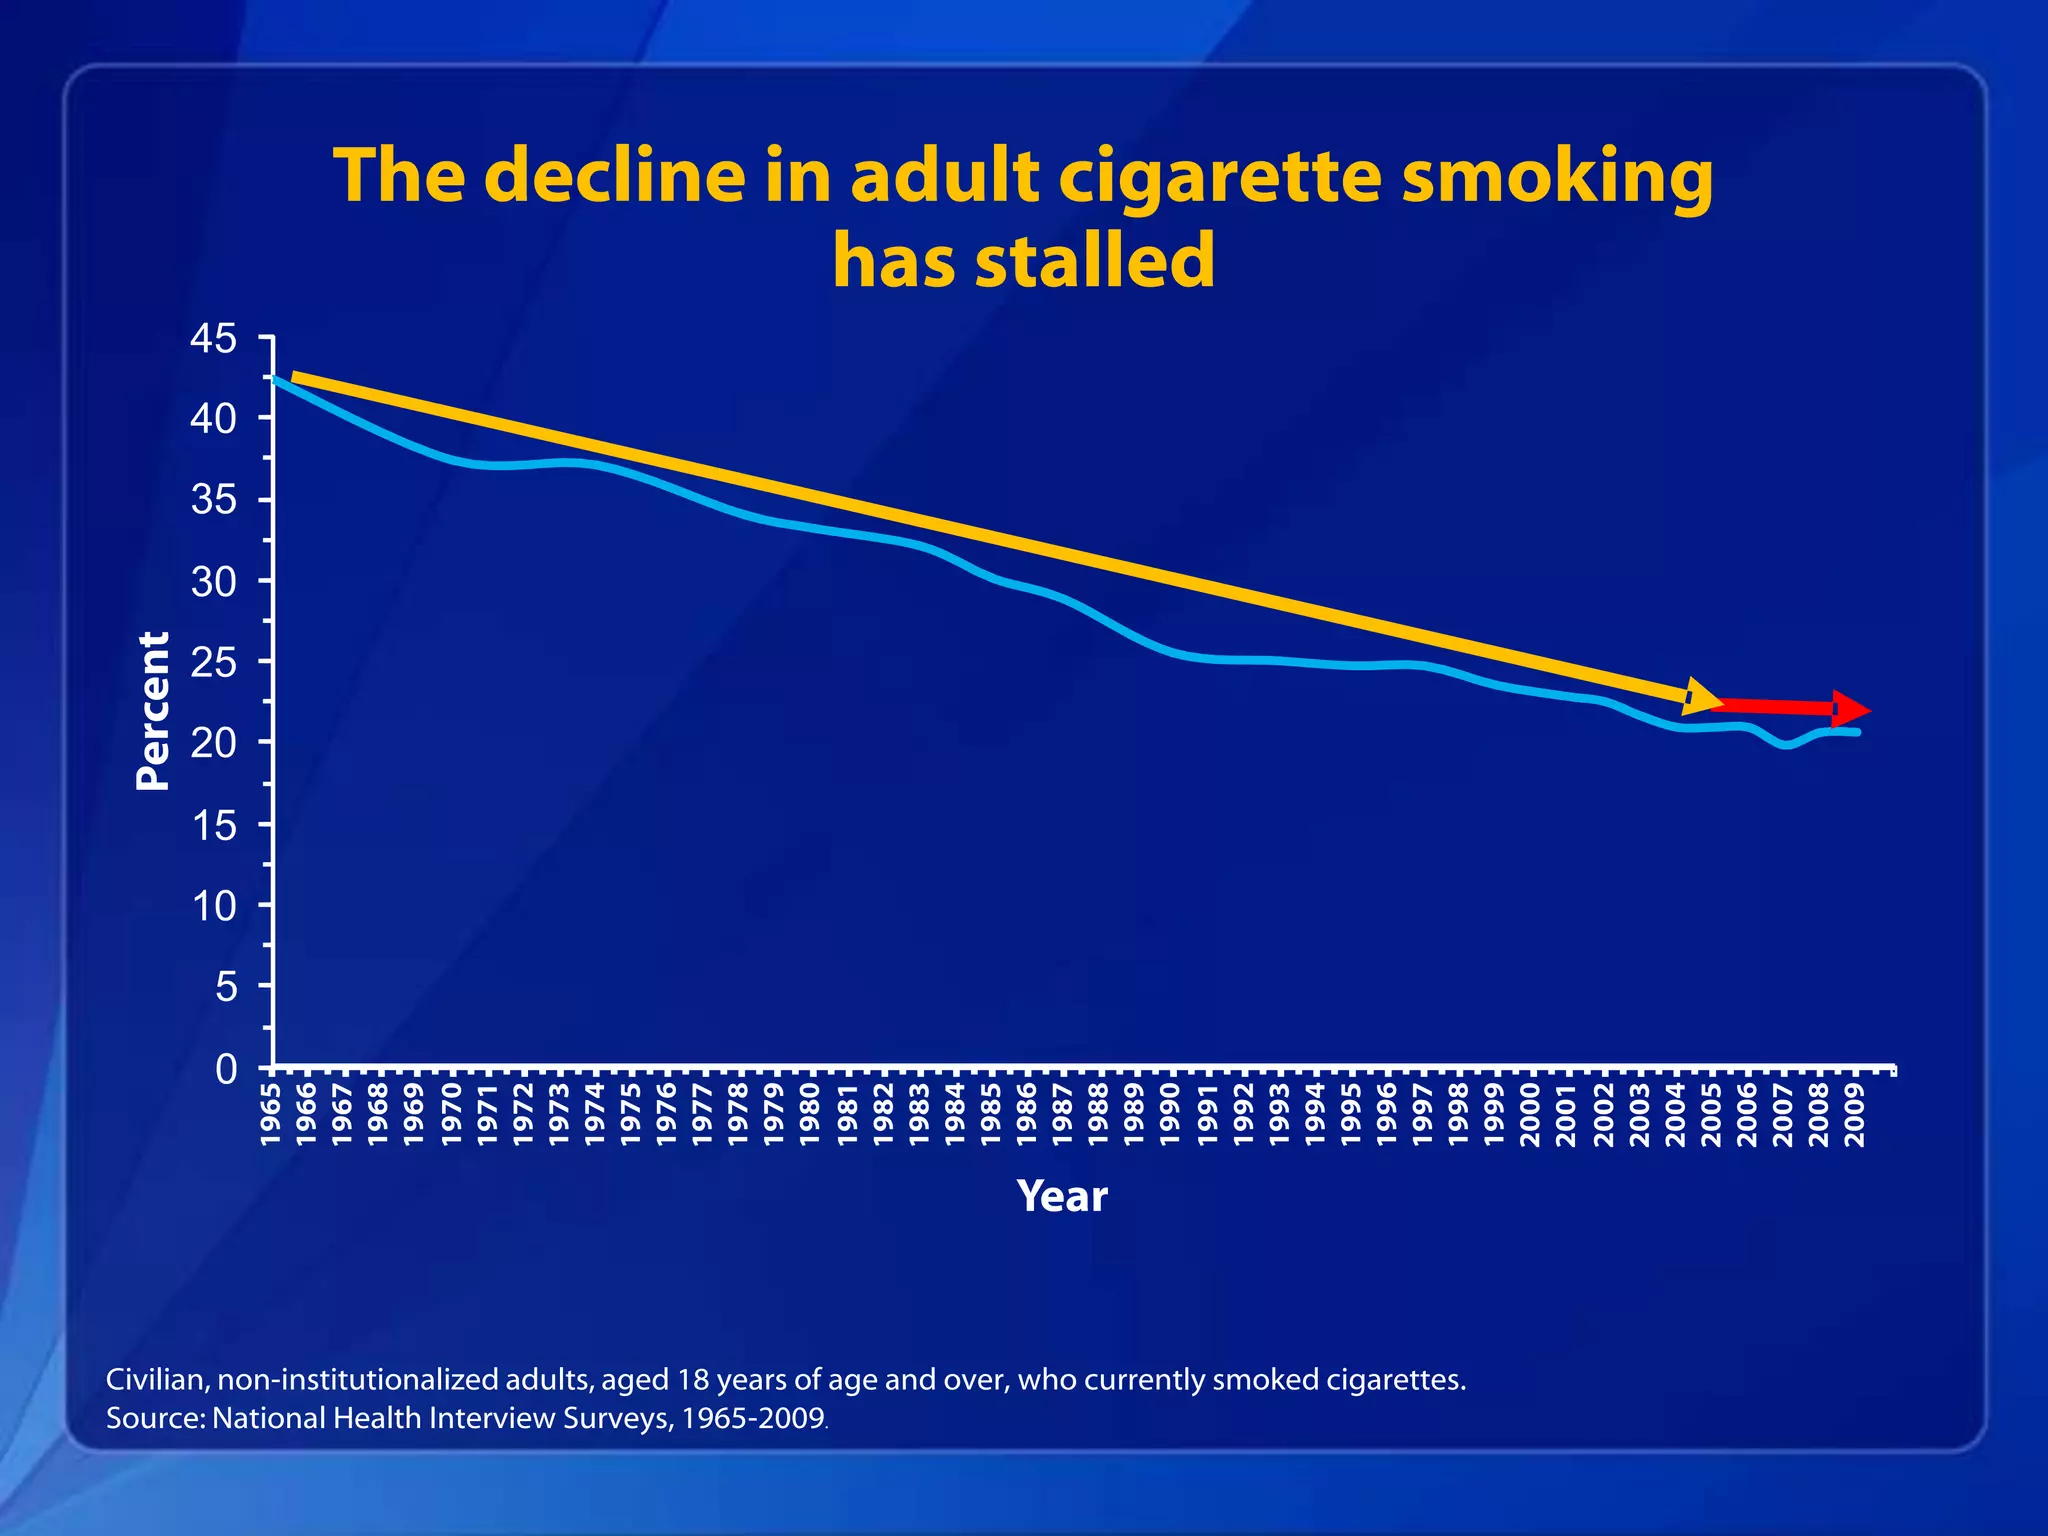
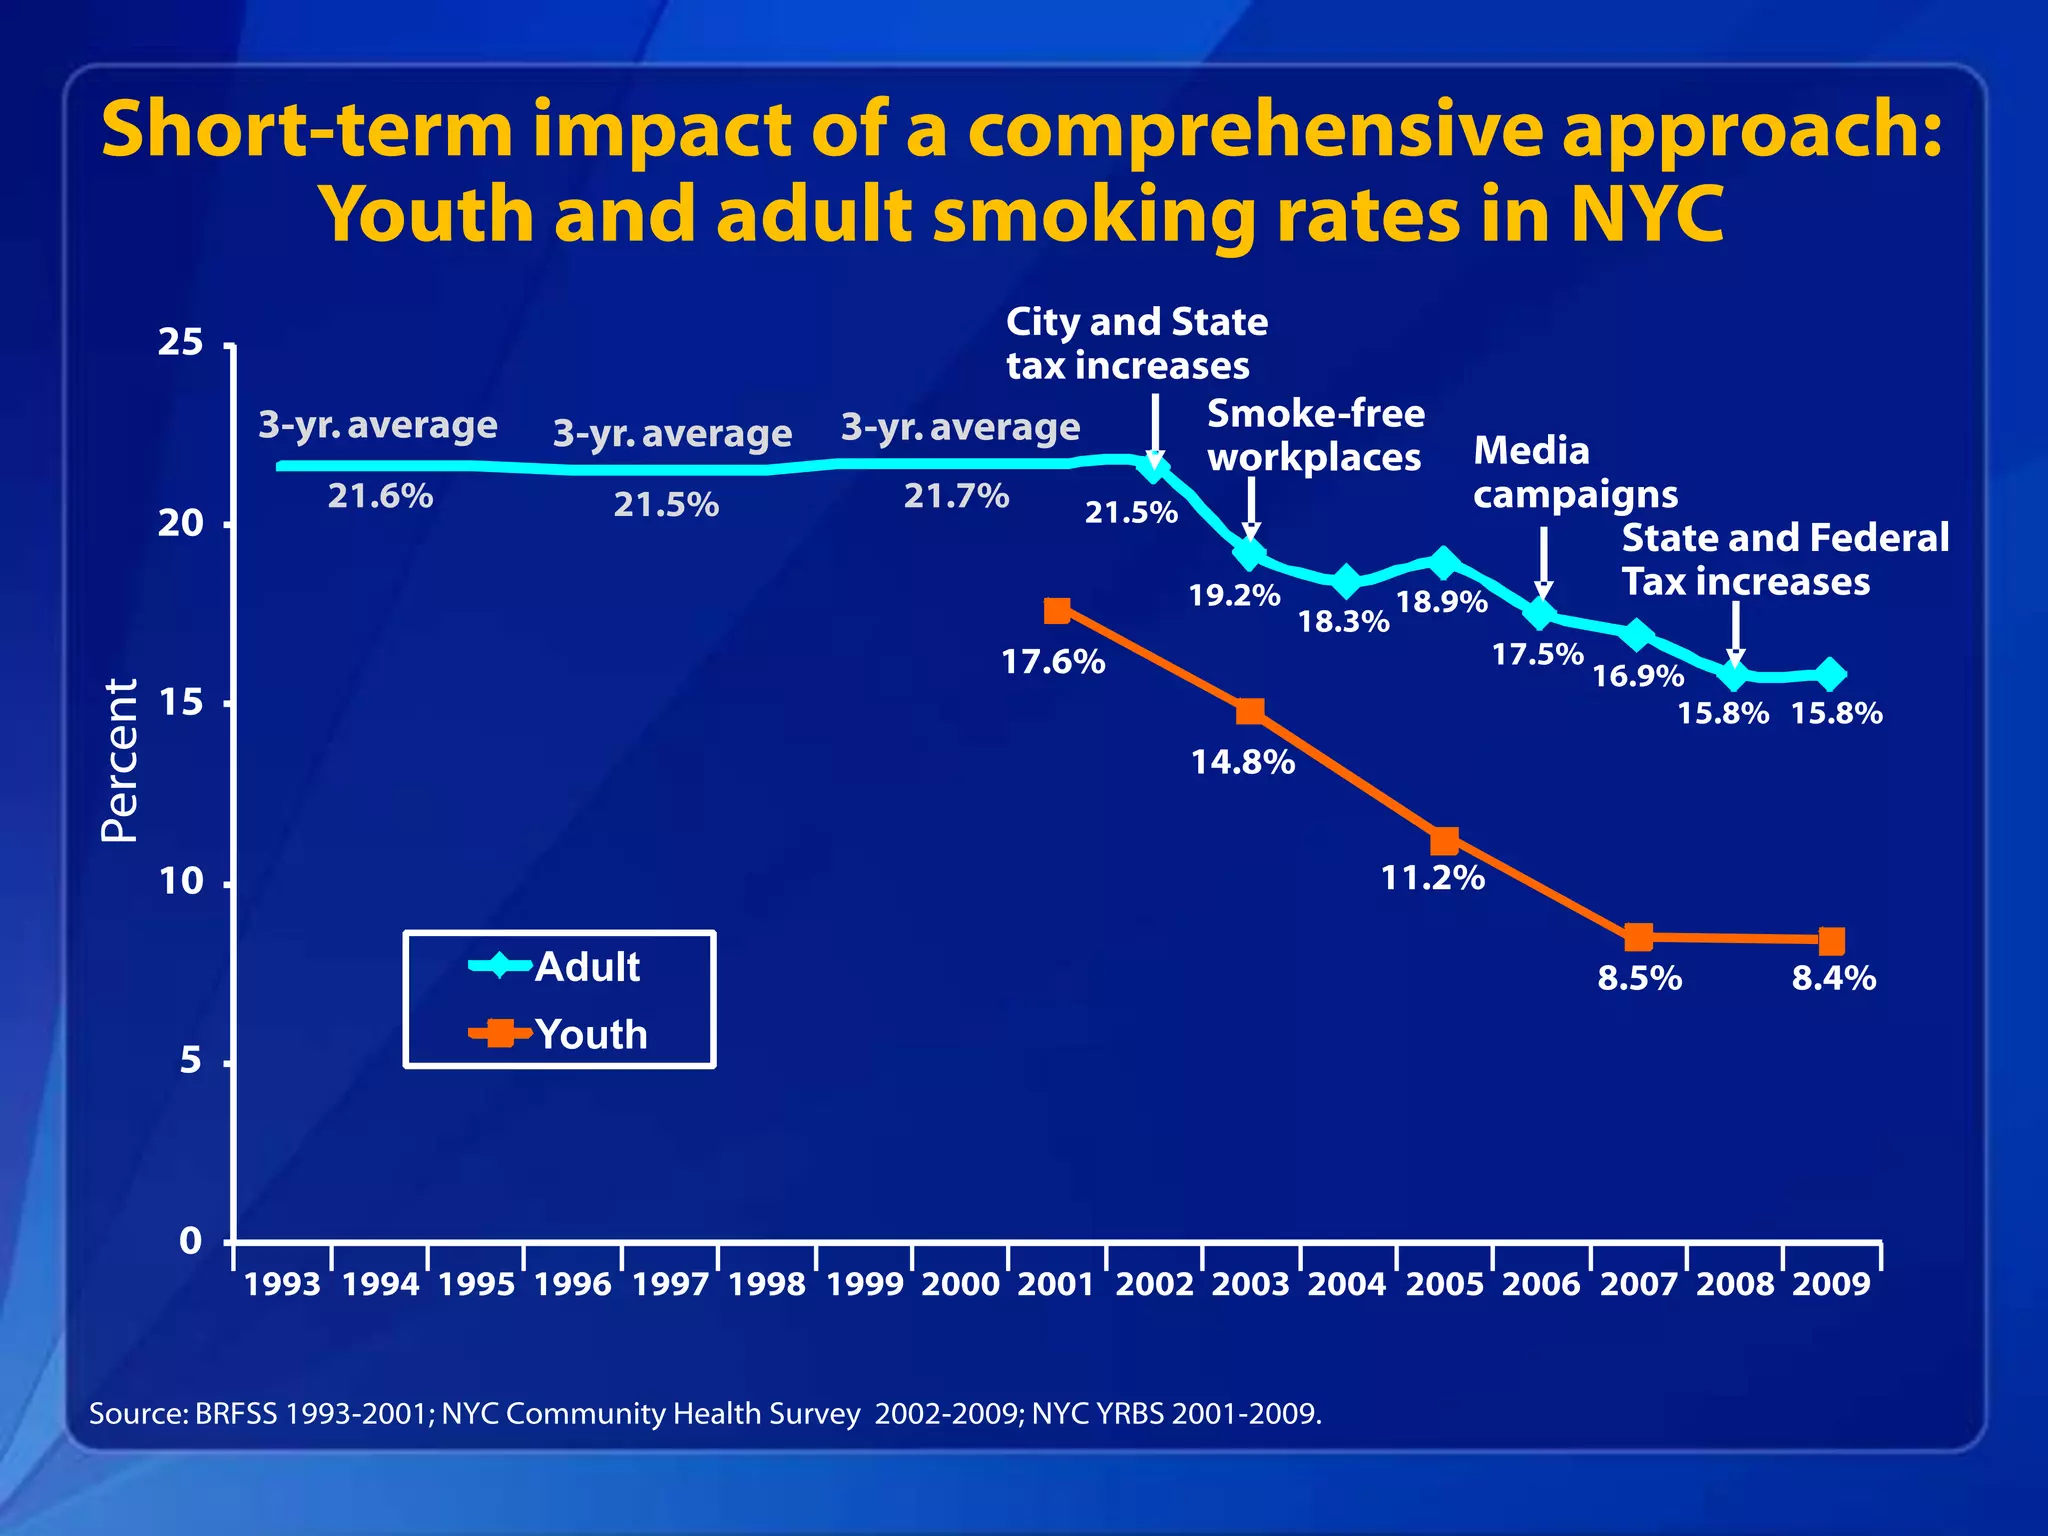
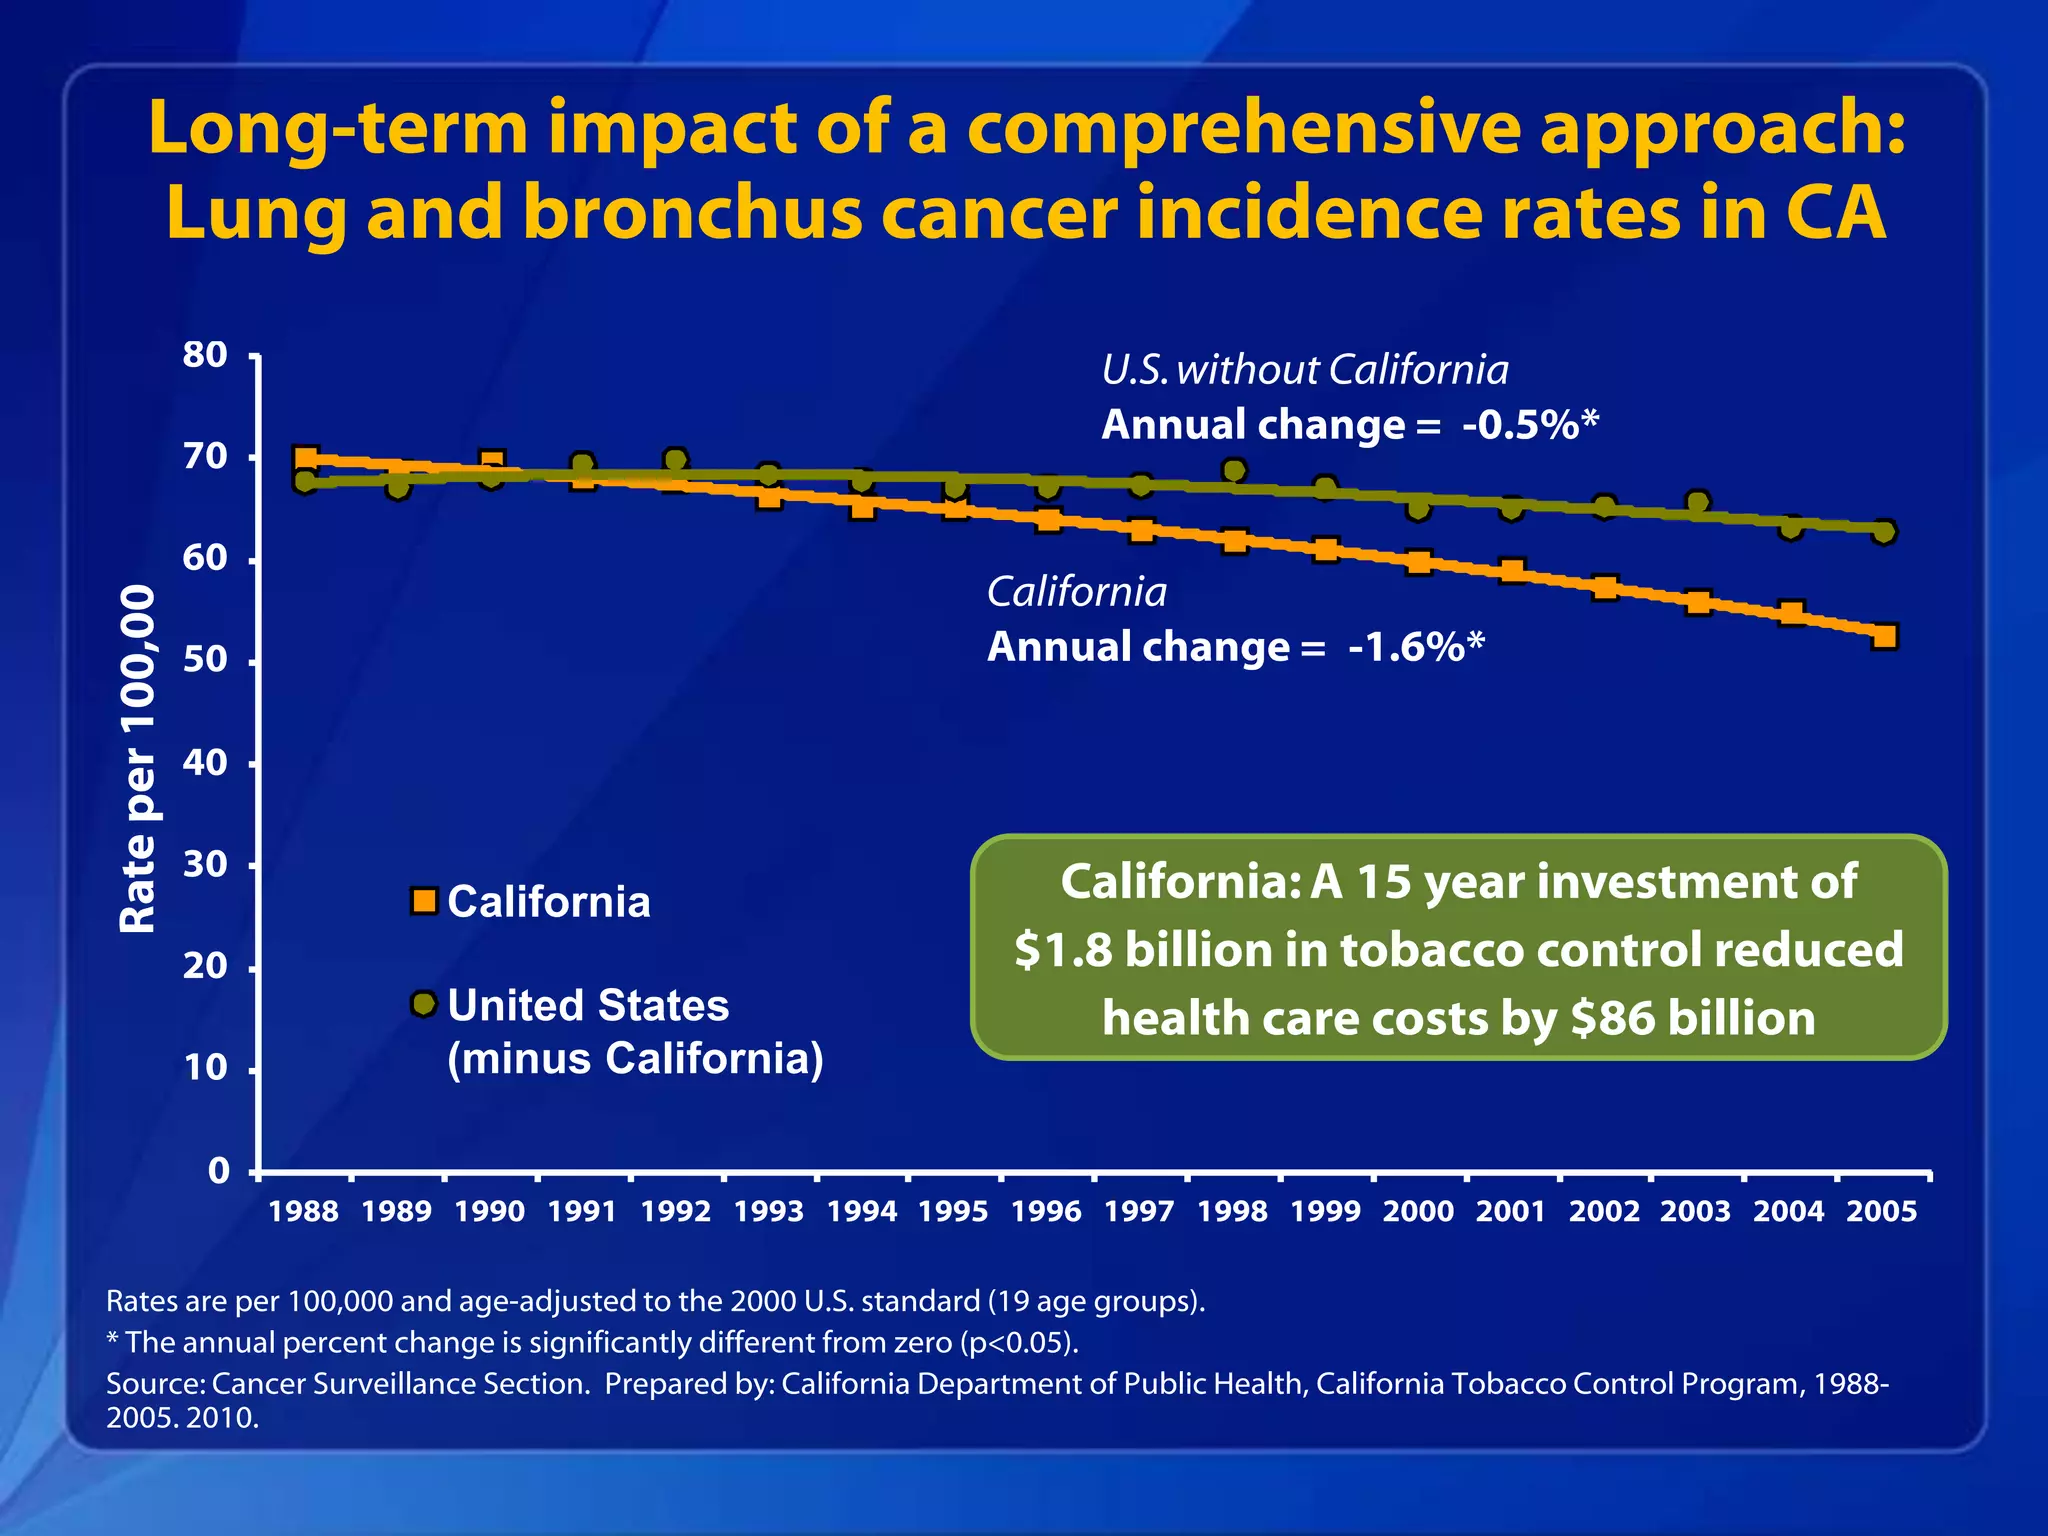
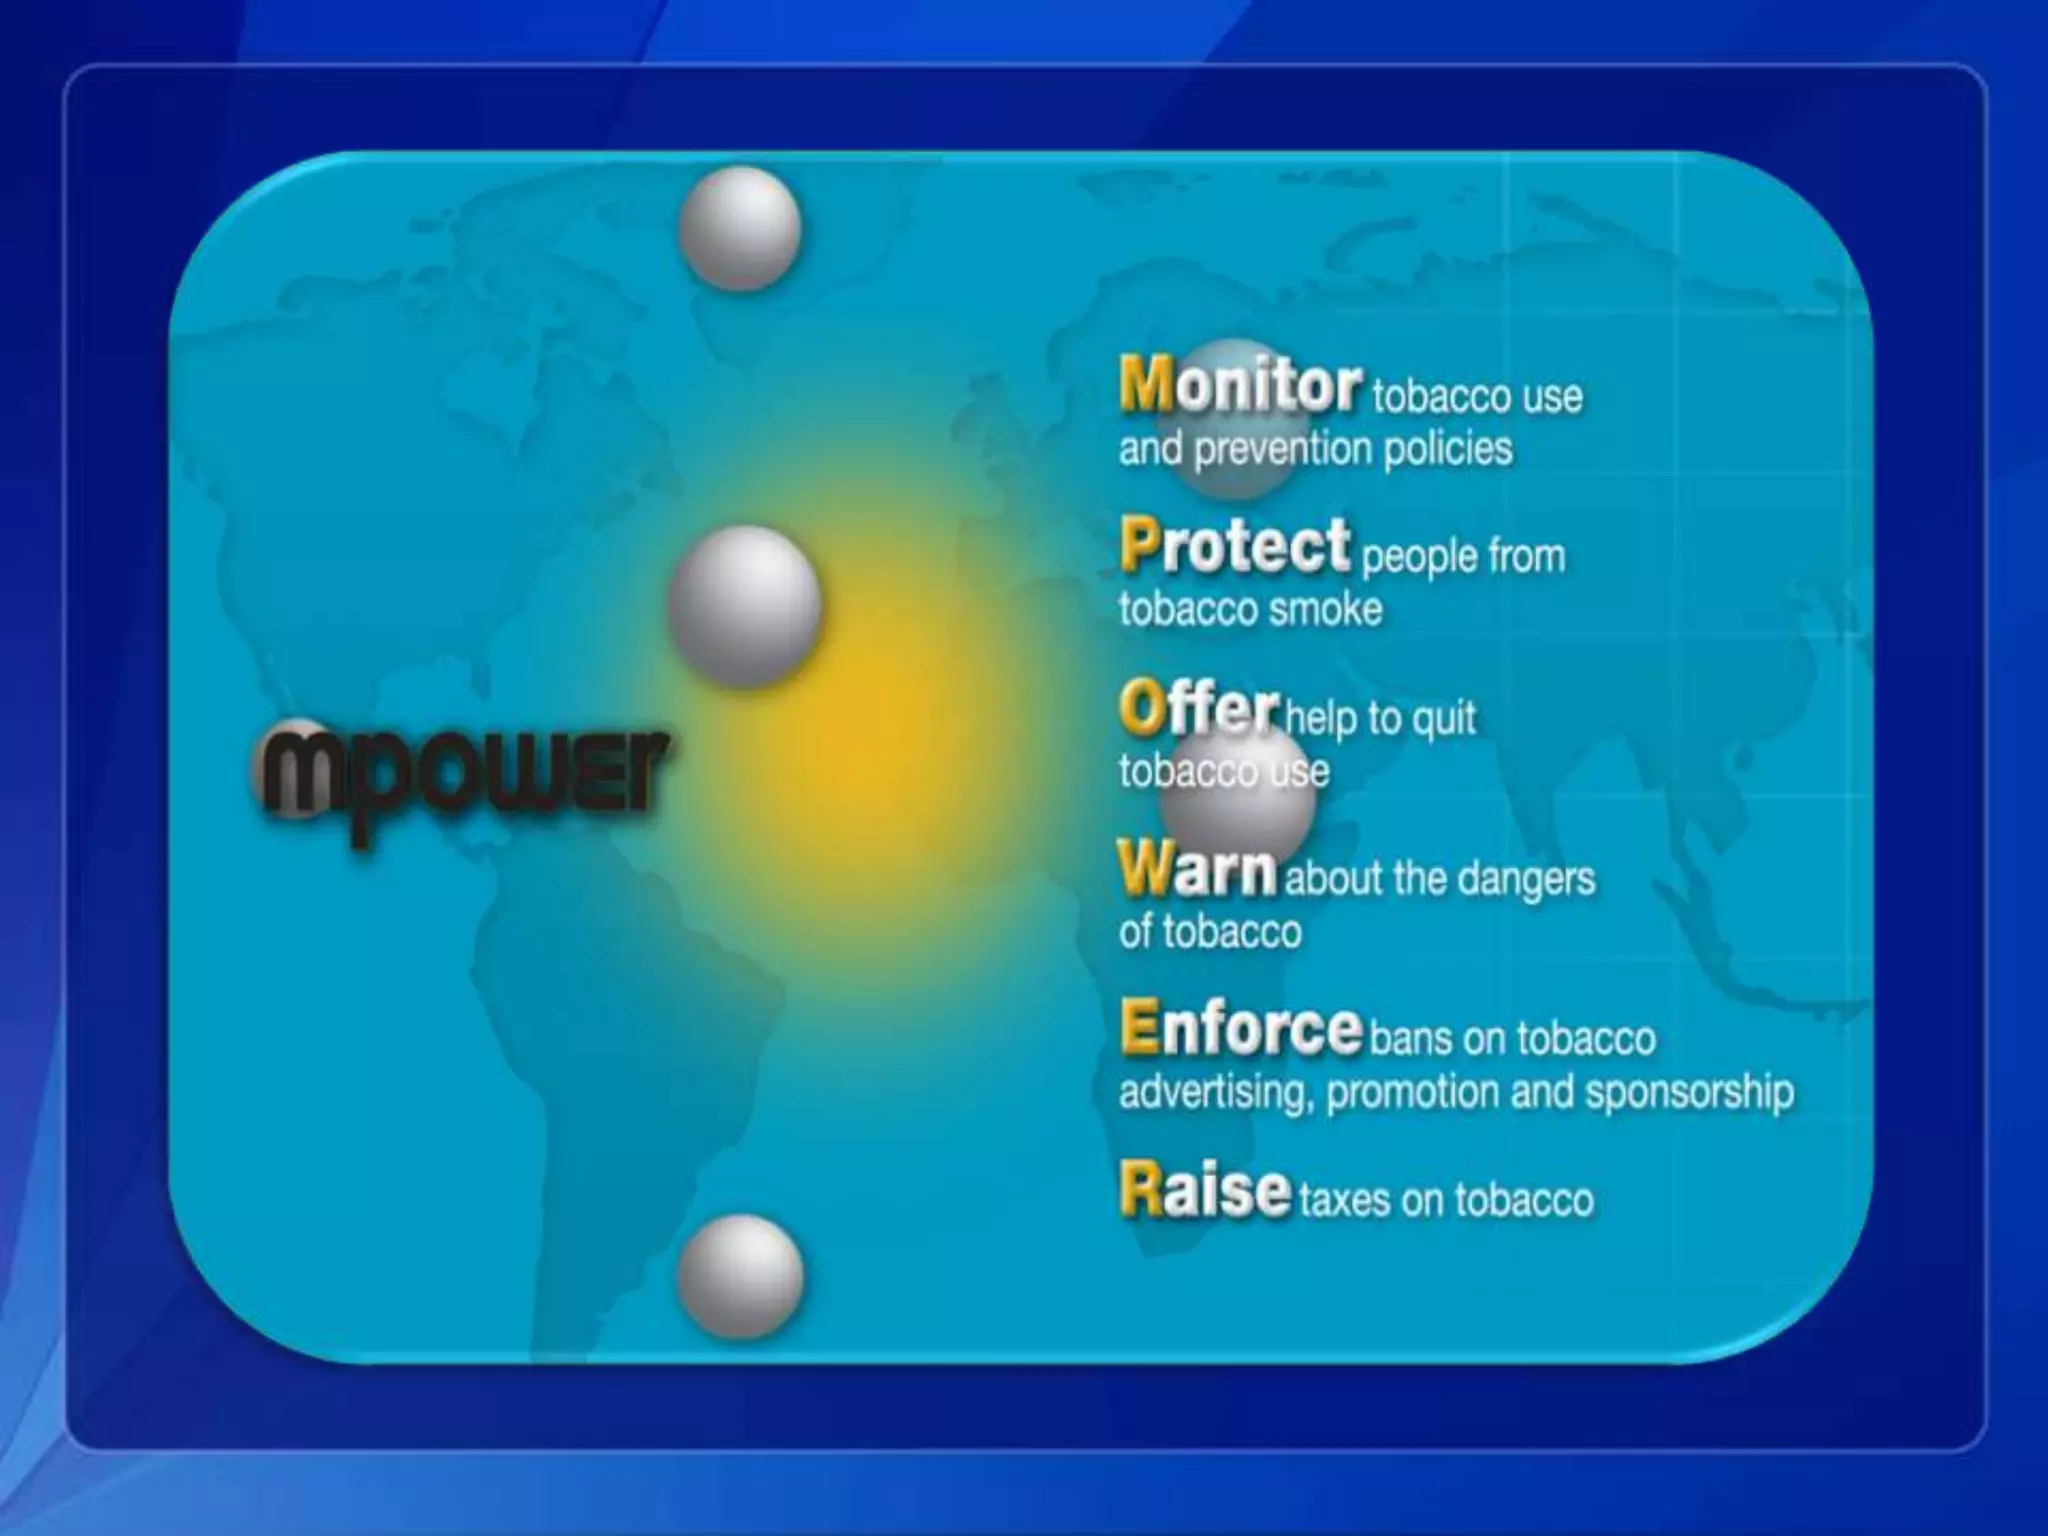
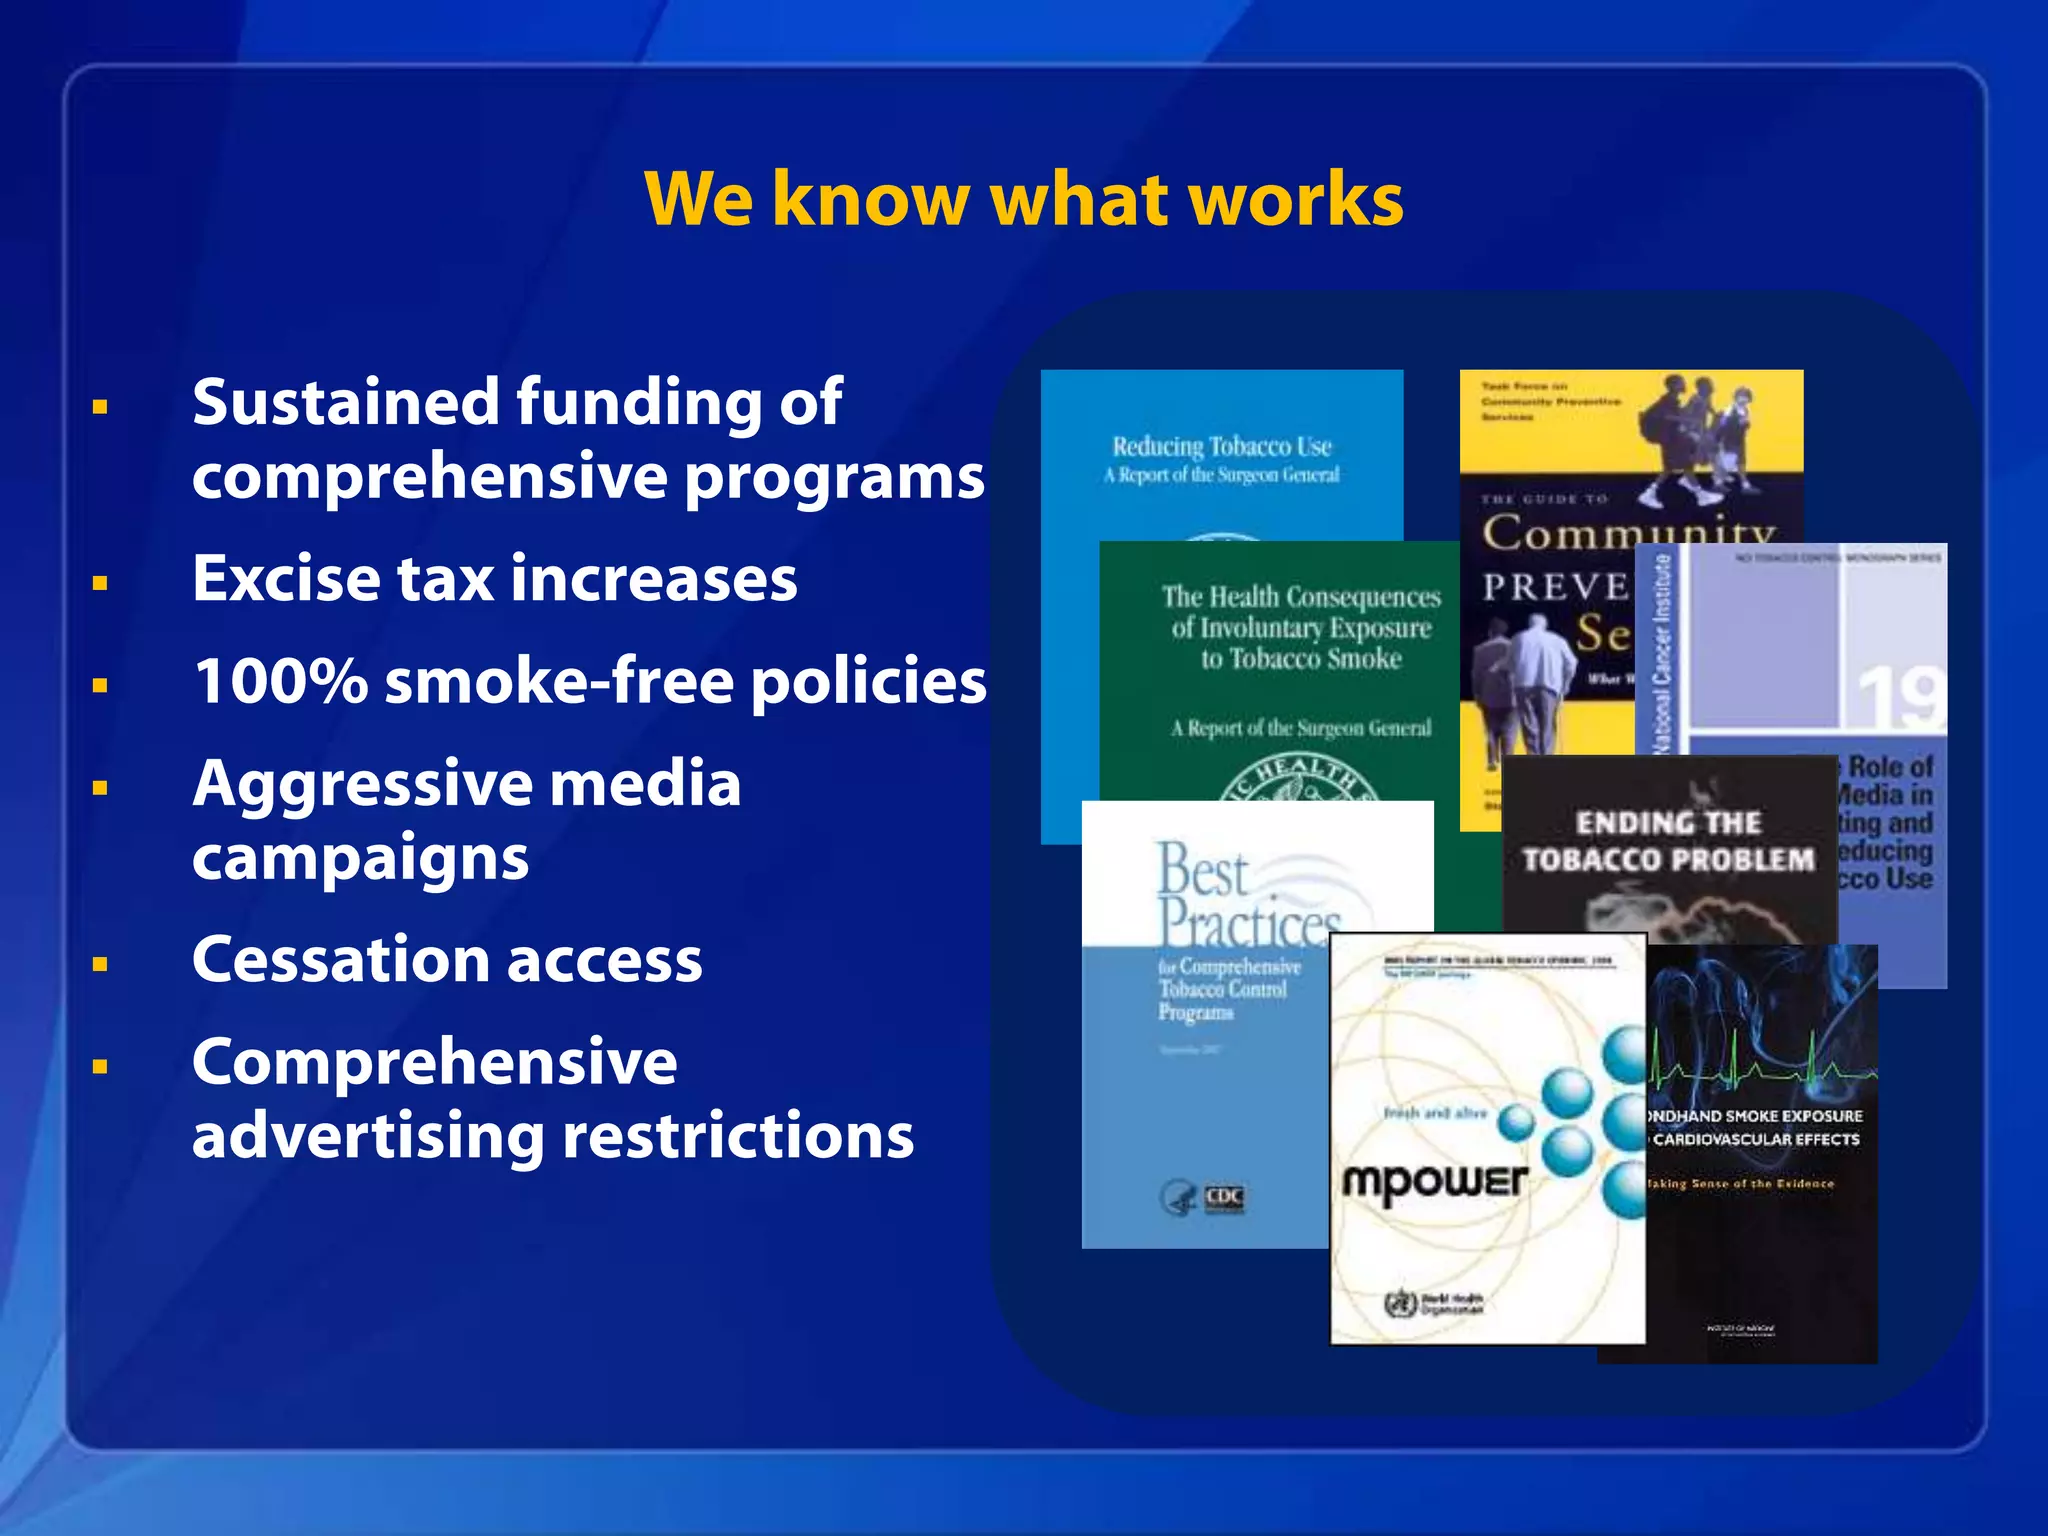
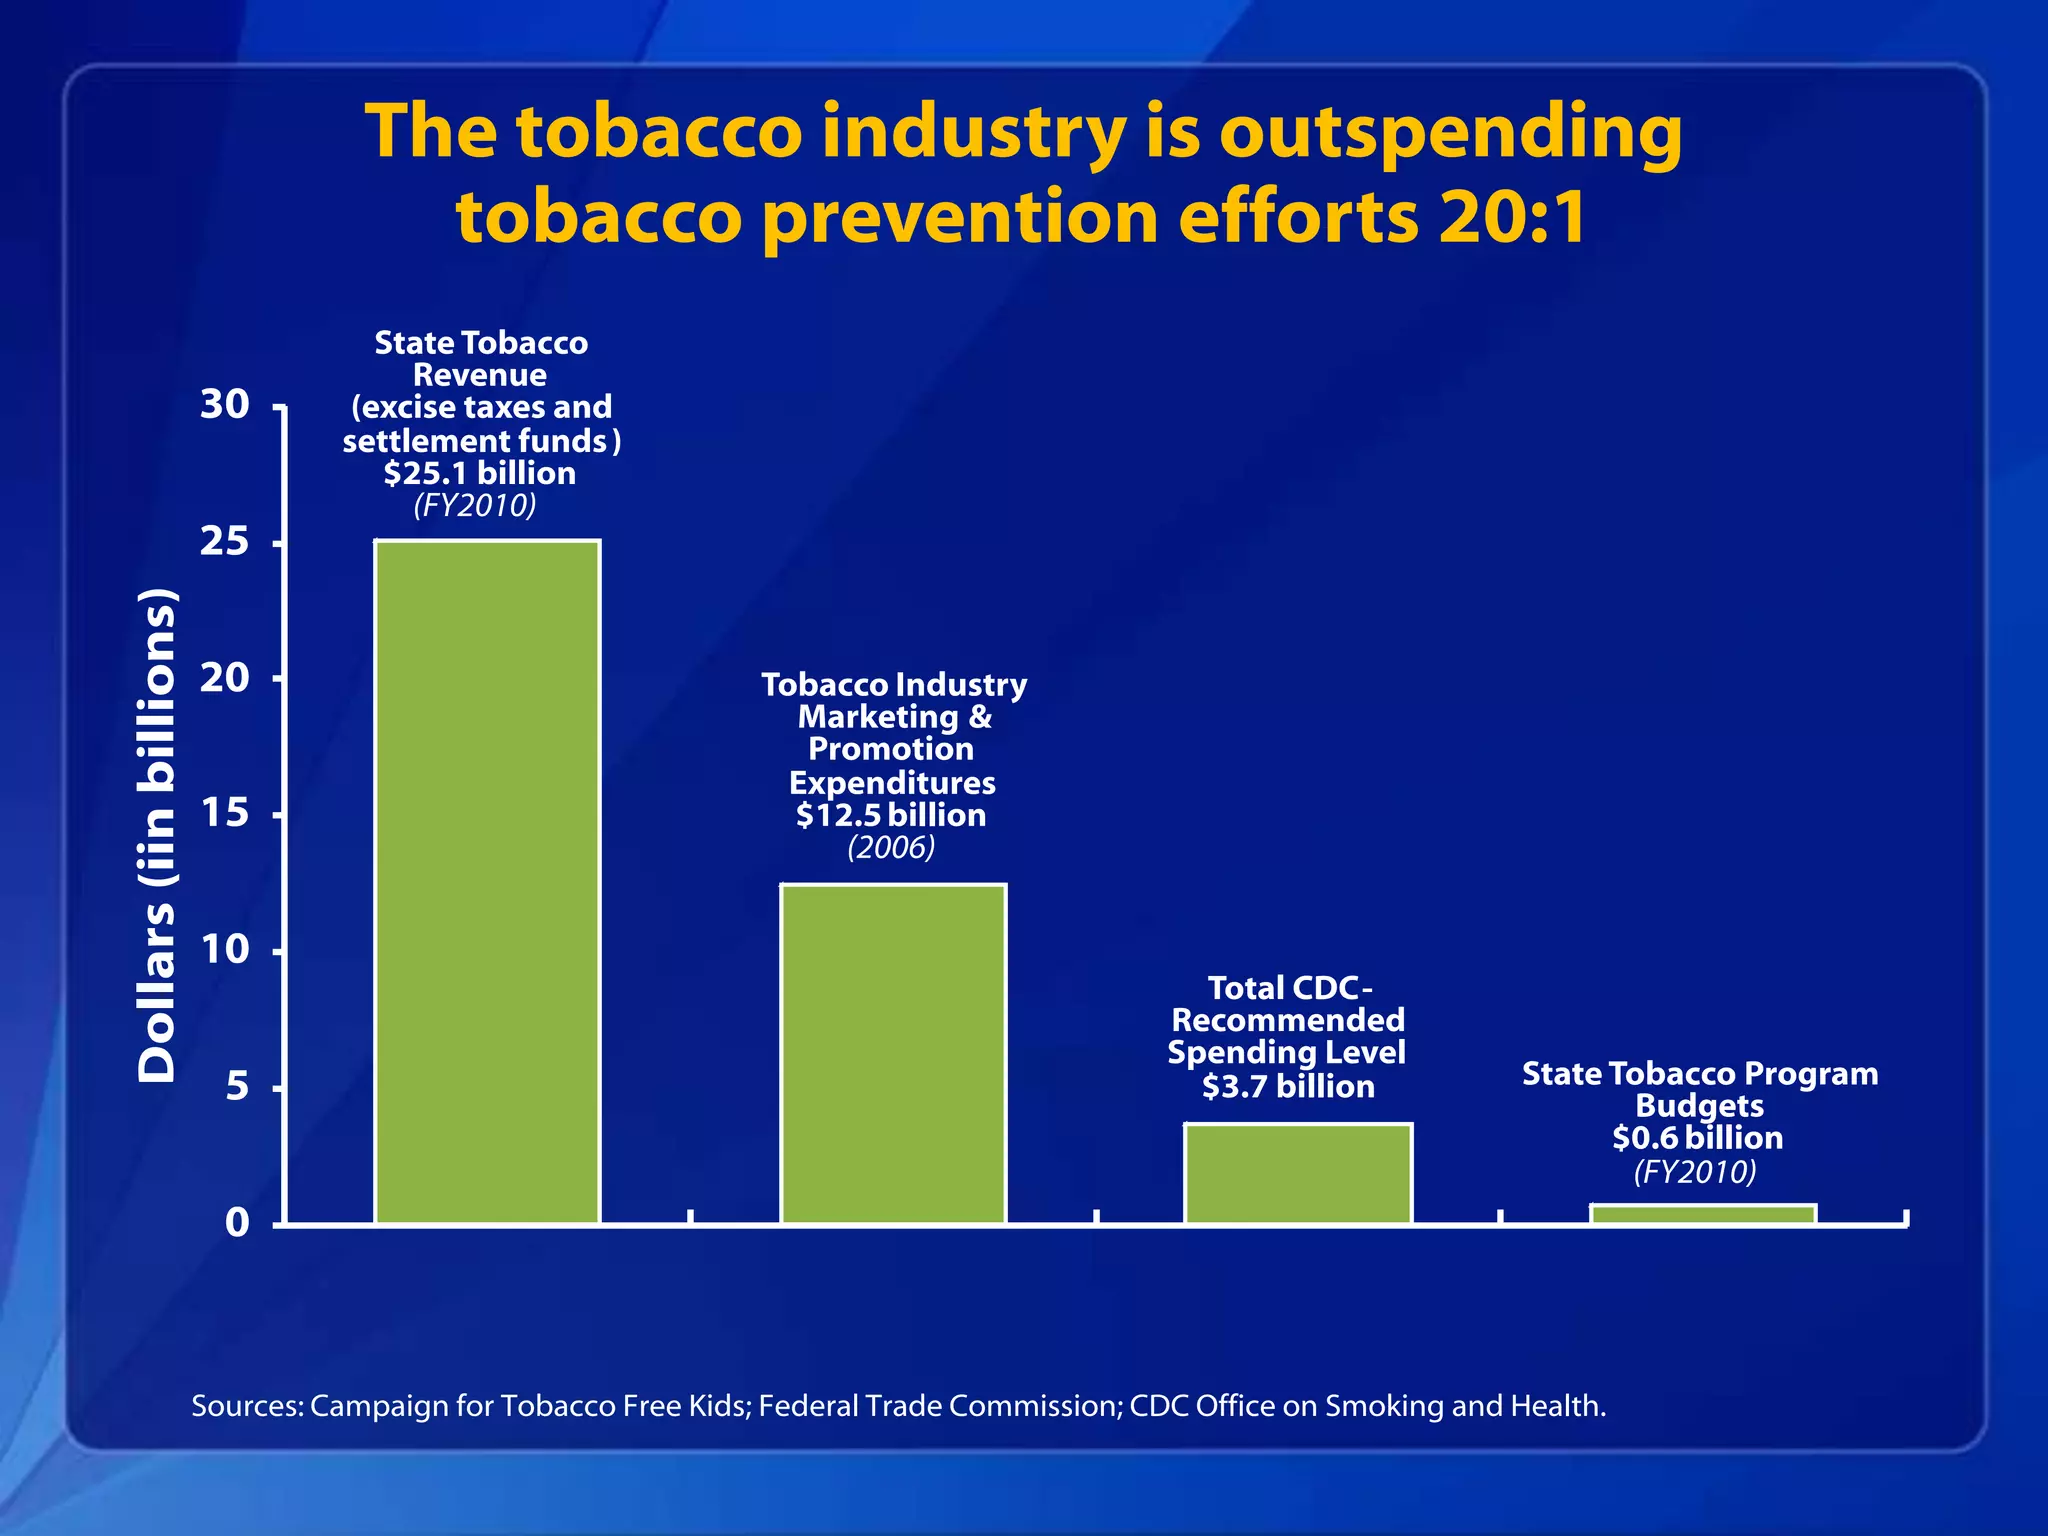
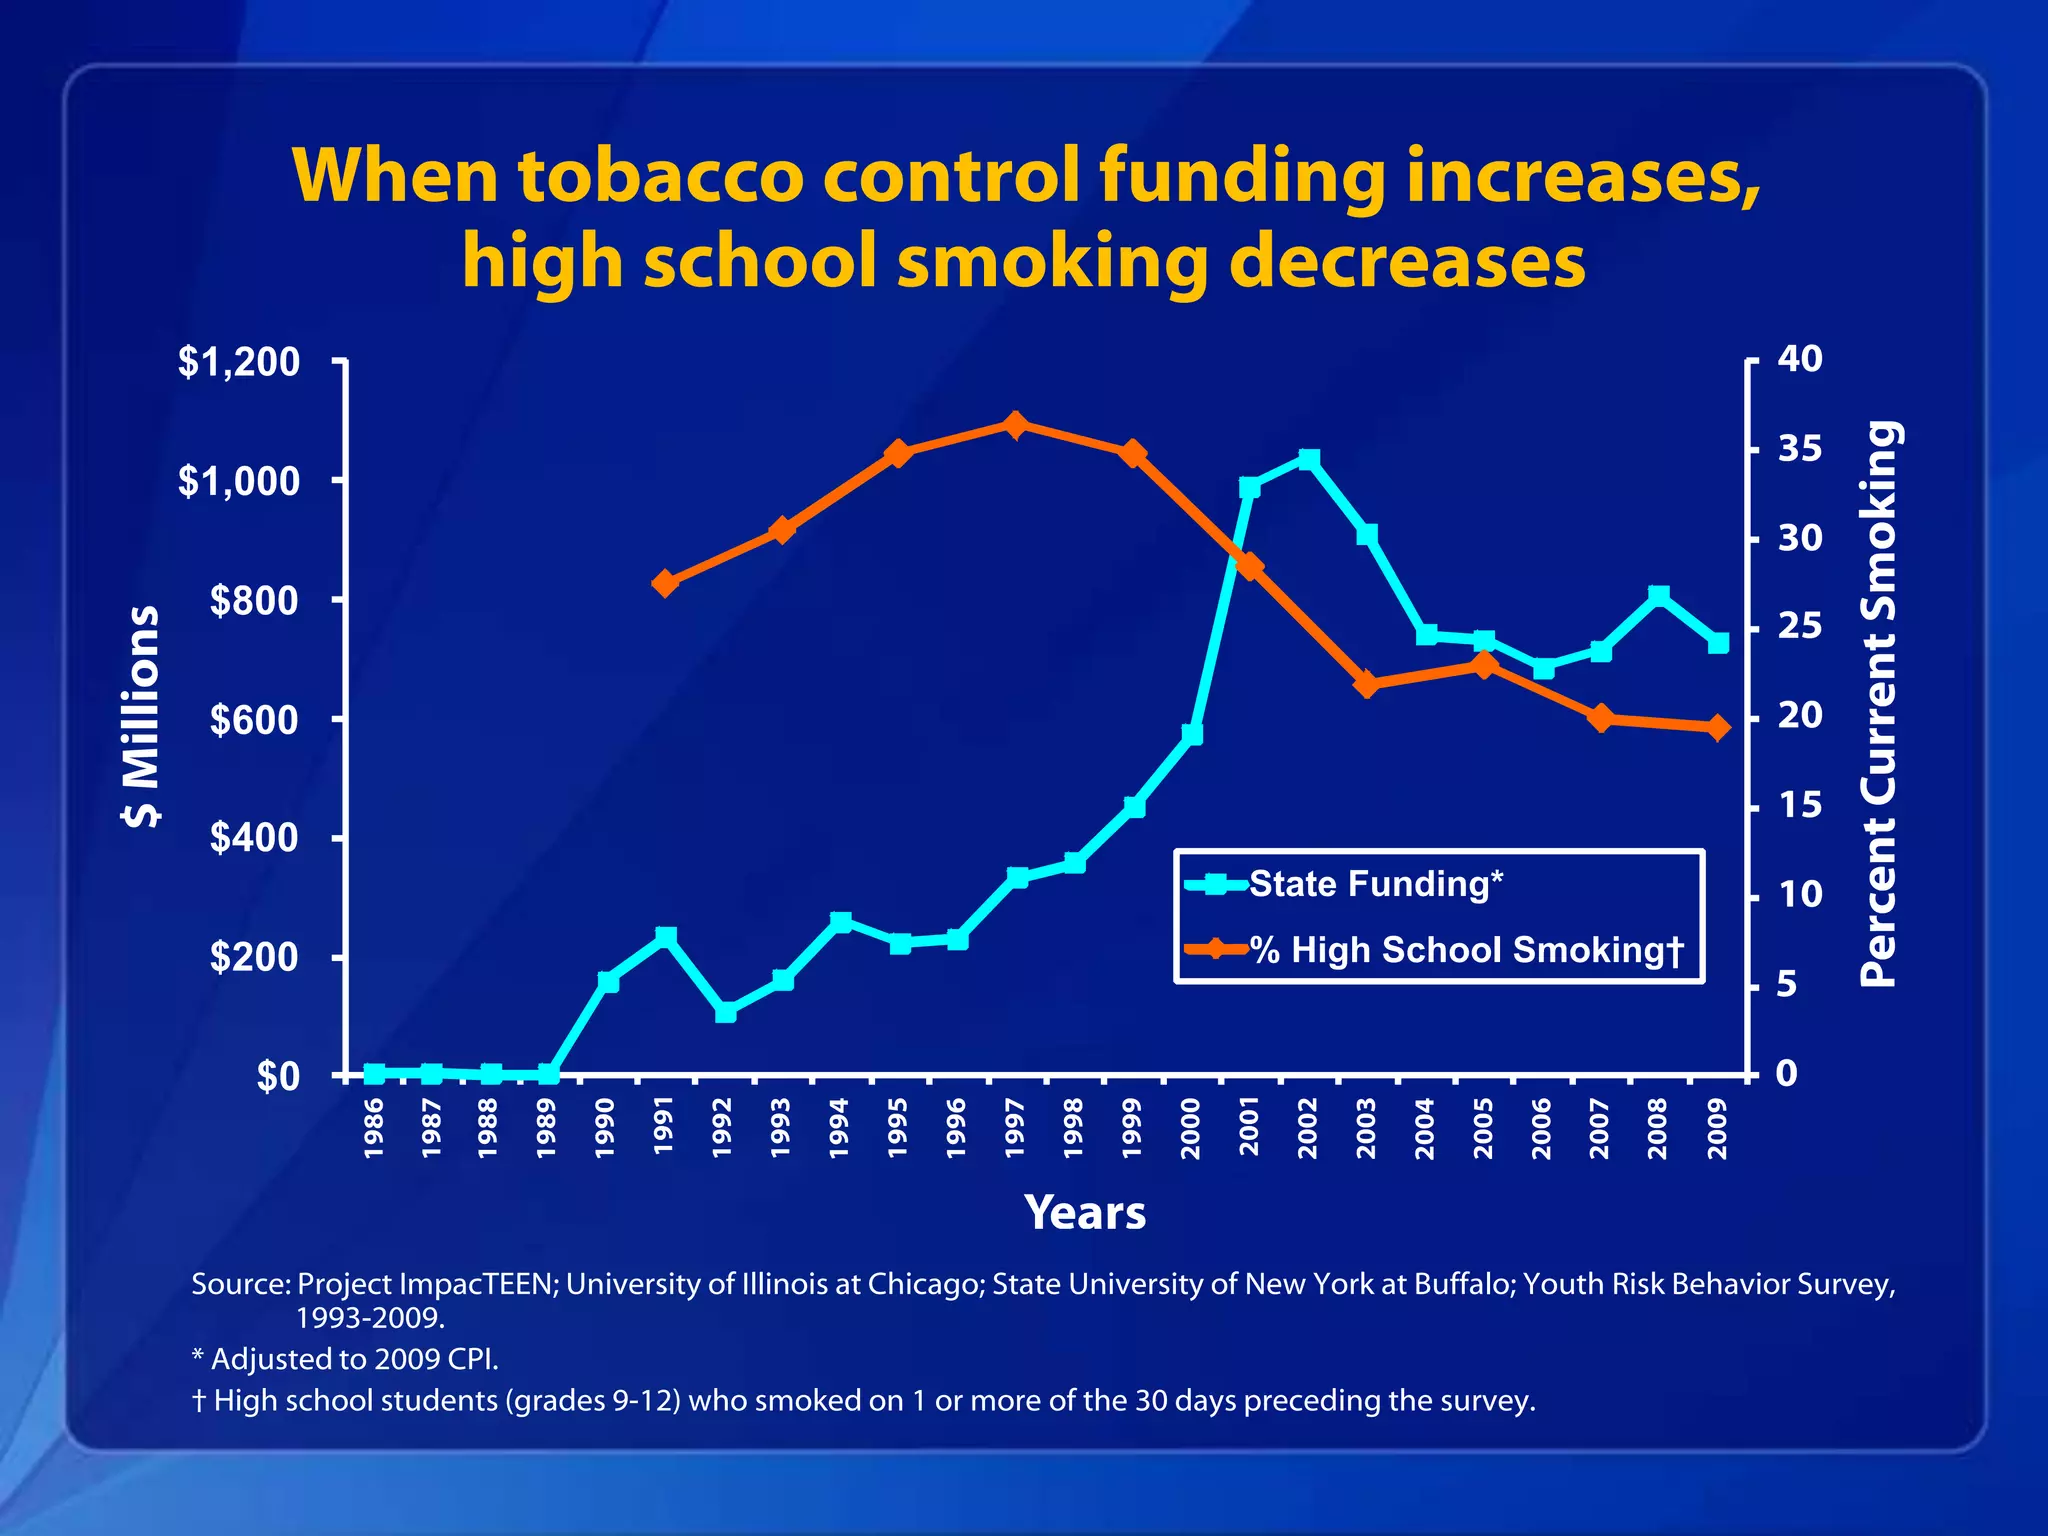
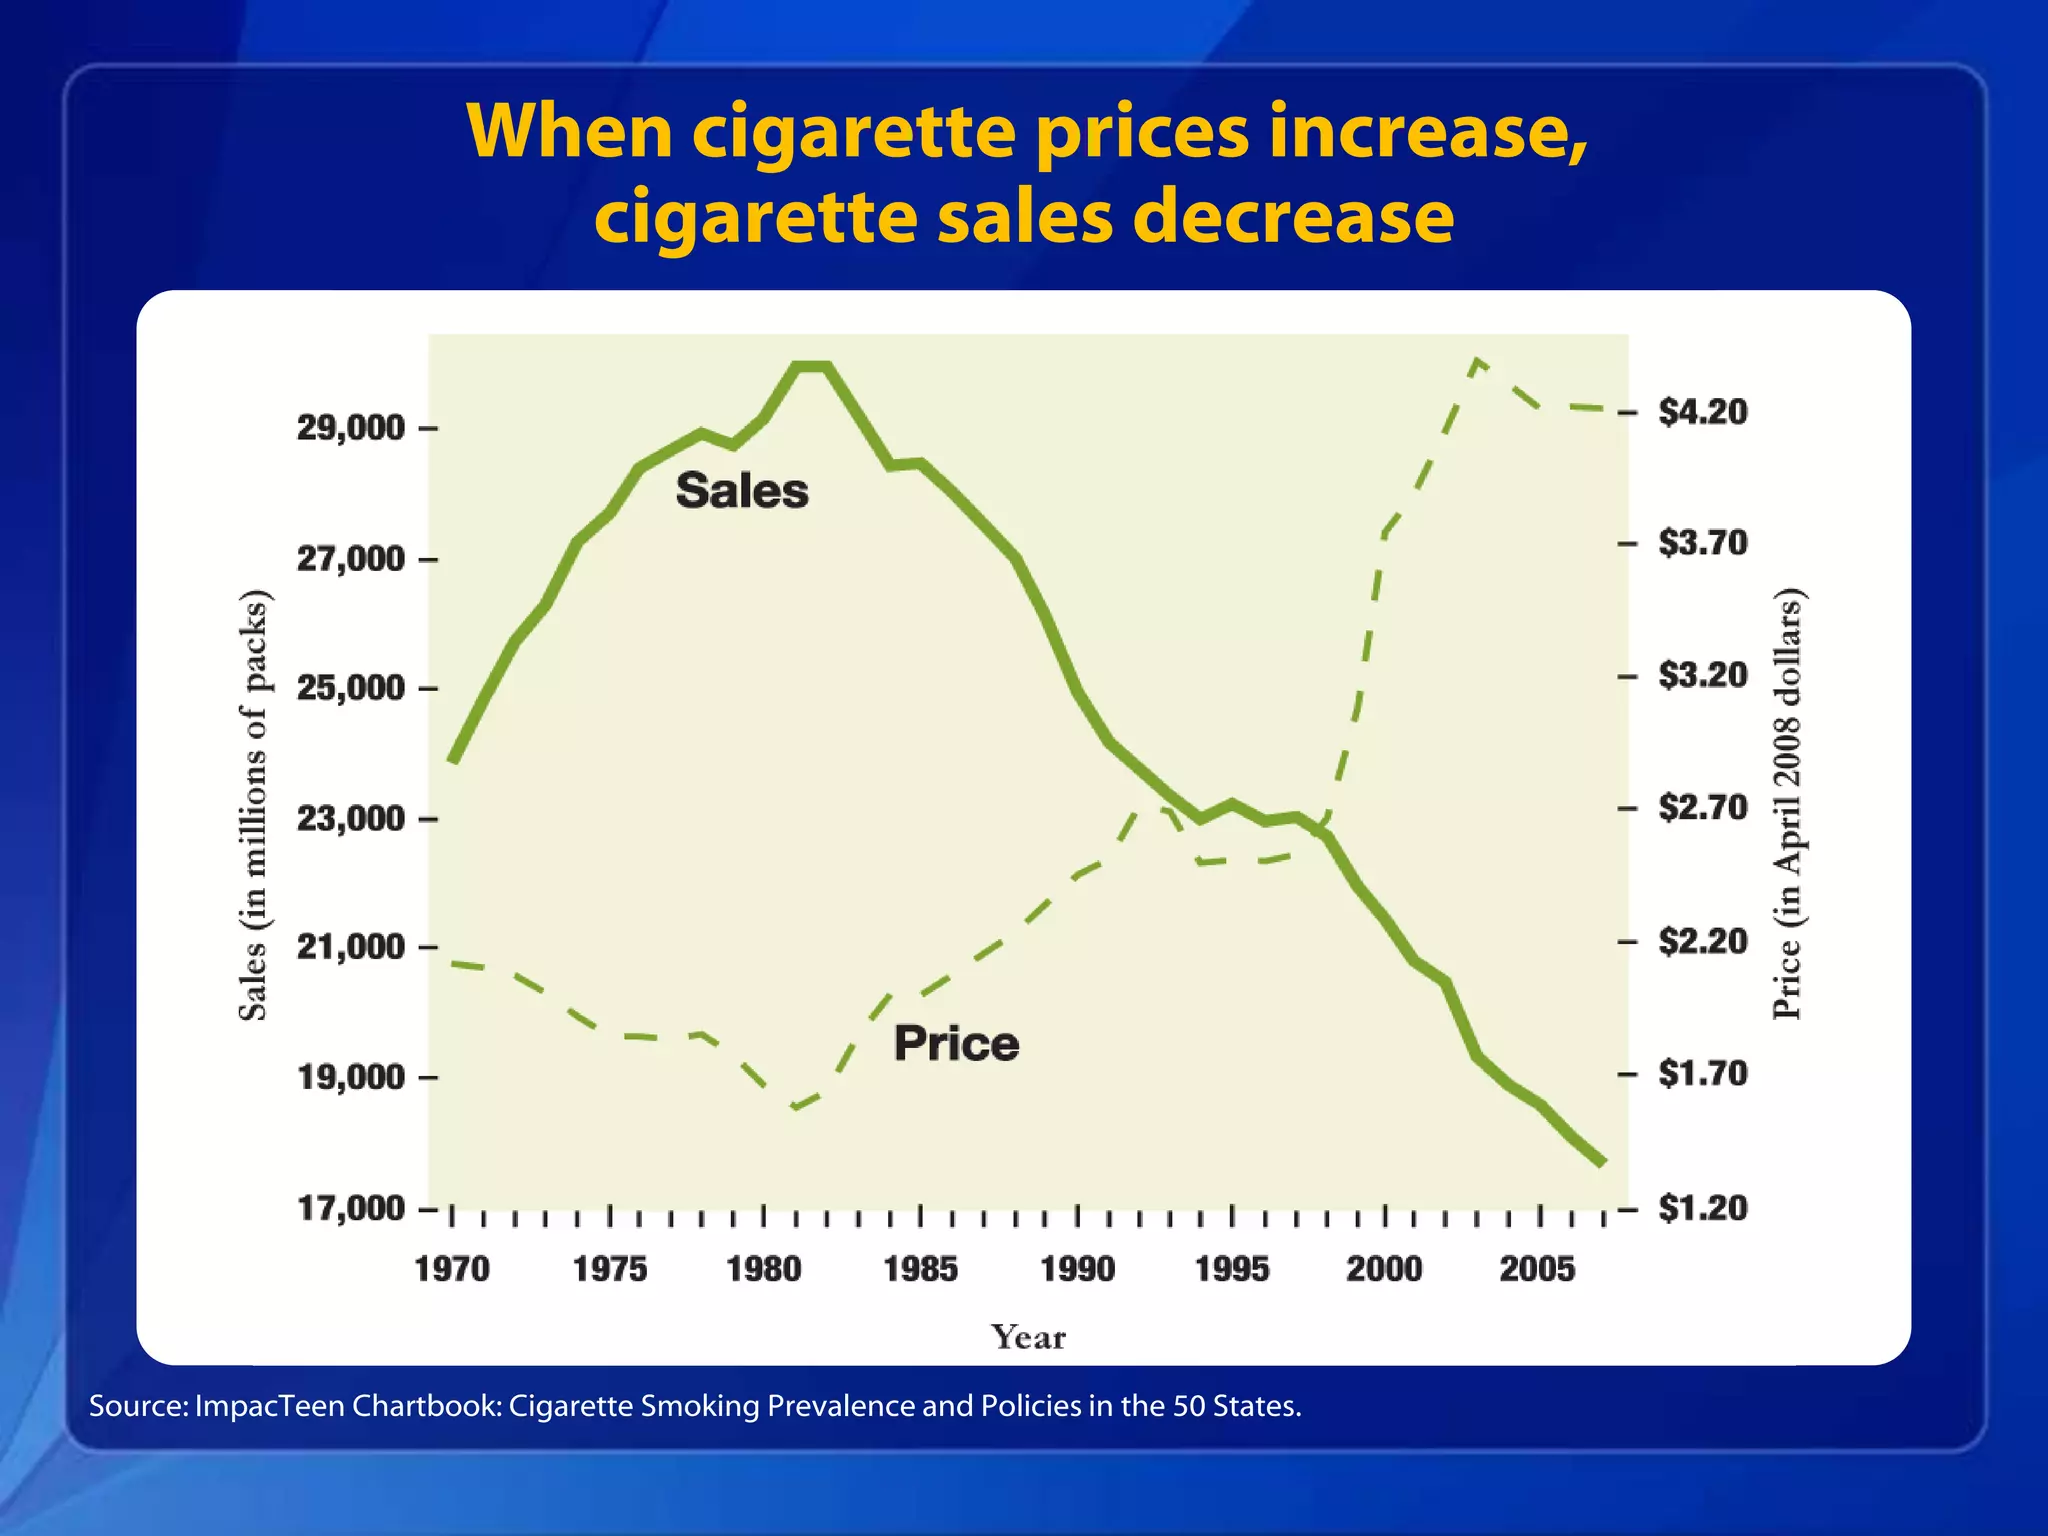
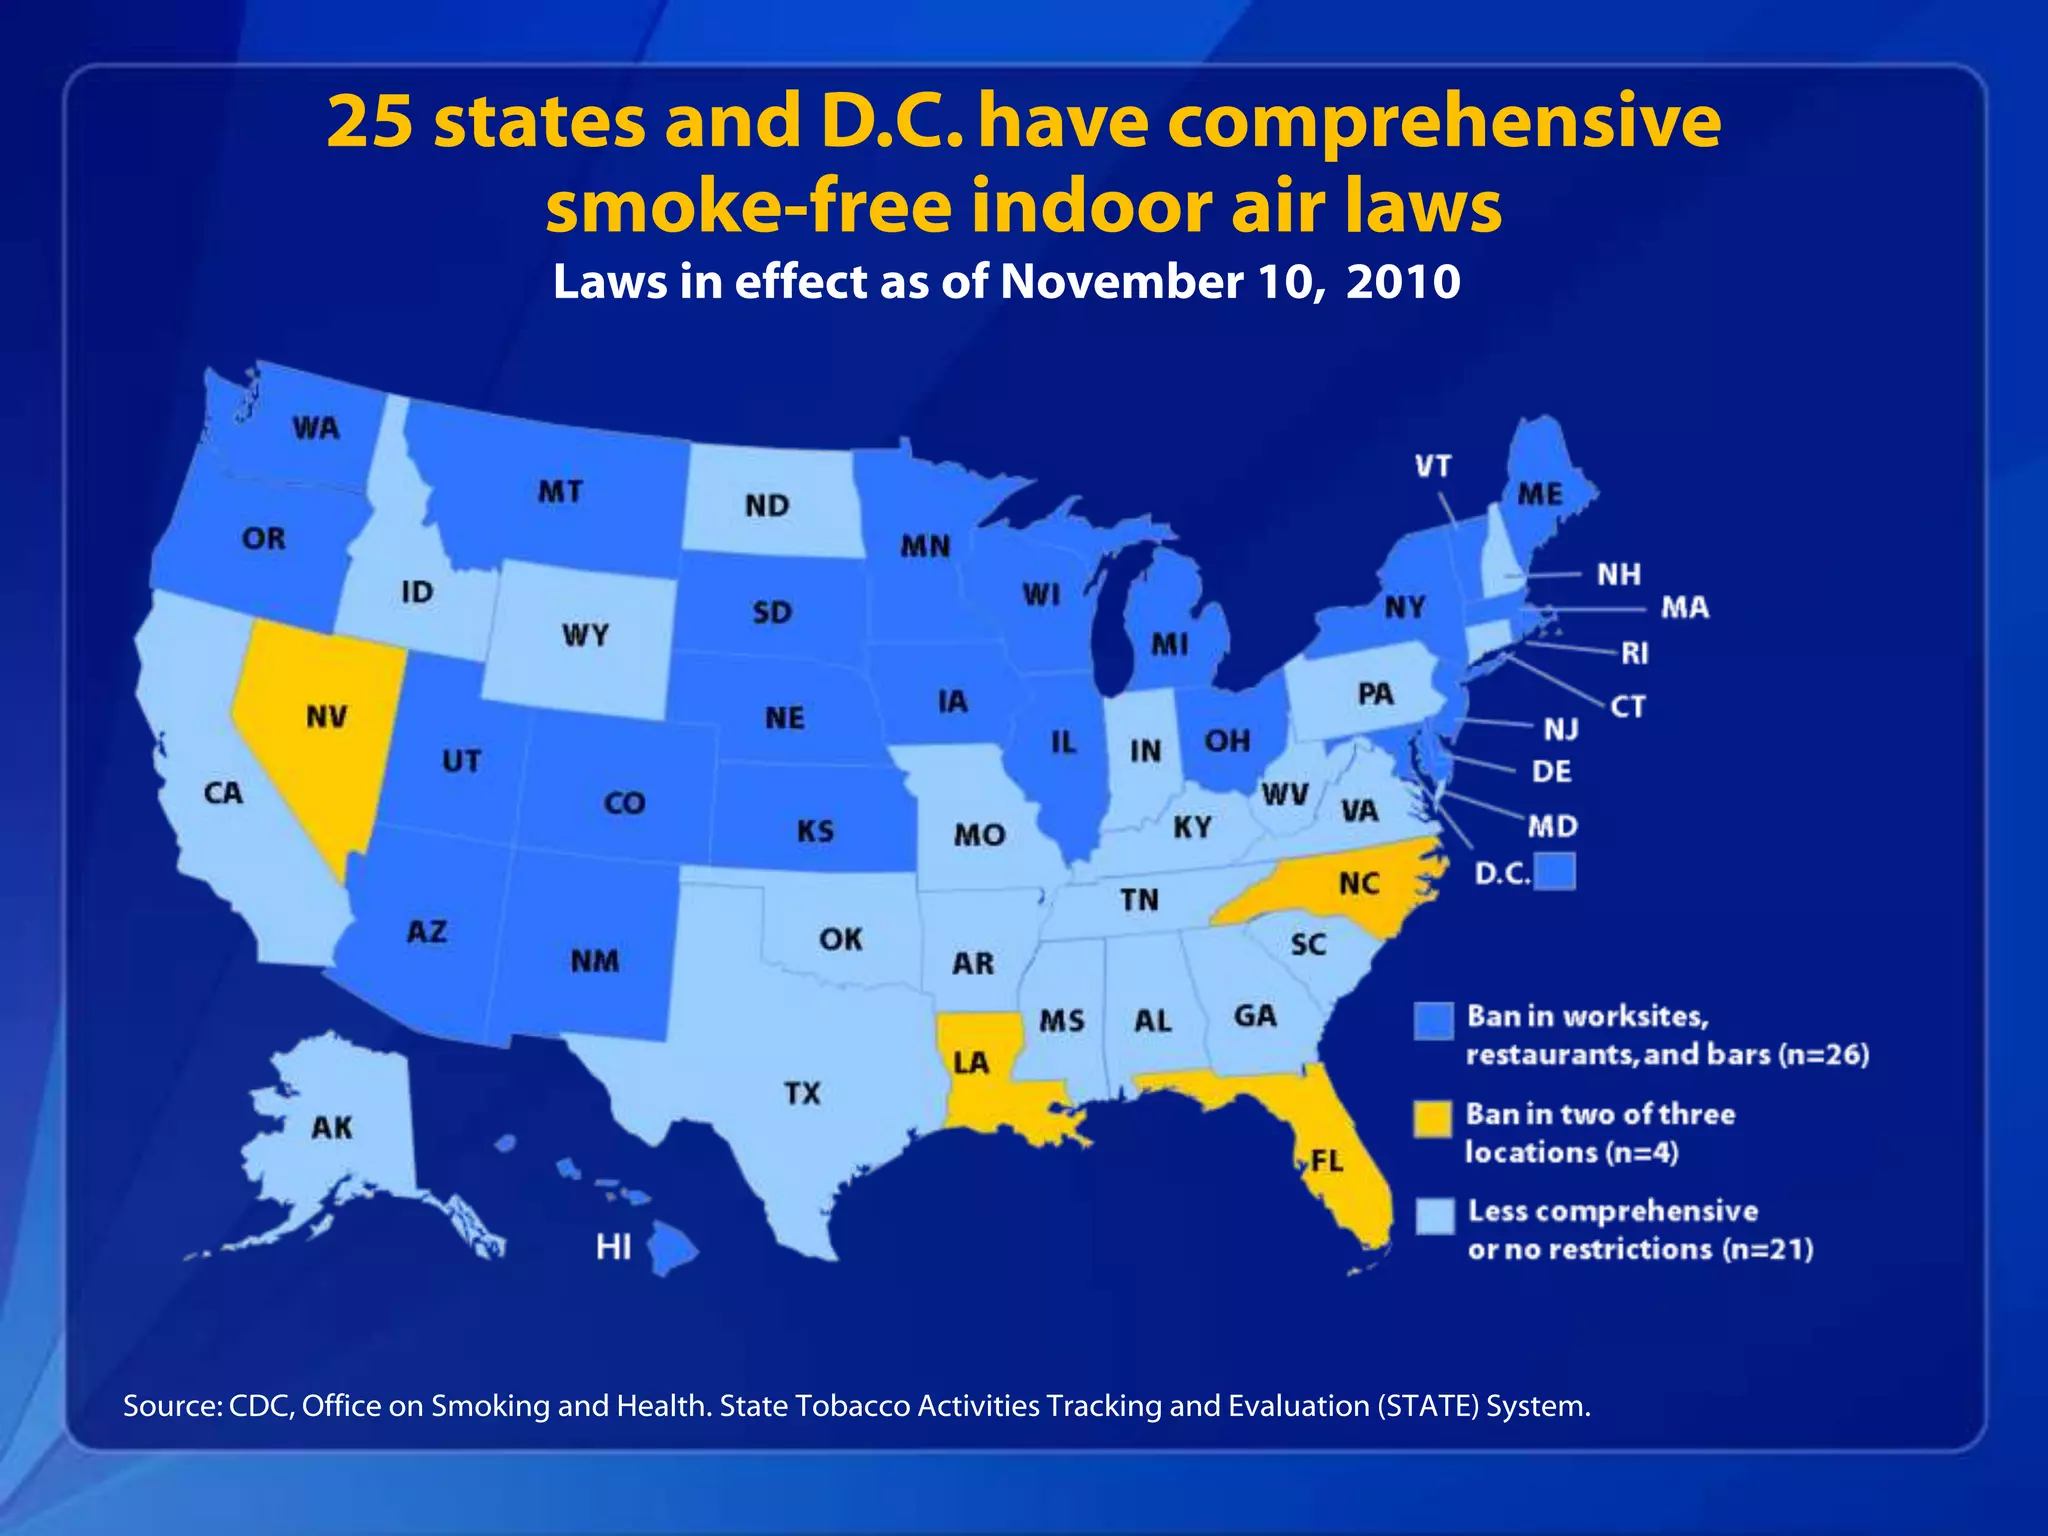
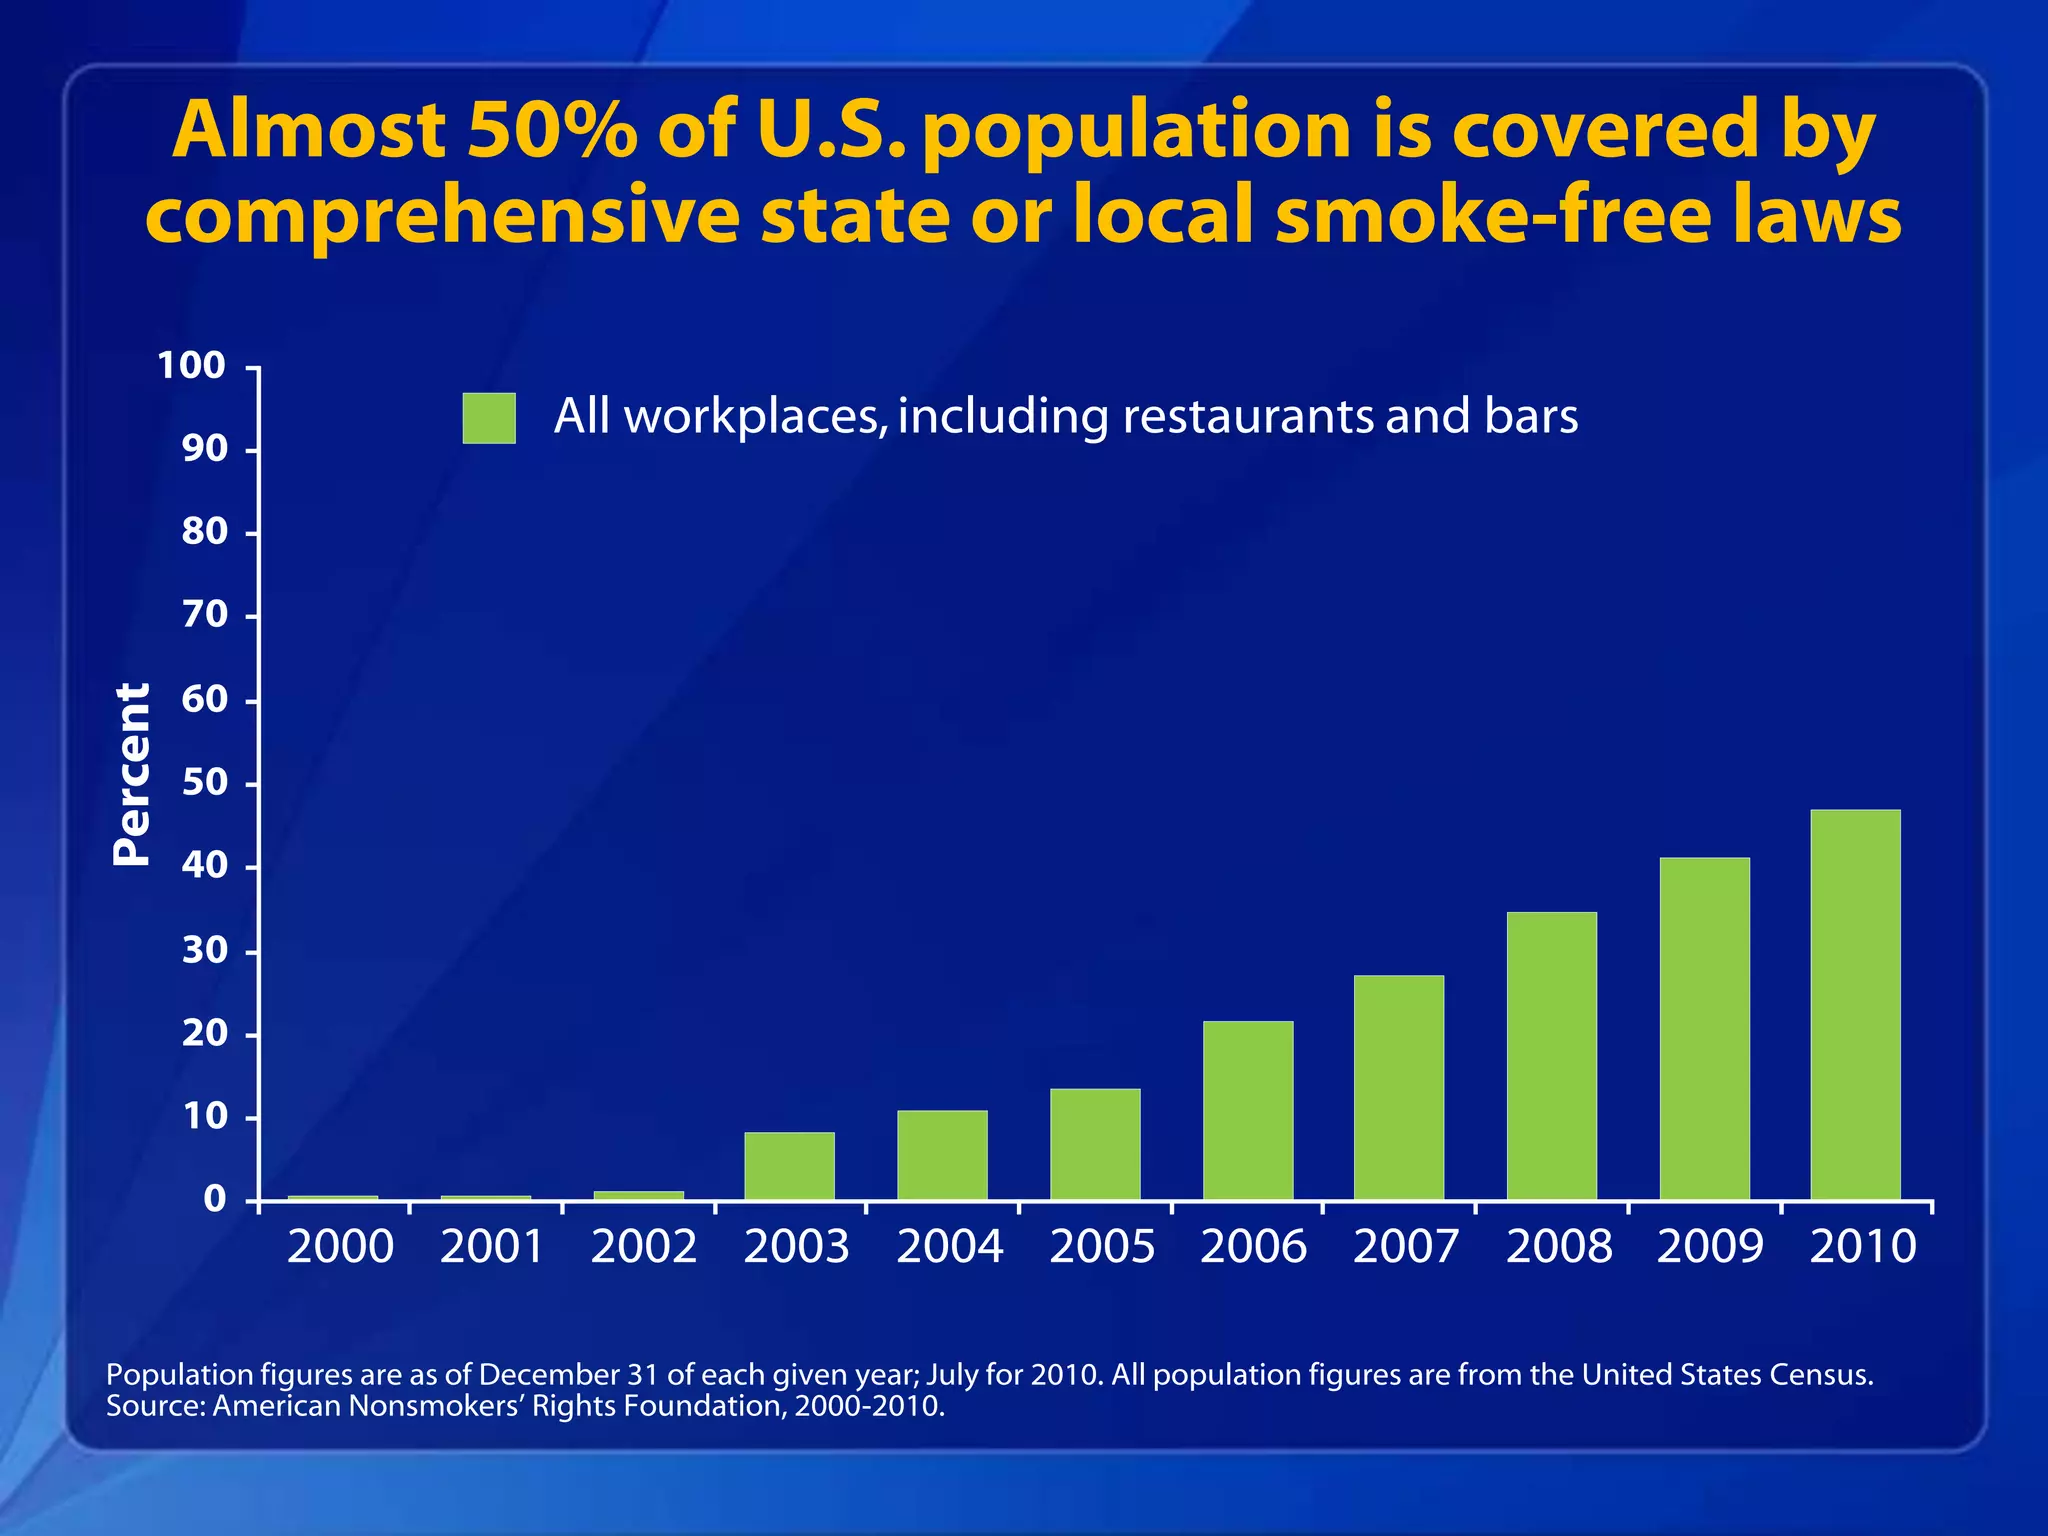
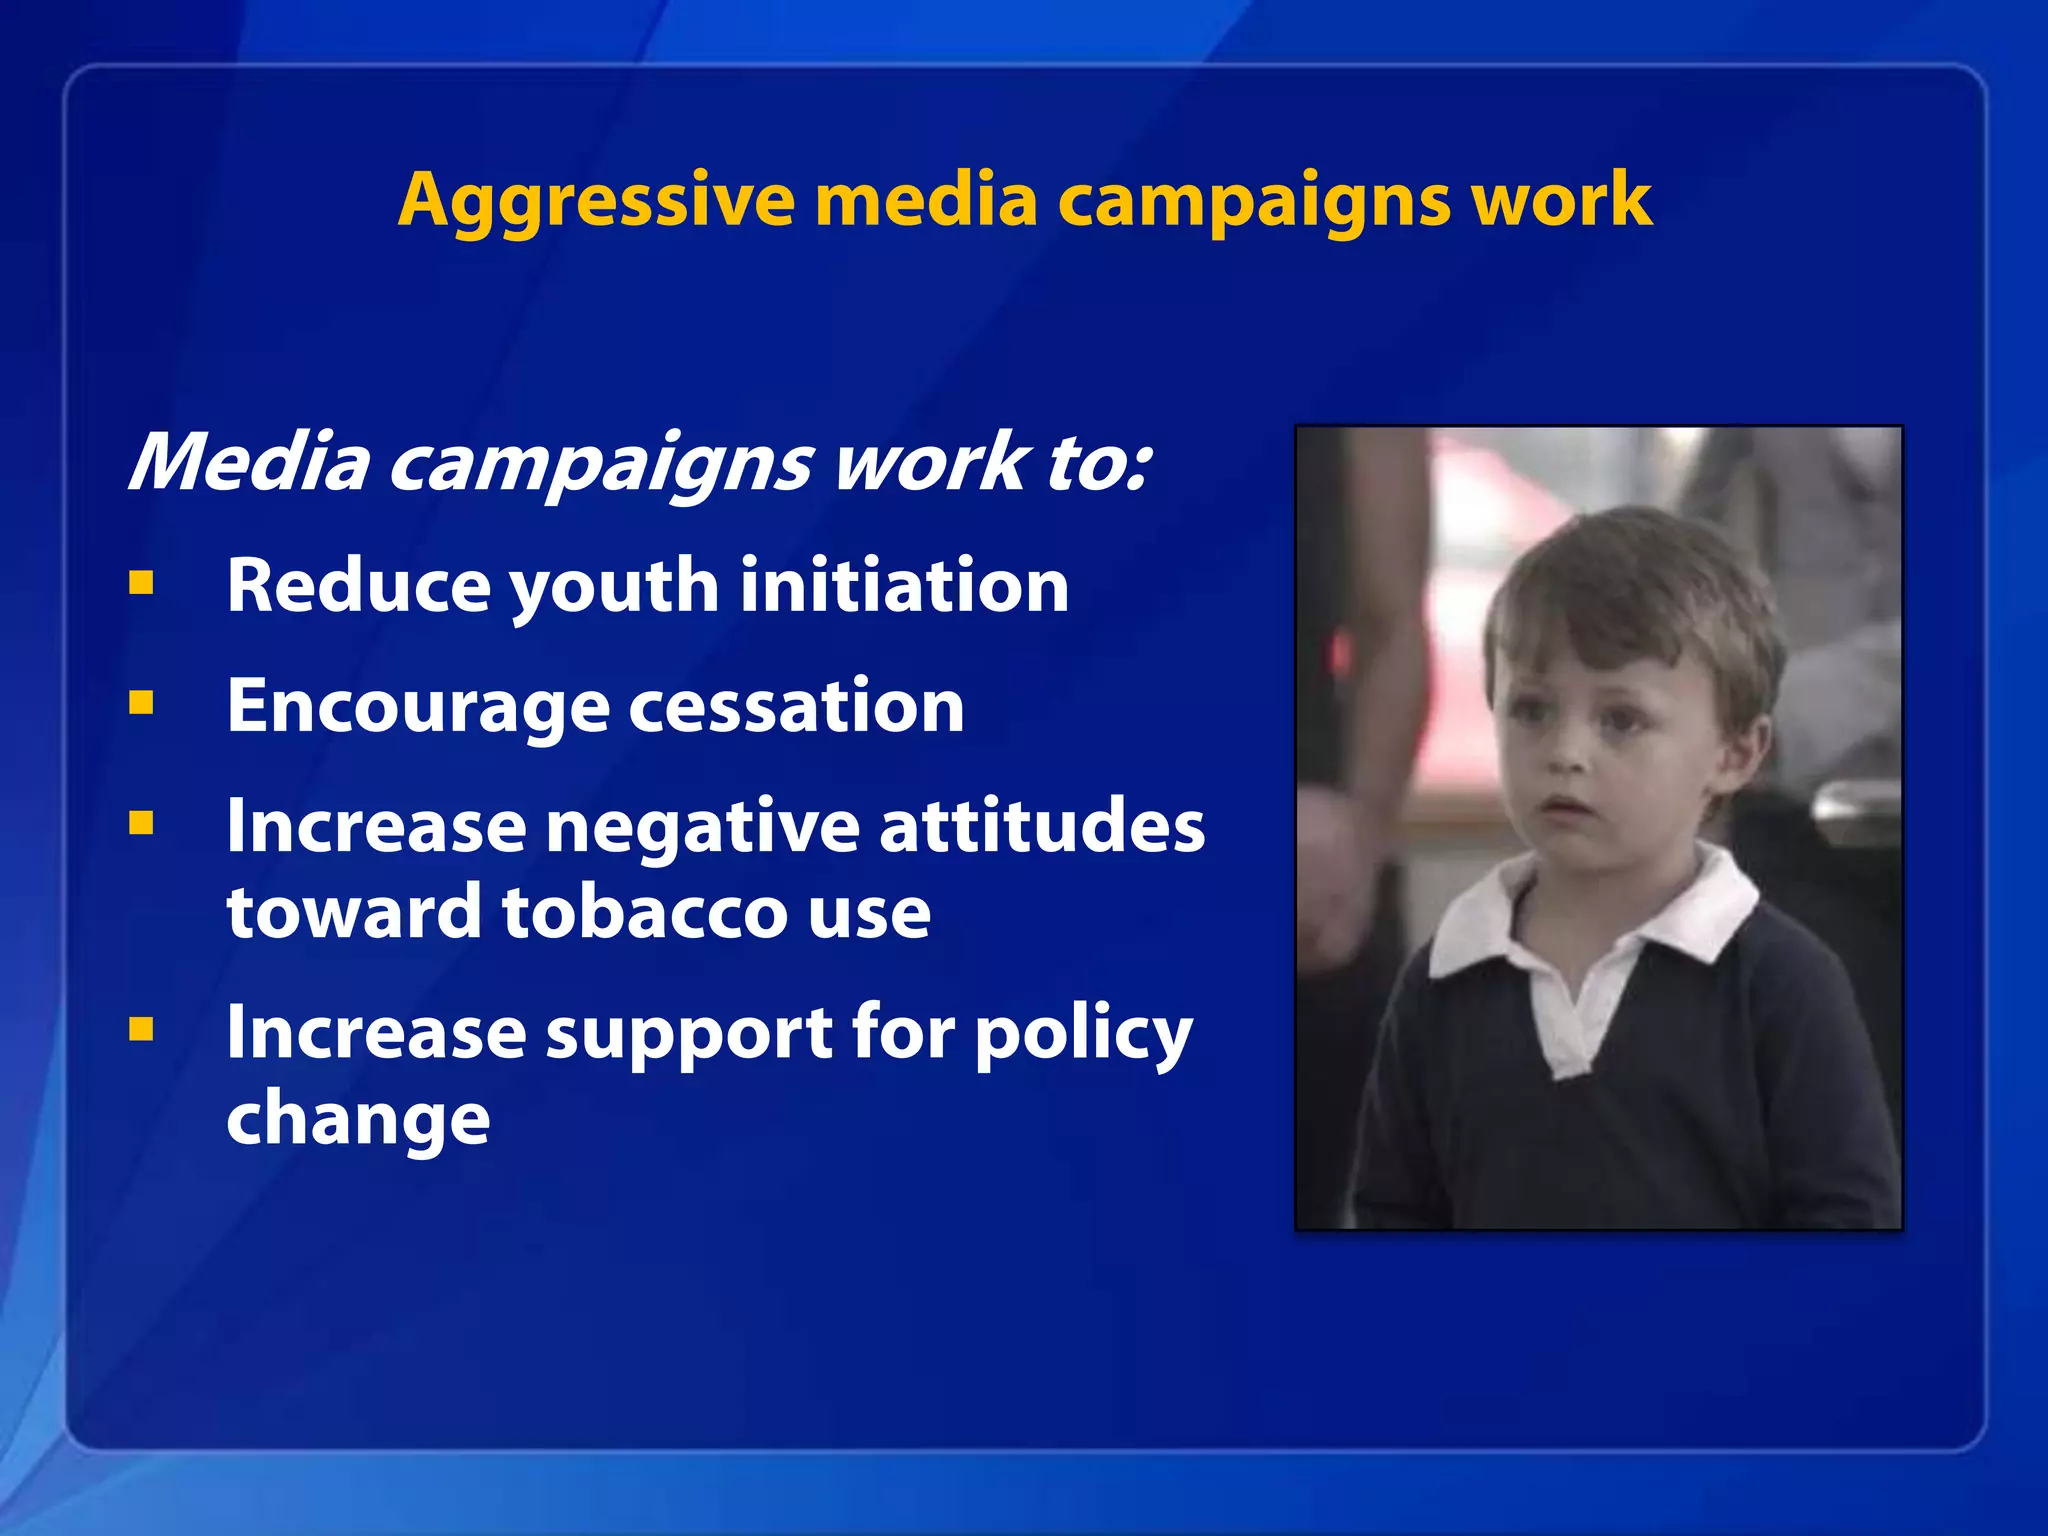
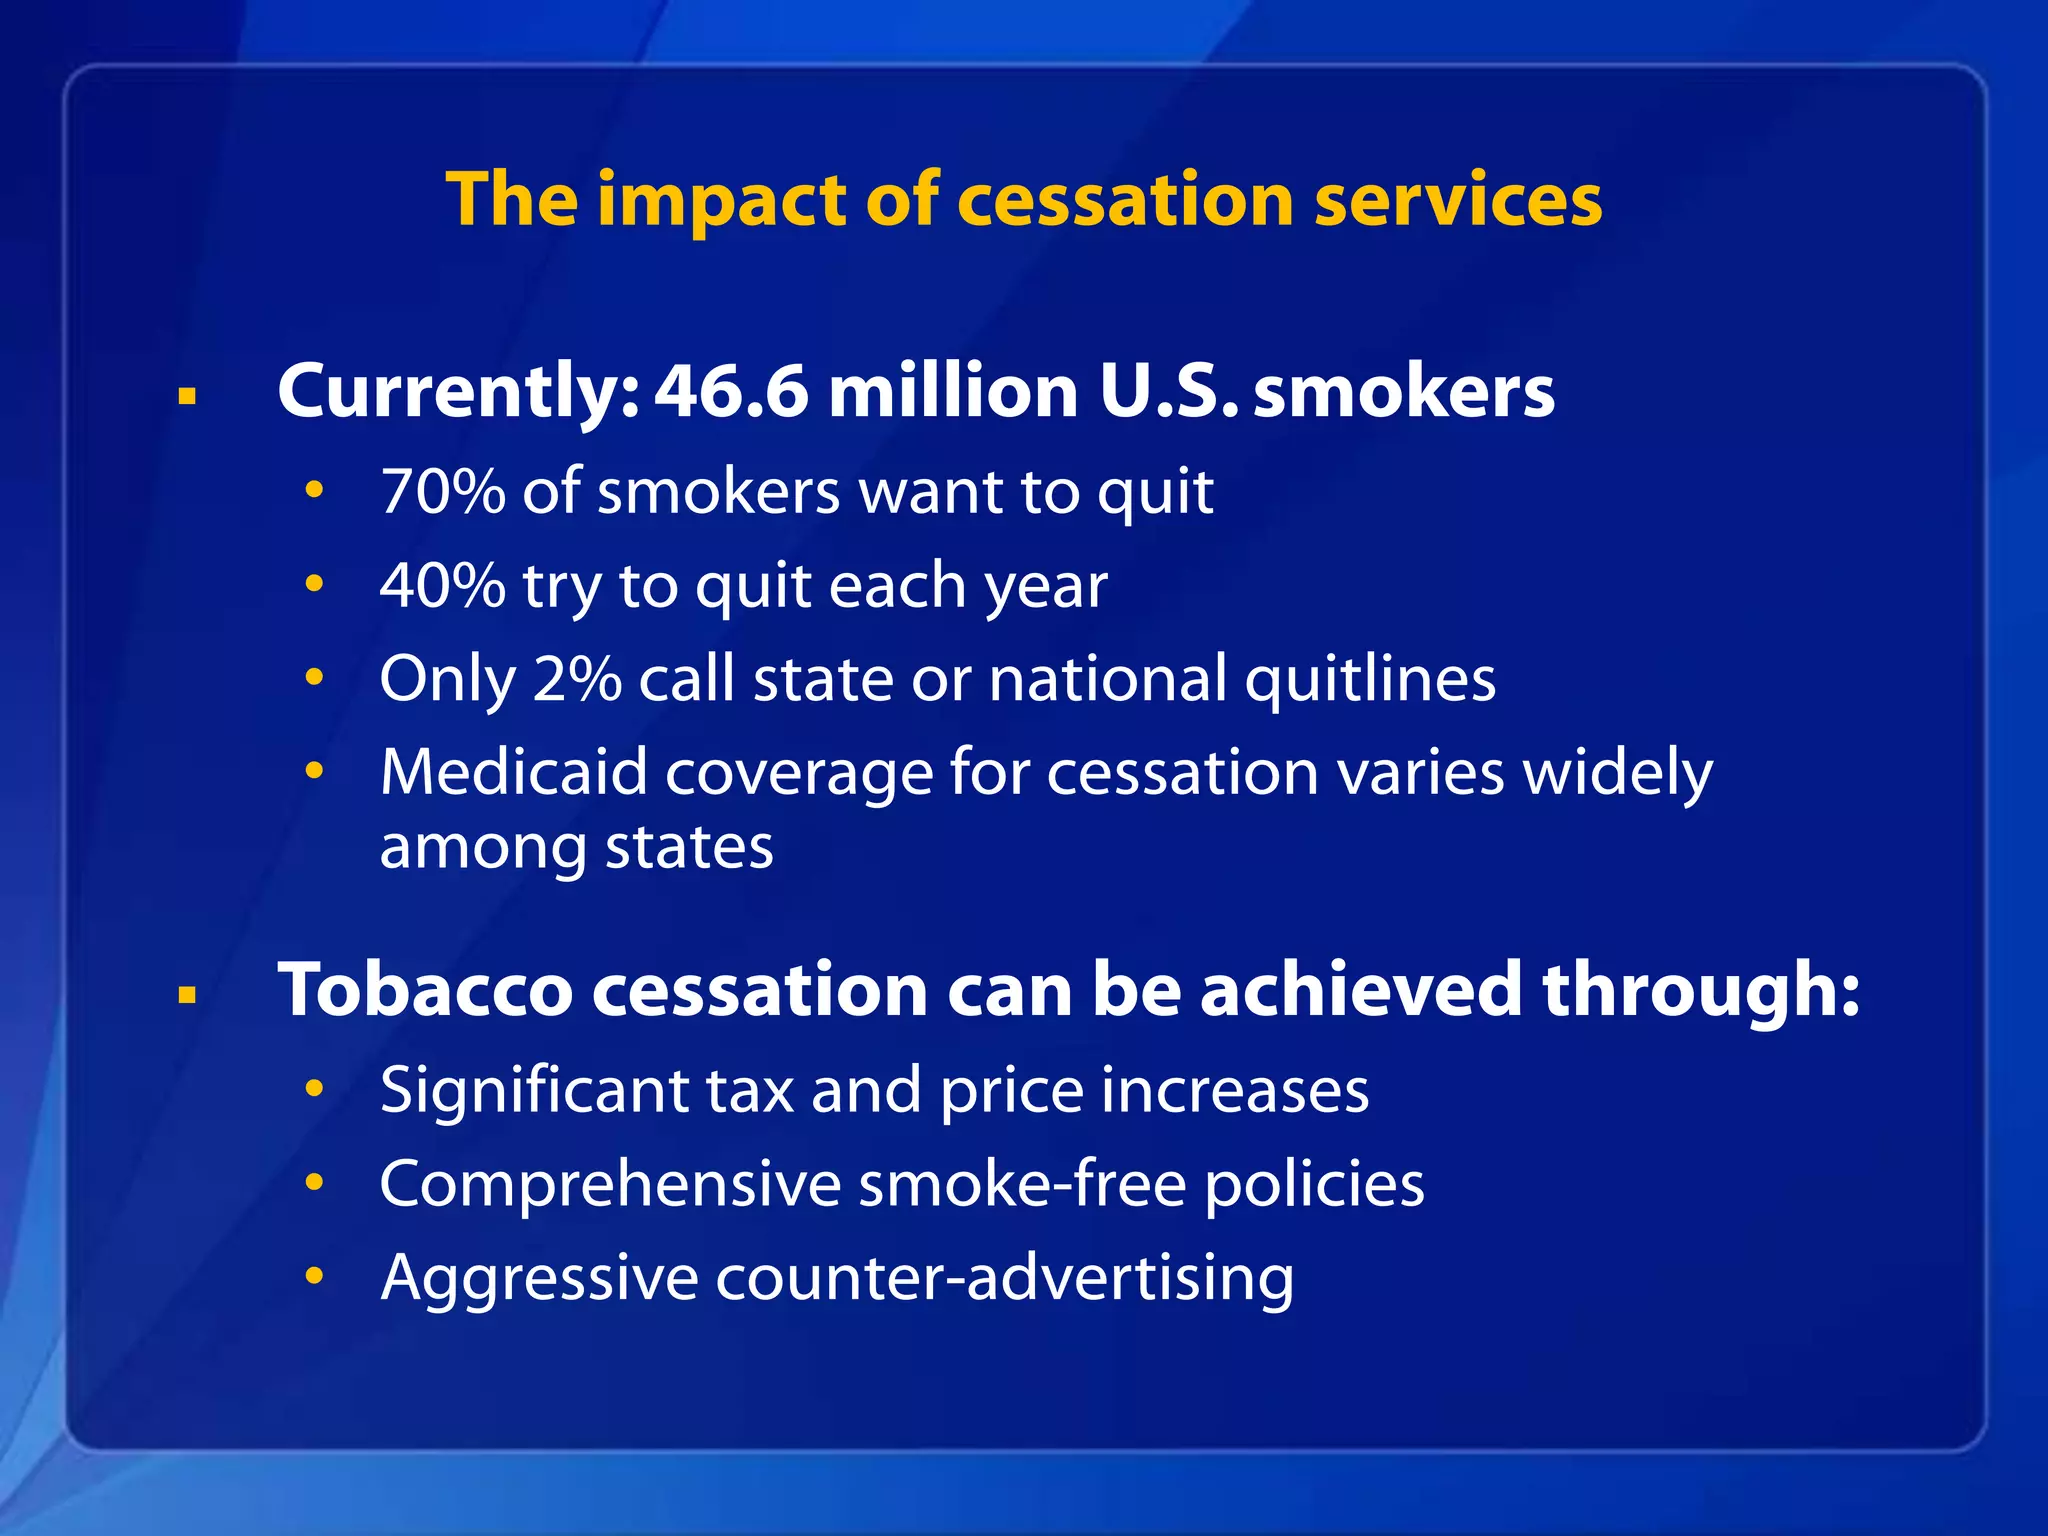
Tobacco use is still the leading preventable cause
               of death in the U.S.
 46.6 million U.S. adults smoke
 Tobacco causes nearly 1 in 5 deaths in U.S.
    • >440,000 deaths/year, >1,200/day
 For each death, it is estimated that 20 more
  suffer tobacco-related illnesses
 Annual costs: $96 billion in medical expenses
  plus $97 billion in lost productivity
 Many Americans left unprotected, especially
  service industry workers
    • 26 states still lack comprehensive smoke-free laws
Tobacco kills about 443,000 in the U.S. every year


Average annual number of deaths, 2000-2004.
Source: Smoking-Attributable Mortality, Years of Potential Life Lost, and Productivity Losses – United States, 2000-2004. MMWR
        2008;57(45):1226-1228.
The decline in adult cigarette smoking
                               has stalled


Civilian, non-institutionalized adults, aged 18 years of age and over, who currently smoked cigarettes.
Source: National Health Interview Surveys, 1965-2009.
Smoking rates vary widely by race/ethnicity


Note: Question wording changed in 1992 in order to identify smokers who smoked less than daily. This graph includes all smokers,
       regardless of frequency.
Source: National Health Interview Survey, 1978-2009; data aggregated for selected years.
Smoking rates vary widely by state/region


Note: Persons who have smoked at least 100 cigarettes in lifetime and currently smoke everyday or some days.
Source: Behavioral Risk Factor Surveillance Survey, NCCDPHP, CDC, 2009.
Heart disease deaths are closely aligned with smoking
                                 Heart Disease Death Rates, 2000-2004
                                Adults ages 35 Years and Older by County


Source: Vital Records; National Center for Health Statistics, CDC, 2000-2004.
Division for Heart Disease and Stroke Prevention: Data Trends & Maps Web site. U.S. Department of Health and Human Services, Centers
for Disease Control and Prevention (CDC), National Center for Chronic Disease Prevention and Health Promotion, Atlanta, GA, 2010.
Available at http://www.cdc.gov/dhdsp/.
Short-term impact of a comprehensive approach:
     Youth and adult smoking rates in NYC


Source: BRFSS 1993-2001; NYC Community Health Survey 2002-2009; NYC YRBS 2001-2009.
Long-term impact of a comprehensive approach:
   Lung and bronchus cancer incidence rates in CA


                                                                    California: A 15 year investment of
                                                                  $1.8 billion in tobacco control reduced
                                                                      health care costs by $86 billion


Rates are per 100,000 and age-adjusted to the 2000 U.S. standard (19 age groups).
* The annual percent change is significantly different from zero (p<0.05).
Source: Cancer Surveillance Section. Prepared by: California Department of Public Health, California Tobacco Control Program, 1988-
2005. 2010.
We know what works

   Sustained funding of
    comprehensive programs
   Excise tax increases
   100% smoke-free policies
   Aggressive media
    campaigns
   Cessation access
   Comprehensive
    advertising restrictions
The tobacco industry is outspending
              tobacco prevention efforts 20:1


Sources: Campaign for Tobacco Free Kids; Federal Trade Commission; CDC Office on Smoking and Health.
When tobacco control funding increases,
          high school smoking decreases


Source: Project ImpacTEEN; University of Illinois at Chicago; State University of New York at Buffalo; Youth Risk Behavior Survey,
        1993-2009.
* Adjusted to 2009 CPI.
† High school students (grades 9-12) who smoked on 1 or more of the 30 days preceding the survey.
When cigarette prices increase,
                             cigarette sales decrease


Source: ImpacTeen Chartbook: Cigarette Smoking Prevalence and Policies in the 50 States.
Increased tobacco excise taxes
                 increase price
 10% increase in cigarette prices  4% drop
  in adult cigarette consumption
 Youth much less likely to start smoking when
  prices are high
 Adjust taxes to offset inflation and tobacco
  industry attempts to control retail prices
   • E.g., promotional discounts for retailers who reduce
     cigarette prices
 Tobacco taxes are the single most effective
  component of a comprehensive tobacco
  control program
Smoke-free policies save lives
 Prevent heart attacks
   • Up to 17% average reduction in heart attack
     hospitalizations in places that enact smoke-free laws
 Help motivate smokers to quit
 Worker safety issue – not “personal nuisance”
   • All workers deserve equal protection
   • Only way to protect non-smokers from secondhand
     smoke
 Smoke-free workplace laws don’t hurt
  business
 No trade-off between health and economics
25 states and D.C. have comprehensive
                    smoke-free indoor air laws
                               Laws in effect as of November 10, 2010


Source: CDC, Office on Smoking and Health. State Tobacco Activities Tracking and Evaluation (STATE) System.
Almost 50% of U.S. population is covered by
  comprehensive state or local smoke-free laws


Population figures are as of December 31 of each given year; July for 2010. All population figures are from the United States Census.
Source: American Nonsmokers’ Rights Foundation, 2000-2010.
Aggressive media campaigns work


Media campaigns work to:
 Reduce youth initiation
 Encourage cessation
 Increase negative attitudes
  toward tobacco use
 Increase support for policy
  change
The impact of cessation services

   Currently: 46.6 million U.S. smokers
    •   70% of smokers want to quit
    •   40% try to quit each year
    •   Only 2% call state or national quitlines
    •   Medicaid coverage for cessation varies widely
        among states

   Tobacco cessation can be achieved through:
    • Significant tax and price increases
    • Comprehensive smoke-free policies
    • Aggressive counter-advertising
State and federal policy activities
                      (2009-2010)
   Excise Tax Increases
    • 21 state increased cigarette taxes

   Smoke-Free Policies
    • 10 additional states achieved comprehensive status

   Federal Legislation
    • Federal excise tax increase
    • Family Smoking Prevention and Tobacco Control Act
    • Prevent All Cigarette Trafficking (PACT) Act
    • Affordable Care Act
Closing Statement


For more information please contact Centers for Disease Control and Prevention

1600 Clifton Road NE, Atlanta, GA 30333
Telephone, 1-800-CDC-INFO (232-4636)/TTY: 1-888-232-6348
E-mail: cdcinfo@cdc.gov     Web: www.cdc.gov

The findings and conclusions in this report are those of the authors and do not necessarily represent the official
position of the Centers for Disease Control and Prevention.


         U.S. Department of Health and Human Services
         Centers for Disease Control and Prevention

Tobacco Winnable Battle presentation

  • 1.
    Tobacco Control: A Winnable Battle U.S. Department of Health and Human Services Centers for Disease Control and Prevention
  • 2.
    Tobacco use damagesvirtually every part of the body Smoking Secondhand Smoke
  • 3.
    Tobacco use isstill the leading preventable cause of death in the U.S.  46.6 million U.S. adults smoke  Tobacco causes nearly 1 in 5 deaths in U.S. • >440,000 deaths/year, >1,200/day  For each death, it is estimated that 20 more suffer tobacco-related illnesses  Annual costs: $96 billion in medical expenses plus $97 billion in lost productivity  Many Americans left unprotected, especially service industry workers • 26 states still lack comprehensive smoke-free laws
  • 4.
    Tobacco kills about443,000 in the U.S. every year Average annual number of deaths, 2000-2004. Source: Smoking-Attributable Mortality, Years of Potential Life Lost, and Productivity Losses – United States, 2000-2004. MMWR 2008;57(45):1226-1228.
  • 5.
    The decline inadult cigarette smoking has stalled Civilian, non-institutionalized adults, aged 18 years of age and over, who currently smoked cigarettes. Source: National Health Interview Surveys, 1965-2009.
  • 6.
    Smoking rates varywidely by race/ethnicity Note: Question wording changed in 1992 in order to identify smokers who smoked less than daily. This graph includes all smokers, regardless of frequency. Source: National Health Interview Survey, 1978-2009; data aggregated for selected years.
  • 7.
    Smoking rates varywidely by state/region Note: Persons who have smoked at least 100 cigarettes in lifetime and currently smoke everyday or some days. Source: Behavioral Risk Factor Surveillance Survey, NCCDPHP, CDC, 2009.
  • 8.
    Heart disease deathsare closely aligned with smoking Heart Disease Death Rates, 2000-2004 Adults ages 35 Years and Older by County Source: Vital Records; National Center for Health Statistics, CDC, 2000-2004. Division for Heart Disease and Stroke Prevention: Data Trends & Maps Web site. U.S. Department of Health and Human Services, Centers for Disease Control and Prevention (CDC), National Center for Chronic Disease Prevention and Health Promotion, Atlanta, GA, 2010. Available at http://www.cdc.gov/dhdsp/.
  • 9.
    Short-term impact ofa comprehensive approach: Youth and adult smoking rates in NYC Source: BRFSS 1993-2001; NYC Community Health Survey 2002-2009; NYC YRBS 2001-2009.
  • 10.
    Long-term impact ofa comprehensive approach: Lung and bronchus cancer incidence rates in CA California: A 15 year investment of $1.8 billion in tobacco control reduced health care costs by $86 billion Rates are per 100,000 and age-adjusted to the 2000 U.S. standard (19 age groups). * The annual percent change is significantly different from zero (p<0.05). Source: Cancer Surveillance Section. Prepared by: California Department of Public Health, California Tobacco Control Program, 1988- 2005. 2010.
  • 12.
    We know whatworks  Sustained funding of comprehensive programs  Excise tax increases  100% smoke-free policies  Aggressive media campaigns  Cessation access  Comprehensive advertising restrictions
  • 13.
    The tobacco industryis outspending tobacco prevention efforts 20:1 Sources: Campaign for Tobacco Free Kids; Federal Trade Commission; CDC Office on Smoking and Health.
  • 14.
    When tobacco controlfunding increases, high school smoking decreases Source: Project ImpacTEEN; University of Illinois at Chicago; State University of New York at Buffalo; Youth Risk Behavior Survey, 1993-2009. * Adjusted to 2009 CPI. † High school students (grades 9-12) who smoked on 1 or more of the 30 days preceding the survey.
  • 15.
    When cigarette pricesincrease, cigarette sales decrease Source: ImpacTeen Chartbook: Cigarette Smoking Prevalence and Policies in the 50 States.
  • 16.
    Increased tobacco excisetaxes increase price  10% increase in cigarette prices  4% drop in adult cigarette consumption  Youth much less likely to start smoking when prices are high  Adjust taxes to offset inflation and tobacco industry attempts to control retail prices • E.g., promotional discounts for retailers who reduce cigarette prices  Tobacco taxes are the single most effective component of a comprehensive tobacco control program
  • 17.
    Smoke-free policies savelives  Prevent heart attacks • Up to 17% average reduction in heart attack hospitalizations in places that enact smoke-free laws  Help motivate smokers to quit  Worker safety issue – not “personal nuisance” • All workers deserve equal protection • Only way to protect non-smokers from secondhand smoke  Smoke-free workplace laws don’t hurt business  No trade-off between health and economics
  • 18.
    25 states andD.C. have comprehensive smoke-free indoor air laws Laws in effect as of November 10, 2010 Source: CDC, Office on Smoking and Health. State Tobacco Activities Tracking and Evaluation (STATE) System.
  • 19.
    Almost 50% ofU.S. population is covered by comprehensive state or local smoke-free laws Population figures are as of December 31 of each given year; July for 2010. All population figures are from the United States Census. Source: American Nonsmokers’ Rights Foundation, 2000-2010.
  • 20.
    Aggressive media campaignswork Media campaigns work to:  Reduce youth initiation  Encourage cessation  Increase negative attitudes toward tobacco use  Increase support for policy change
  • 21.
    The impact ofcessation services  Currently: 46.6 million U.S. smokers • 70% of smokers want to quit • 40% try to quit each year • Only 2% call state or national quitlines • Medicaid coverage for cessation varies widely among states  Tobacco cessation can be achieved through: • Significant tax and price increases • Comprehensive smoke-free policies • Aggressive counter-advertising
  • 22.
    State and federalpolicy activities (2009-2010)  Excise Tax Increases • 21 state increased cigarette taxes  Smoke-Free Policies • 10 additional states achieved comprehensive status  Federal Legislation • Federal excise tax increase • Family Smoking Prevention and Tobacco Control Act • Prevent All Cigarette Trafficking (PACT) Act • Affordable Care Act
  • 23.
    Closing Statement For moreinformation please contact Centers for Disease Control and Prevention 1600 Clifton Road NE, Atlanta, GA 30333 Telephone, 1-800-CDC-INFO (232-4636)/TTY: 1-888-232-6348 E-mail: cdcinfo@cdc.gov Web: www.cdc.gov The findings and conclusions in this report are those of the authors and do not necessarily represent the official position of the Centers for Disease Control and Prevention. U.S. Department of Health and Human Services Centers for Disease Control and Prevention

Editor's Notes

  • #3 Image 1 shows each part of the body that can be affected by cancer or chronic disease due to smoking. Image 2 illustrates the adverse health effects across the body due to secondhand smoke exposure for both children and adults.
  • #5 Pie chart breaks down the percentages of tobacco-related deaths in the U.S.
  • #6 Graph shows that decline in adult cigarette smoking rate has stalled.
  • #7 Graph maps the change in smoking rates for each ethnicity by year.
  • #8 U.S. Map is color-coded to illustrate the age-adjusted smoking rates in each state.
  • #9 U.S. Map is color-coded to illustrate heart disease death rates by county.
  • #10 Graph shows trends in youth and adult smoking rates in New York City, with dips labeled as specific public health interventions.
  • #11 Graph compares lung and bronchus cancer incidence rates of California and the U.S. as a whole.
  • #12 Image explaining “mpower,” where “m” = monitor, “p” = protect, “o” =offer, “w” = warn, “e” = enforce, and “r” = raise.
  • #14 Bar graph compares tobacco company revenues, tobacco company spending, CDC tobacco spending, and state tobacco spending.
  • #15 Graph shows correlation between tobacco prevention spending levels and high school smoking rates.
  • #16 Graph shows inverse correlation between cigarette prices and cigarette sales.
  • #19 U.S. map color-coded to illustrate stringency level of smoke-free indoor air laws by state.
  • #20 Bar graph shows yearly increase in U.S. population’s coverage under comprehensive state and local smoke-free laws.