Download to read offline
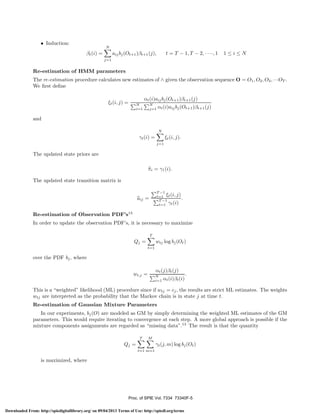
![cjm N (Ot , μjm , Ujm )
M
k=1 cjk N (Ot , μjm , Ujm )
γt (j, m) = wt,j
.
Here, the weights γt (j, m) are interpreted as the probability that the Markov chain is in state j and the
observation is from mixture component m at time t. The resulting update equations for cjm , μjm , and Ujm are
computed as follows:
cjm =
ˆ
T
t=1
T
t=1
γt (j, m)
M
l=1
γt (j, l)
.
The above expression is similar to re-estimation of GM.5 This means that the algorithms designed for GM
are applicable for updating the state PDFs of the HMM. Therefore,
T
t=1 γt (j, m)Ot
T
t=1 γt (j, m)
μjm =
ˆ
ˆ
Ujm =
T
t=1
γt (j, m)(Ot − μjm )(Ot − μjm )
T
t=1
γt (j, m)
.
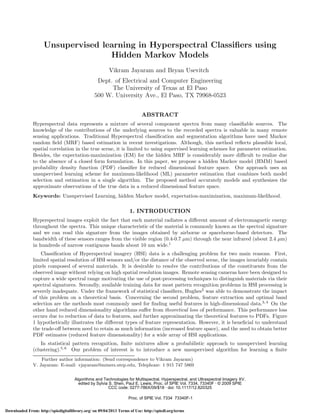
4. MINIMUM NOISE FRACTION TRANSFORM
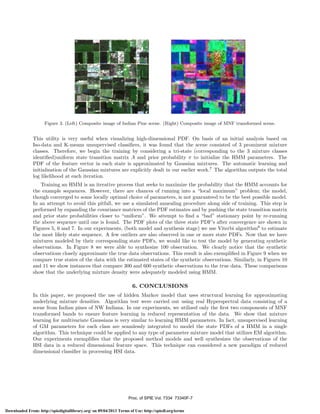
Before we begin the our section on experiments, we shall define minimum noise fraction (MNF) transform
since we use them to obtain a 2D feature plot of the true data as shown in Figure 3 (right). The MNF
transformation is a highly useful spectral processing tool in HSI analysis.14 It is used to determine the inherent
dimensionality of image data, to segregate noise in the data, and to reduce the computational requirements
for subsequent processing. This transform is essentially two cascaded principal components transformations.
The first transformation, based on an estimated noise covariance matrix, decorrelates and rescales the noise
in the data. This first step results in transformed data in which the noise has unit variance and no band-toband correlations. The second step is a standard principal components transformation of the noise-whitened
data. For the purposes of further spectral processing, the inherent dimensionality of the data is determined by
examination of the final eigenvalues and the associated images. The data space can be divided into two parts:
one part associated with large eigenvalues and coherent eigenimages, and a complementary part with near-unity
eigenvalues and noise-dominated images. By using only the coherent portions, the noise is separated from the
data, thus the image bands get ranked based on signal to noise ratios (SNR).
5. EXPERIMENTS
The remote sensing data sets that we have used in our experiments comes from an Airborne Visible/Infrared
Imaging Spectrometer (AVIRIS) sensor image. AVIRIS is a unique optical sensor that delivers calibrated images
of the upwelling spectral radiance in 224 contiguous spectral bands with wavelengths corresponding to 0.4-2.5
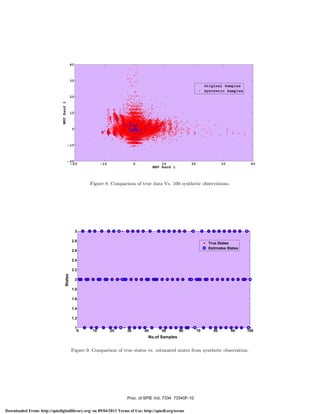
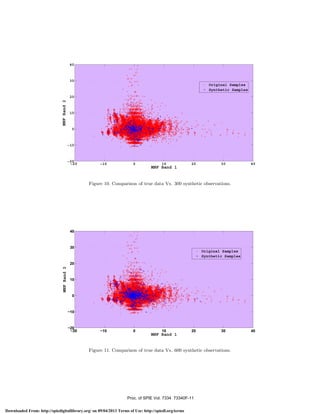
μm. AVIRIS is flown all across the US, Canada and Europe. Figure 3 shows data sets used in our experiments
that belong to a Indian Pine scene in northwest Indiana. The spatial bands of this scene are of size 169 X 169
pixels. Since, HSI imagery is highly correlated in the spectral direction using MNF rotation is an obvious choice
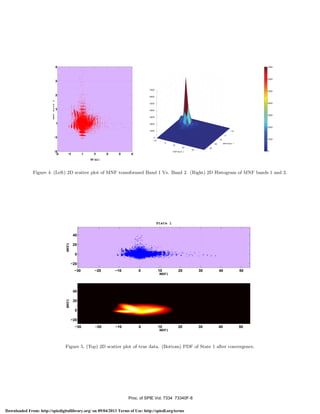
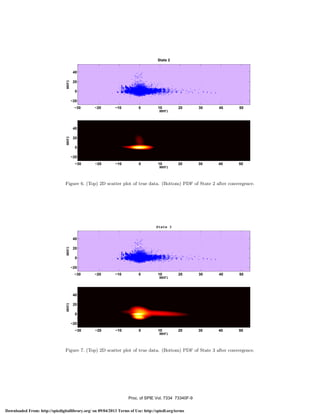
for decorrelation among the bands. This also results in a 2D “scatter” plot of the first two MNF components
of the data as shown in Figure 3. The scatter plots used in the paper are similar to marginalized PDF on
any 2D plane. Marginalization could be easily depicted for visualizing state PDFs of HMM. To illustrate this
visualization scheme, let z = [z1 , z2 , z3 , z4 ]. For example, to visualize on the (z2 , z4 ) plane, we would need to
compute
p(z2 , z4 ) =
z1
z3
p(z1 , z2 , z3 , z4 )dz1 dz3 .
Proc. of SPIE Vol. 7334 73340F-6
Downloaded From: http://spiedigitallibrary.org/ on 09/04/2013 Terms of Use: http://spiedl.org/terms](https://image.slidesharecdn.com/2009spiehmm-131120175753-phpapp01/85/2009-spie-hmm-6-320.jpg)
![ACKNOWLEDGMENTS
We would like to thank department of Geological Sciences at UTEP for providing access to the ENVI software
and LARS, Purdue University for making the HSI data15 available. This work was supported by NASA Earth
System Science (ESS) doctoral fellowship at the University of Texas at El Paso.
REFERENCES
[1] Schott, J. R., [Remote Sensing: The Image Chain Approach], Oxford University Press.
[2] Hughes, G. F., “On the mean accuracy of statistical pattern recognizers,” IEEE Transactions on Information
Theory 14, 55–63 (1968).
[3] Shaw, G. and Manolakis, D., “Signal processing for hyperspectral image exploitation,” IEEE Signal Processing Magazine 19, 12–16 (2002).
[4] Keshava, N., “Distance metrics & band selection in hyperspectral processing with applications to material
identification and spectral libraries,” IEEE Transactions on Geoscience and Remote Sensing 42, No. 7,
1552–1565 (July 2004).
[5] McLachlan, G. and Peel, D., [Finite Mixture Models], Wiley Series in Probability and Statistics, New York,
NY, second ed. (2000).
[6] Figueiredo, M. A. T. and Jain, A. K., “Unsupervised learning of finite mixture models,” IEEE Transactions
on Pattern Analysis and Machine Intelligence 24, 381–396 (2002).
[7] Jayaram, V. and Usevitch, B., “Dynamic mixing kernels in gaussian mixture classifier for hyperspectral
classification,” in [Mathematics of Data/Image Pattern Recognition, Compression, and Encryption with
Applications XI, Proceedings of the SPIE], 70750L–70750L–8 (2008).
[8] Rabiner, L. R., “A tutorial on hidden Markov models and selected applications in speech recognition,” in
[Proceedings of the IEEE], 257–286 (1989).
[9] Du, Q. and Chang, C.-I., “A hidden markov model approach to spectral analysis for hyperspectral imagery,”
Optical Engineering 40, No. 10, 2277–2284 (2001).
[10] Bali, N. and Mohammad-Djafari, A., “Bayesian approach with hidden Markov modeling and Mean Field
Approximation for Hyperspectral data analysis,” IEEE Transactions on Image Processing 17, No. 2, 217–
225 (2008).
[11] J. Li, A. N. and Gray, R. M., “Image classification by a two-dimensional hidden Markov model,” IEEE
Trans. Signal Processing 48, 517–533 (2000).
[12] Marden, D. B. and Manolakis, D. G., “Modeling hyperspectral imaging data,” in [Algorithms and Technologies for Multispectral, Hyperspectral, and Ultraspectral Imagery IX. Edited by Shen, Sylvia S.; Lewis, Paul
E. Proceedings of the SPIE], 253–262 (2003).
[13] Huang, B. H., “Maximum likelihood estimation for mixture multivariate stochastic observations of markov
chains,” in [AT&T Technical Journal], 1235–1249 (1985).
[14] A. A. Green, M. Berman, P. S. and Craig, M. D., “A transformation for ordering multispectral data in
terms of image quality with implications for noise removal,” IEEE Transcations on Geoscience and Remote
Sensing 26, 65–74 (1988).
[15] Landgrebe, D., “AVIRIS derived Northwest Indianas Indian Pines 1992 Hyperspectral dataset,”
http://dynamo.ecn.purdue.edu/ biehl/MultiSpec/documentation.html. .
Proc. of SPIE Vol. 7334 73340F-12
Downloaded From: http://spiedigitallibrary.org/ on 09/04/2013 Terms of Use: http://spiedl.org/terms](https://image.slidesharecdn.com/2009spiehmm-131120175753-phpapp01/85/2009-spie-hmm-12-320.jpg)

This document discusses using hidden Markov models (HMMs) for unsupervised learning in hyperspectral image classification. It proposes an HMM-based probability density function classifier that models hyperspectral data using a reduced feature space. The approach uses an unsupervised learning scheme for maximum likelihood parameter estimation, combining both model selection and estimation. This HMM method can accurately model and synthesize approximate observations of true hyperspectral data in a reduced feature space without relying on supervised learning.


![5G Explained! A High Level Overview [Introduction]](https://cdn.slidesharecdn.com/ss_thumbnails/5gexplainedahighleveloverview-260119165306-cc137a3e-thumbnail.jpg?width=640&height=640&fit=bounds)


