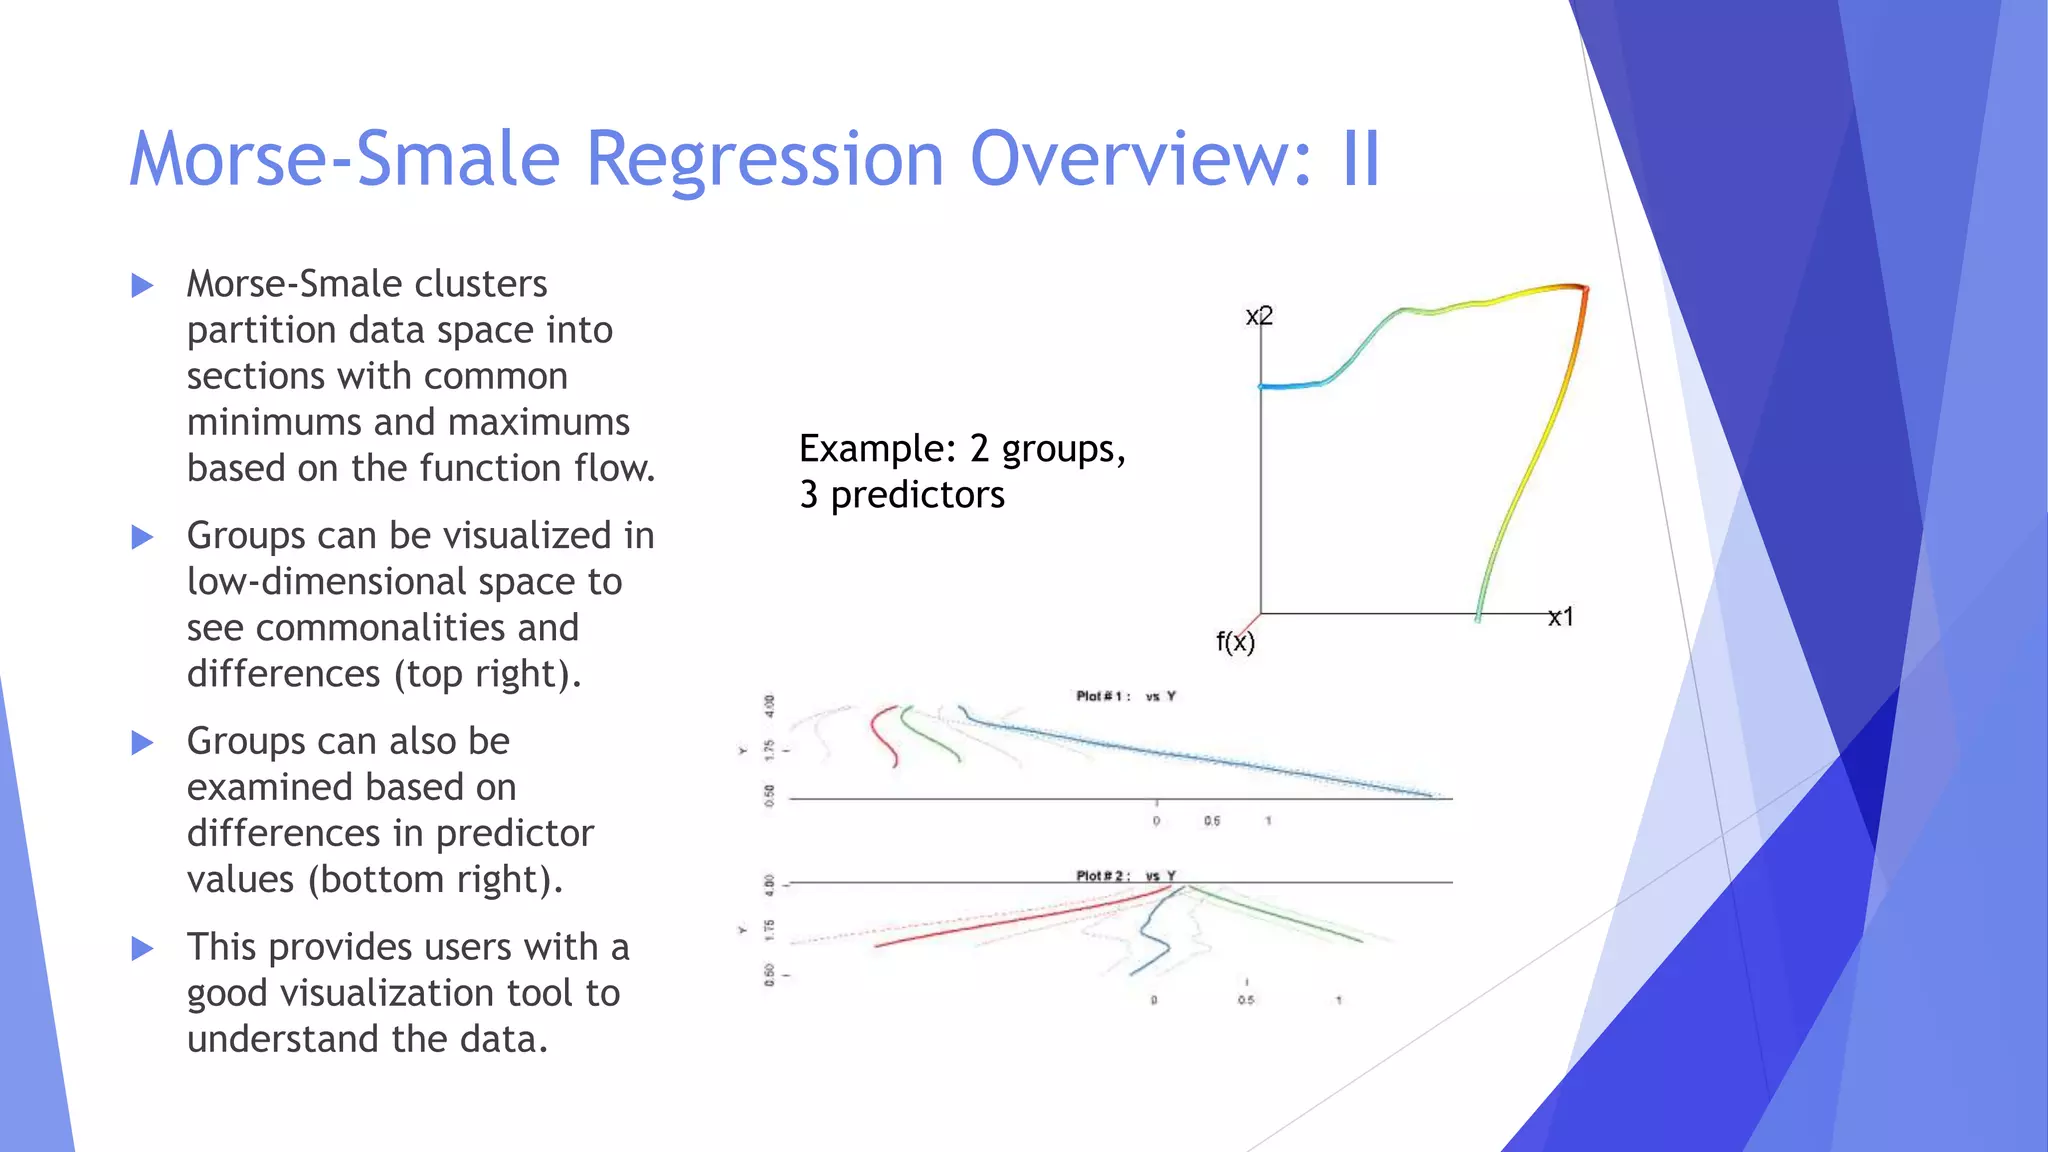
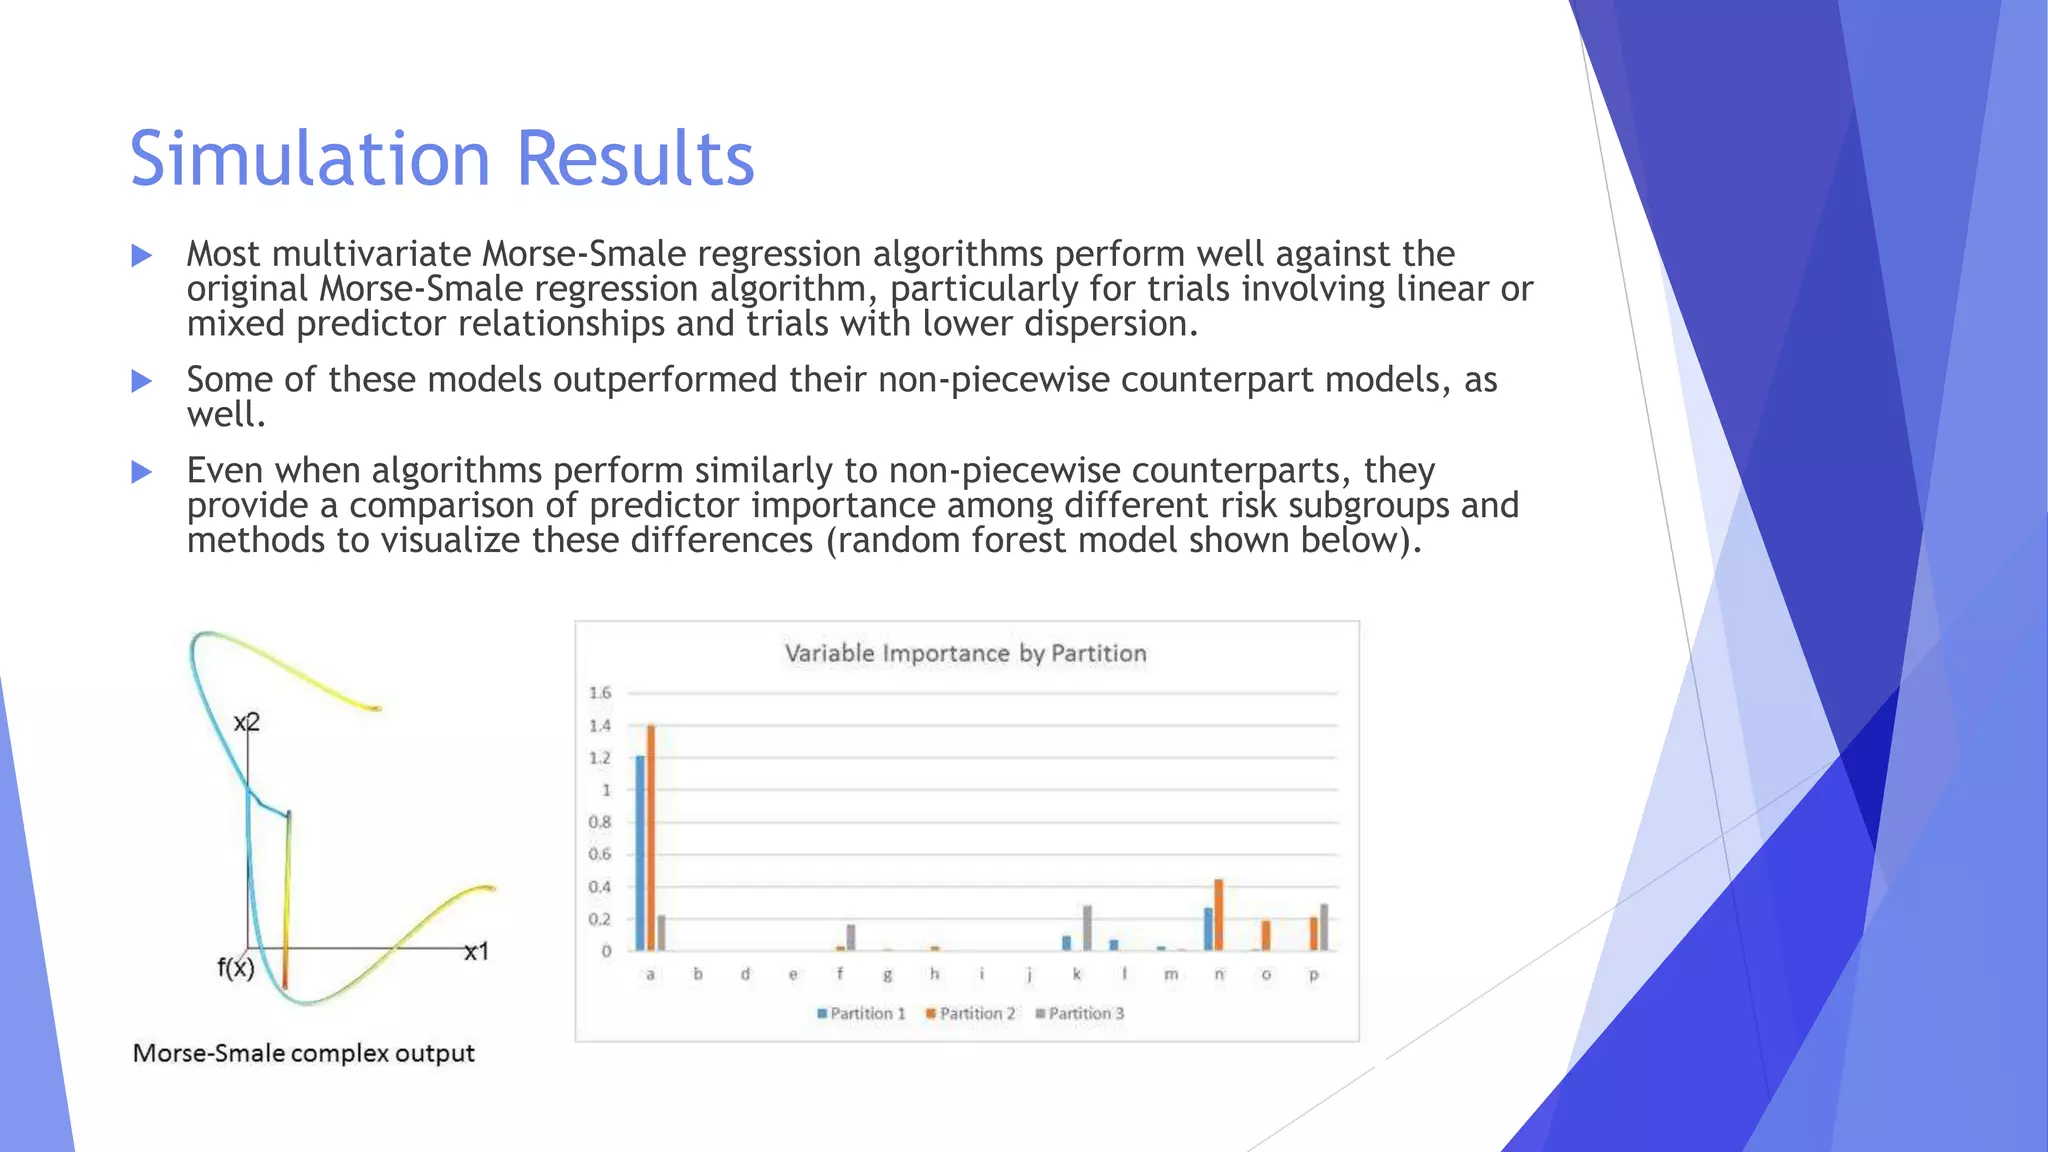
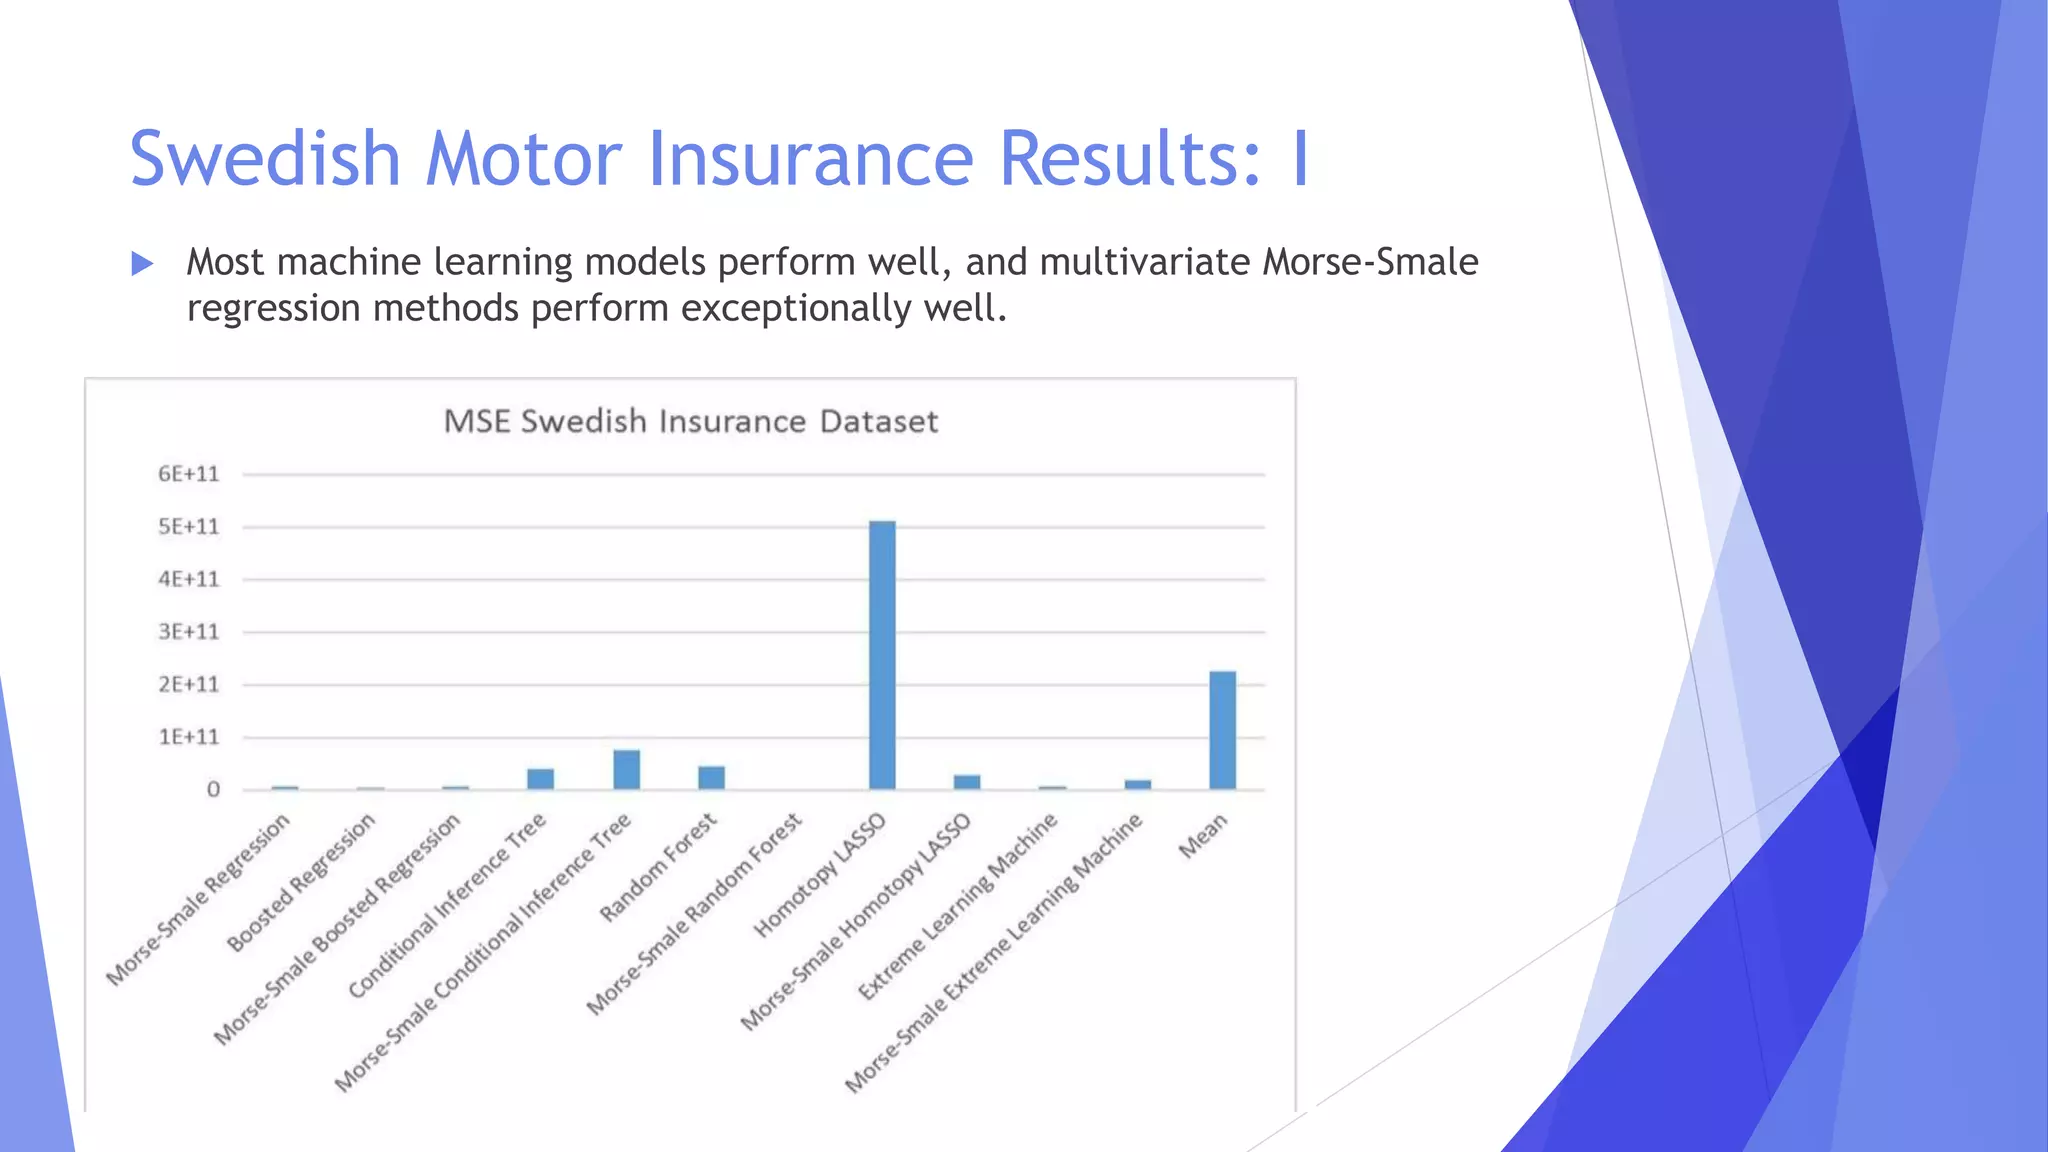
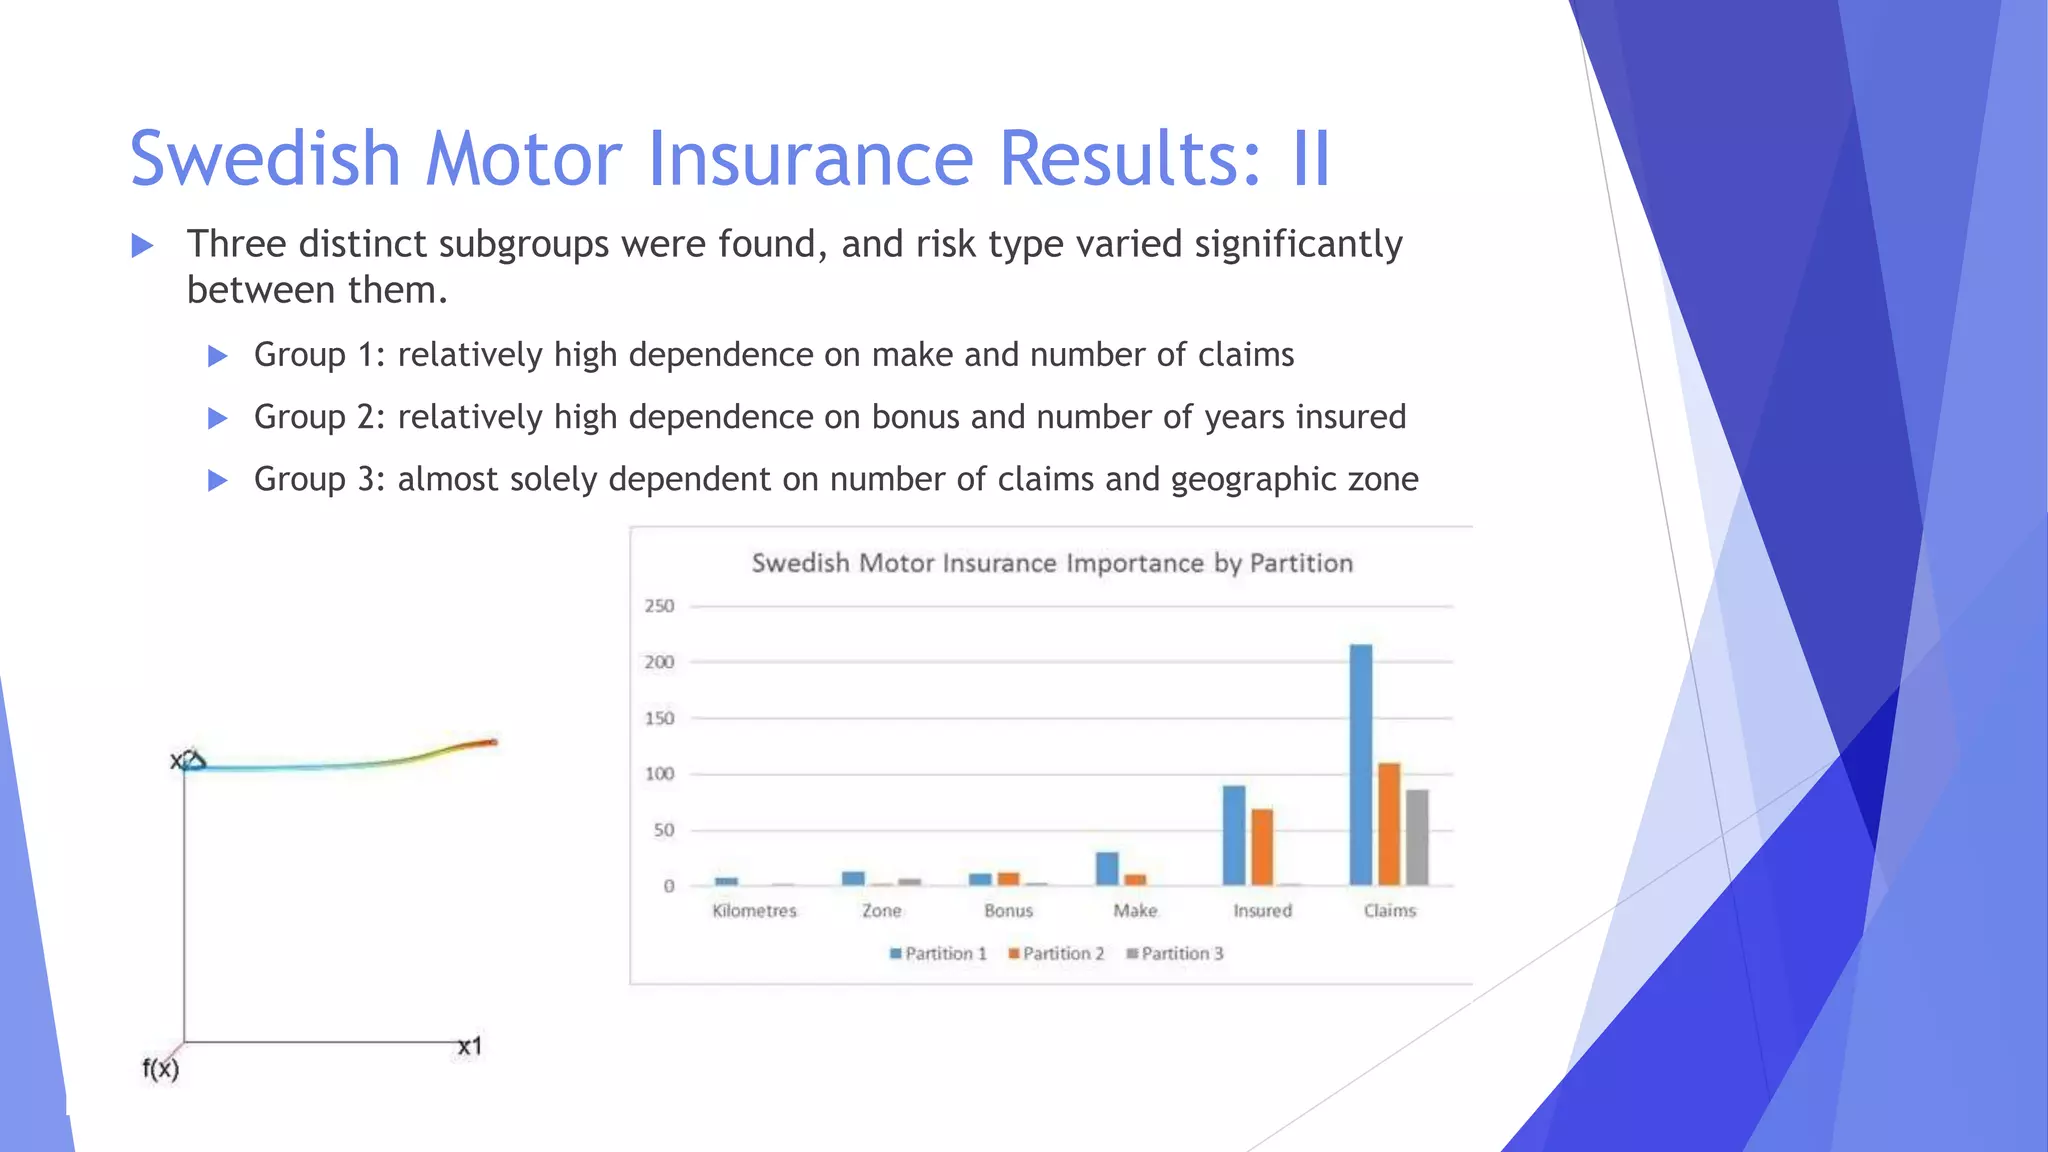
Morse-Smale Regression
Extensions for Risk
Modeling
Colleen M. Farrelly
Introduction
 Subgroups are ubiquitous in scientific research and actuarial science.
 Risk is not uniform.
 Risk types can vary in degree and kind, and high risk on some factors are not as
high risk overall as lower risk on other factors.
 Piecewise regression is one method that can accurately capture this
phenomenon.
 Morse-Smale regression is a topologically-based piecewise regression method
that has shown promise on various Tweedie-distributed outcomes, including
common distributions used in modeling risk.
 This method currently employs elastic net and generalized linear modeling to fit
the regression pieces to Morse-Smale-complex-based partitions.
 Many machine learning extensions of regression exist and can capture multivariate
trends in the data, which is a limitation of both elastic net and generalized linear
modeling.
 Extending Morse-Smale regression to machine-learning-based models can
potentially improve accuracy and understanding of risk.
Tweedie Regression Overview
• Tweedie model framework (many
biological/social count variables):
• y=φµξ
• Where φ is the dispersion parameter (extra
zeros in model, here=1.5)
• µ is the mean
• ξ is the Tweedie parameter (increased mass
near zero and fatness of non-zero
distributions)
• Many exponential distributions converge to
Tweedie distributions (normal, Poisson,
gamma, compound Poisson-gamma…)
• Examples
• Number of students enrolled by advisor in a
month
• Insurance claim payout
• Heroin use per month
Morse-Smale Regression Overview: I
 To build intuition:
 Imagine a soccer player kicking a ball on the ground of a hilly field to explore the
field.
 The high and low points (maxima and minima) determine where the ball will come to rest.
 These paths of the ball define which parts of the field share common hills and valleys.
 These paths are actually gradient paths defined by height on the field’s topological
space.
 The spaces they define are the Morse-Smale complex of the field, partitioning it
into different regions (clusters).
Morse-Smale Regression Overview: II
 Morse-Smale clusters
partition data space into
sections with common
minimums and maximums
based on the function flow.
 Groups can be visualized in
low-dimensional space to
see commonalities and
differences (top right).
 Groups can also be
examined based on
differences in predictor
values (bottom right).
 This provides users with a
good visualization tool to
understand the data.
Example: 2 groups,
3 predictors
Extending Morse-Smale Regression
 Multivariate algorithms to fit partitioned regression models
 Random forest
 Bagged ensemble of tree models
 Akin to combining novel summaries of a class randomly assigned a few chapters
 Boosted regression
 Iteratively added model of main effects and interaction terms
 Akin to guessing a puzzle’s picture by adding key pieces until the picture is mostly there
 Homotopy LASSO
 Extends penalized regression model (LASSO) through homotopy estimation methods
 Akin to a blind-folded person navigating around obstacles between two set points by
following a rope
 Conditional inference tree
 Tree method that partitions space by assessing covariate independence
 Extreme learning machine
 Single-layer feed-forward neural networks based on random mapping between layers
 Has universal approximation properties
Simulation and Swedish Motor Insurance
 Simulation
 Simulation design parameters
 4 true predictors, 11 noise variables
 Sample size set to 10,000
 Outcome Tweedie-distributed, with Tweedie parameter varying (1, 1.5, 2) and dispersion
(1, 2, 4)
 Nature of predictor relationships varied (4 main effects, 2 interaction effects, or a
combination of 2 main effects and 1 interaction effect)
 Each trial was run 10 times with a 70/30 training/test split.
 Mean square error (MSE) was used to assess model accuracy.
 Swedish 3rd Party Motor Insurance 1977
 2182 observations with 6 predictors (kilometers traveled per year, geographic zone,
bonus, car model make, number of years insured, total claims)
 MSE assessed for all models based on 70/30 training/test split
Simulation Results
 Most multivariate Morse-Smale regression algorithms perform well against the
original Morse-Smale regression algorithm, particularly for trials involving linear or
mixed predictor relationships and trials with lower dispersion.
 Some of these models outperformed their non-piecewise counterpart models, as
well.
 Even when algorithms perform similarly to non-piecewise counterparts, they
provide a comparison of predictor importance among different risk subgroups and
methods to visualize these differences (random forest model shown below).
Swedish Motor Insurance Results: I
 Most machine learning models perform well, and multivariate Morse-Smale
regression methods perform exceptionally well.
Swedish Motor Insurance Results: II
 Three distinct subgroups were found, and risk type varied significantly
between them.
 Group 1: relatively high dependence on make and number of claims
 Group 2: relatively high dependence on bonus and number of years insured
 Group 3: almost solely dependent on number of claims and geographic zone
Conclusions
 Multivariate Morse-Smale regression models typically:
 Outperform the original Morse-Smale regression algorithm
 Perform comparably to the non-partitioned models built with the same machine
learning algorithm.
 Multivariate Morse-Smale regression models provide subgroup-based analytics
capabilities and differentiated risk structure abilities that can help actuaries:
 Better understand risk
 Create models based on insurance policy risk groups (as well as risk level)
 Visualize this process to help others within the industry understand the models
(less black-box)
 However, some black-box algorithms perform better on Tweedie regression
problems (particularly Farrelly, 2017, KNN regression ensembles); these
methods don’t allow for visualization or comparison of risk factors.
 Large sample sizes are needed for good performance, but most insurance
datasets are large enough to circumvent potential convergence issues.
References
 Talk is a summary of:
 Farrelly, C. M. (2017). Extensions of Morse-Smale Regression with Application to
Actuarial Science. arXiv preprint arXiv:1708.05712.—Accepted Dec 2017 for
publication by Casualty Actuarial Society
 Selected references from 2017 Farrelly paper:
 De Jong, P., & Heller, G. Z. (2008). Generalized linear models for insurance data
(Vol. 10). Cambridge: Cambridge University Press.
 Farrelly, C. M. (2017). KNN Ensembles for Tweedie Regression: The Power of
Multiscale Neighborhoods. arXiv preprint arXiv:1708.02122.
 Gerber, S., Rübel, O., Bremer, P. T., Pascucci, V., & Whitaker, R. T. (2013). Morse–
smale regression. Journal of Computational and Graphical Statistics, 22(1), 193-
214.
 McZgee, V. E., & Carleton, W. T. (1970). Piecewise regression. Journal of the
American Statistical Association, 65(331), 1109-1124.
 Tomoda, K., Morino, K., Murata, H., Asaoka, R., & Yamanishi, K. (2016). Predicting
Glaucomatous Progression with Piecewise Regression Model from Heterogeneous
Medical Data. HEALTHINF, 2016.

Morse-Smale Regression for Risk Modeling

  • 1.
    Morse-Smale Regression Extensions forRisk Modeling Colleen M. Farrelly
  • 2.
    Introduction  Subgroups areubiquitous in scientific research and actuarial science.  Risk is not uniform.  Risk types can vary in degree and kind, and high risk on some factors are not as high risk overall as lower risk on other factors.  Piecewise regression is one method that can accurately capture this phenomenon.  Morse-Smale regression is a topologically-based piecewise regression method that has shown promise on various Tweedie-distributed outcomes, including common distributions used in modeling risk.  This method currently employs elastic net and generalized linear modeling to fit the regression pieces to Morse-Smale-complex-based partitions.  Many machine learning extensions of regression exist and can capture multivariate trends in the data, which is a limitation of both elastic net and generalized linear modeling.  Extending Morse-Smale regression to machine-learning-based models can potentially improve accuracy and understanding of risk.
  • 3.
    Tweedie Regression Overview •Tweedie model framework (many biological/social count variables): • y=φµξ • Where φ is the dispersion parameter (extra zeros in model, here=1.5) • µ is the mean • ξ is the Tweedie parameter (increased mass near zero and fatness of non-zero distributions) • Many exponential distributions converge to Tweedie distributions (normal, Poisson, gamma, compound Poisson-gamma…) • Examples • Number of students enrolled by advisor in a month • Insurance claim payout • Heroin use per month
  • 4.
    Morse-Smale Regression Overview:I  To build intuition:  Imagine a soccer player kicking a ball on the ground of a hilly field to explore the field.  The high and low points (maxima and minima) determine where the ball will come to rest.  These paths of the ball define which parts of the field share common hills and valleys.  These paths are actually gradient paths defined by height on the field’s topological space.  The spaces they define are the Morse-Smale complex of the field, partitioning it into different regions (clusters).
  • 5.
    Morse-Smale Regression Overview:II  Morse-Smale clusters partition data space into sections with common minimums and maximums based on the function flow.  Groups can be visualized in low-dimensional space to see commonalities and differences (top right).  Groups can also be examined based on differences in predictor values (bottom right).  This provides users with a good visualization tool to understand the data. Example: 2 groups, 3 predictors
  • 6.
    Extending Morse-Smale Regression Multivariate algorithms to fit partitioned regression models  Random forest  Bagged ensemble of tree models  Akin to combining novel summaries of a class randomly assigned a few chapters  Boosted regression  Iteratively added model of main effects and interaction terms  Akin to guessing a puzzle’s picture by adding key pieces until the picture is mostly there  Homotopy LASSO  Extends penalized regression model (LASSO) through homotopy estimation methods  Akin to a blind-folded person navigating around obstacles between two set points by following a rope  Conditional inference tree  Tree method that partitions space by assessing covariate independence  Extreme learning machine  Single-layer feed-forward neural networks based on random mapping between layers  Has universal approximation properties
  • 7.
    Simulation and SwedishMotor Insurance  Simulation  Simulation design parameters  4 true predictors, 11 noise variables  Sample size set to 10,000  Outcome Tweedie-distributed, with Tweedie parameter varying (1, 1.5, 2) and dispersion (1, 2, 4)  Nature of predictor relationships varied (4 main effects, 2 interaction effects, or a combination of 2 main effects and 1 interaction effect)  Each trial was run 10 times with a 70/30 training/test split.  Mean square error (MSE) was used to assess model accuracy.  Swedish 3rd Party Motor Insurance 1977  2182 observations with 6 predictors (kilometers traveled per year, geographic zone, bonus, car model make, number of years insured, total claims)  MSE assessed for all models based on 70/30 training/test split
  • 8.
    Simulation Results  Mostmultivariate Morse-Smale regression algorithms perform well against the original Morse-Smale regression algorithm, particularly for trials involving linear or mixed predictor relationships and trials with lower dispersion.  Some of these models outperformed their non-piecewise counterpart models, as well.  Even when algorithms perform similarly to non-piecewise counterparts, they provide a comparison of predictor importance among different risk subgroups and methods to visualize these differences (random forest model shown below).
  • 9.
    Swedish Motor InsuranceResults: I  Most machine learning models perform well, and multivariate Morse-Smale regression methods perform exceptionally well.
  • 10.
    Swedish Motor InsuranceResults: II  Three distinct subgroups were found, and risk type varied significantly between them.  Group 1: relatively high dependence on make and number of claims  Group 2: relatively high dependence on bonus and number of years insured  Group 3: almost solely dependent on number of claims and geographic zone
  • 11.
    Conclusions  Multivariate Morse-Smaleregression models typically:  Outperform the original Morse-Smale regression algorithm  Perform comparably to the non-partitioned models built with the same machine learning algorithm.  Multivariate Morse-Smale regression models provide subgroup-based analytics capabilities and differentiated risk structure abilities that can help actuaries:  Better understand risk  Create models based on insurance policy risk groups (as well as risk level)  Visualize this process to help others within the industry understand the models (less black-box)  However, some black-box algorithms perform better on Tweedie regression problems (particularly Farrelly, 2017, KNN regression ensembles); these methods don’t allow for visualization or comparison of risk factors.  Large sample sizes are needed for good performance, but most insurance datasets are large enough to circumvent potential convergence issues.
  • 12.
    References  Talk isa summary of:  Farrelly, C. M. (2017). Extensions of Morse-Smale Regression with Application to Actuarial Science. arXiv preprint arXiv:1708.05712.—Accepted Dec 2017 for publication by Casualty Actuarial Society  Selected references from 2017 Farrelly paper:  De Jong, P., & Heller, G. Z. (2008). Generalized linear models for insurance data (Vol. 10). Cambridge: Cambridge University Press.  Farrelly, C. M. (2017). KNN Ensembles for Tweedie Regression: The Power of Multiscale Neighborhoods. arXiv preprint arXiv:1708.02122.  Gerber, S., Rübel, O., Bremer, P. T., Pascucci, V., & Whitaker, R. T. (2013). Morse– smale regression. Journal of Computational and Graphical Statistics, 22(1), 193- 214.  McZgee, V. E., & Carleton, W. T. (1970). Piecewise regression. Journal of the American Statistical Association, 65(331), 1109-1124.  Tomoda, K., Morino, K., Murata, H., Asaoka, R., & Yamanishi, K. (2016). Predicting Glaucomatous Progression with Piecewise Regression Model from Heterogeneous Medical Data. HEALTHINF, 2016.